Exploring SNP Diversity in Wheat Landraces Germplasm and Setting of a Molecular Barcode for Fingerprinting
G. ManGini1*, D. niGro1, B. MarGiotta2, P. De Vita3, a. GaDaleta4, r. SiMeone1 and a. Blanco1
1Department of Soil, Plant and Food Sciences (DiSSPA), Sect. Genetics and Plant Breeding, University Aldo Moro, Via Amendola 165/A, Bari, 70126 Italy
2Institute of Biosciences and Bioresources of the National Research Council (IBBR-CNR), Via Amendola 165/A, 70126, Bari, Italy
3Council for Agricultural Research and Economics – Research Centre for Cereal and Industrial Crops (CREA-CI), S.S. 673 km 25.200, 71122, Foggia, Italy
4Department of Agricultural and Environmental Sciences (DiSAAT), Research Unit of Genetics and Plant Biotechnology, University Aldo Moro, Via Orabona 4, 70126 Bari, Italy
(Received 22 January 2018; Accepted 13 April 2018;
Communicated by A. Börner)
During the last century wheat landraces were replaced by modern wheat cultivars leading to a gradual process of genetic erosion. Landraces genotyping and phenotyping are strategi- cally useful, as they could broaden the genetic base of modern cultivars. In this research, we explored Single Nucleotide Polymorphism (SNP) markers diversity in a collection of com- mon and durum wheats, including both landraces and Italian elite cultivars. A panel of 6,872 SNP markers was used to analyze the genetic variability among the accessions, using both the Principal Components Analysis (PCA) and the Neighbour Joining clustering method.
PCA analysis separated common wheat accessions from durum ones, and allowed to group separately durum landraces from durum elite cultivars. The Neighbour joining clustering validated PCA results, and moreover, separated common wheat landraces from common elite cultivars. The clustering results demonstrated that Italian durum landraces were poorly exploited in modern breeding programs. Combining cluster results with heterozygosity levels observed, it was possible to clarify synonymy and homonymy cases identified for Bianchetta, Risciola, Saragolla, Timilia and Dauno III accessions. The SNP panel was also used to detect the minimum number of markers to discriminate the studied accessions. A set of 33 SNPs were found to be highly informative and used for a molecular barcode, which could be useful for cultivar identification and for the traceability of wheat end-products.
Keyword: wheat landraces, SNP markers, cultivar identification, molecular barcode
Introduction
Wheat is an economically important cereal that is widely cultivated worldwide. Two ma- jor wheat species are grown throughout the world: Triticum aestivum (L.) subsp. aestivum
*Corresponding author; E-mail: giacomo.mangini@uniba.it; Phone: +39-080-5443003; Fax: +39-080-5442200
and Triticum turgidum (L.) subsp. durum [(Desf.) Husn.], mainly used for bread and pasta making, respectively.
Historically, the cultivation of wheat was based on the use of a large number of autoch- thonous populations, named “landraces”. A wheat landrace could be defined as a bulk of different pure lines (Harlan 1975) with a high capacity to tolerate biotic and abiotic stress- es, resulting in yield stability and intermediate yield level under low input agricultural systems (Zeven 1998). In the twentieth century, characterized by the improvement of modern agricultural practices and by the application of new breeding methods, the lan- draces were replaced by modern cultivars composed by a single pure line. The develop- ment of new selected homogeneous cultivars and the progressive dismissing of landraces, is leading to a severe genetic erosion of wheat diversity (see van de Wouw et al. 2010 for details). Bonnin et al. (2014) confirmed a gradual process of genetic erosion during the first half of the twentieth century, when landraces were replaced by modern pure lines.
This was due to the use of a limited number of lines as parents of new cultivars and the registration of only genetically fixed and homogeneous varieties (Bonneuil and Thomas 2009). Therefore, to broaden the genetic base of modern cultivars, several investigations pointed to genotyping and phenotyping wheat landrace collections (Lopes et al. 2015;
Oliveira et al. 2014; Wingen et al. 2014). Indeed, landrace collections show a much high- er level of genetic diversity than elite varieties (Wingen et al. 2017). There is a widely recognized imperative for breeding programs to use this genetic diversity by incorporat- ing landrace-derived cultivars into these programs (Moore 2015).
As reviewed by Stapley et al. (2010), the introduction of Next Generation Sequencing (NGS) allowed discovery, sequencing and genotyping of thousands of markers in a single step. Among them, Single Nucleotide Polymorphisms (SNPs) are the most abundant in plant genomes. They are suitable for genetic variation analysis, QTL mapping, genomic selection, map-based cloning, and other breeding applications. NGS technologies applied to wheat led to the development of different SNP panels and arrays, that can be success- fully used for both genetic studies (Cavanagh et al. 2013; Ganal et al. 2009; Wang et al.
2014) and SNP-based molecular barcode (Gao et al. 2016). A molecular barcode system could be useful for developing a traceability system of wheat flour chain.
The main goals of this work were to: i) explore the genetic diversity in wheat lan- draces using SNP markers; ii) clarify synonymous and homonymous cases among Italian landraces; iii) develop a SNP-based barcode with a minimal set of SNP markers.
Material and Methods Plant materials and genotyping
A collection of 66 wheat accessions including 39 landraces (25 durum and 14 common wheats) and 27 cultivars (20 durum and 7 common wheats) was considered in this study (Table 1 and Table S1*). Among the cultivars, 21 were selected as representative of Ital- ian germplasm and 6 foreign as checks. The landraces were obtained from the Seed Bank
*Further details about the Electronic Supplementary Material (ESM) can be found at the end of the article.
of the Institute of Biosciences and Bioresources of the Italian National Research Council (IBBR-CNR) and from Research Centre for Citrus and Mediterranean Crops, Council for Agricultural Research and Analysis of Agricultural Economics (CREA-ACM). The whole collection was evaluated for flowering time (days from 01 April) at Valenzano (Bari, Italy) in 2017 using a complete block design with three replications and plots consisting of 1-m rows, 30 cm apart. Standard procedures for analysis of variance was carried out.
Genomic DNA was extracted from fresh leaves pooled from 20 seedlings for each wheat accessions. Seedlings were pooled to provide a full representation of each sample.
A total of 50 ng/µL of genomic DNA from each wheat accessions was analyzed by using the 15K array made up of 13,006 SNP markers. This array is an optimized and reduced version of the 90K iSELECT SNP-chip described by Wang et al. (2014). Genotyping was performed by Trait Genetics GmbH (http://www.traitgenetics.de), following the manu- facturer’s recommendations, as described in Akhunov et al. (2009). The genotyping as- says were carried out with Illumina iScan reader and performed by using GenomeStudio software version 2011.1 (Illumina).
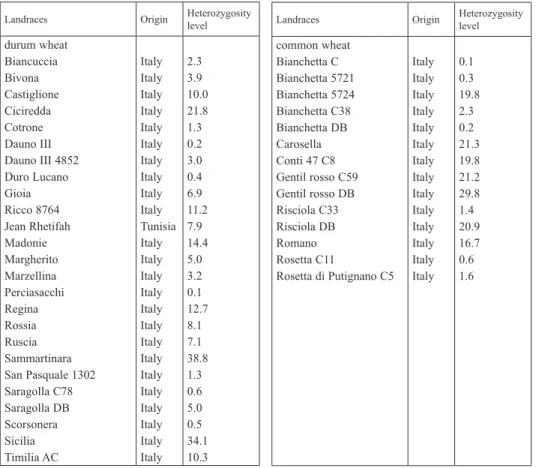
Table 1. Origin and heterozygosity level of wheat landraces evaluated with 15K array
Landraces Origin Heterozygosity
level durum wheat
Biancuccia Bivona Castiglione Ciciredda Cotrone Dauno III Dauno III 4852 Duro Lucano Gioia Ricco 8764 Jean Rhetifah Madonie Margherito Marzellina Perciasacchi Regina Rossia Ruscia Sammartinara San Pasquale 1302 Saragolla C78 Saragolla DB Scorsonera Sicilia Timilia AC
Italy Italy Italy Italy Italy Italy Italy Italy Italy Italy Tunisia Italy Italy Italy Italy Italy Italy Italy Italy Italy Italy Italy Italy Italy Italy
2.3 3.9 10.0 21.8 1.3 0.2 3.0 0.4 6.9 11.2 7.9 14.4 5.0 3.2 0.1 12.7 8.1 7.1 38.8 1.3 0.6 5.0 0.5 34.1 10.3
Landraces Origin Heterozygosity
level common wheat
Bianchetta C Bianchetta 5721 Bianchetta 5724 Bianchetta C38 Bianchetta DB Carosella Conti 47 C8 Gentil rosso C59 Gentil rosso DB Risciola C33 Risciola DB Romano Rosetta C11
Rosetta di Putignano C5 Italy Italy Italy Italy Italy Italy Italy Italy Italy Italy Italy Italy Italy Italy
0.1 0.3 19.8 2.3 0.2 21.3 19.8 21.2 29.8 1.4 20.9 16.7 0.6 1.6
Genetic analysis
Monomorphic SNP markers, those with more than 10% missing data and with Minor Allele Frequency (MAF) less than 5% were excluded from analysis. In this way a panel of 6,872 SNP markers was used to estimate the heterozygosity level and to explore the genetic variability among accessions using both the Principal Components Analysis (PCA) (Price et al. 2006) and the Neighbour Joining clustering method (Saitou and Nei, 1987). The analyses were carried out by the Tassel software version 5.0 (Bradbury et al.
2007).
To define the minimum number of SNP markers discriminating all the wheat acces- sions, the flow chart of SNP-based proposed by Gao et al. (2016) was used. The Polymor- phic Informative Content (PIC) was calculated according to Anderson et al. (1993).
We used the online free software Barcode (http://www.barcode-generator.org/) to gen- erate the 2D barcode for each accession. The genotype based on the SNP barcode was entered, and the 2D barcode was automatically generated.
Results
A wheat collection of 66 common and durum accessions was genotyped by the 15K array.
After filtering the SNPs dataset, a panel of 6,872 SNP markers was used for further anal- ysis. According to Wang et al. (2014), the majority of polymorphic SNP markers were located in the A (33%) and B (40%) genomes. Only 12% of markers mapped to the D genome (Table S2).
As shown in Table 1, within wheat landraces, heterozygosity showed a wide variabil- ity. Indeed, durum accessions Dauno III, Duro Lucano, Saragolla C78, Perciasacchi and Scorsonera, and common wheat Bianchetta C, Bianchetta 5721, Bianchetta DB and Rosetta C11 had very low heterozygosity levels (<1.0%), indicating that are close to be single pure lines. Sammartinara and Sicilia showed instead the highest ones (>30.0%), very likely because they are mixtures of several different lines.
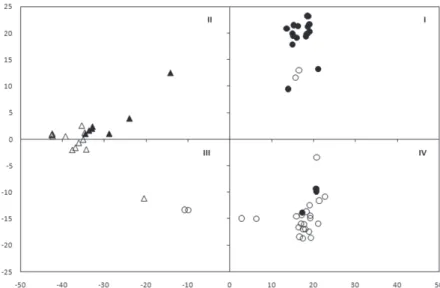
PCA analysis, carried out by using the 6,872 filtered SNPs, is reported in Figure 1.
A clear clustering was observed between common and durum wheats. In particular, com- mon wheat accessions clustered in the second and third quadrants, while durum acces- sions grouped in the first and fourth ones. Within the durum cluster, two main sub-groups were discriminated: the cultivars and the landraces groups, even though two accessions (Sammartinara and Sicilia), are placed in the fourth quadrant.
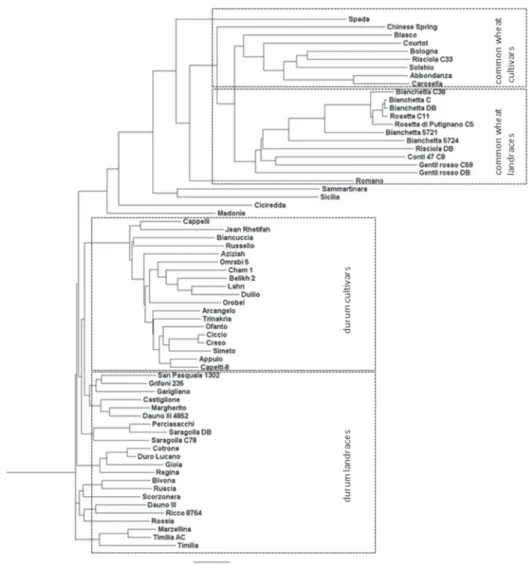
The phylogenetic tree reported in Figure 2, confirmed the results pointed out by PCA analysis. As shown, the tree agrees with the ploidy level (and taxonomic classification) of wheats, as the upper part included common wheat accessions, and the bottom grouped the durum ones. Moreover, the phylogenetic tree grouped separately the durum cultivars from landraces, as observed in PCA results. In addition, a clearer discrimination within common wheat accessions was evident: while landraces and cultivars were admixed in the PCA, they were finely clustered by the Neighbour joining clustering method. The two
groups (landraces and cultivars) showed differences for adaptive traits as flowering time.
Indeed, the cultivars flowered earlier than the landraces in both wheat species (Figure S1).
The phylogenetic tree also clarified some synonymous cases observed in the analyzed panel. Common wheat accessions Bianchetta C38, Bianchetta C, Bianchetta DB, Rosetta C11, Rosetta di Putignano and Bianchetta 5721, showed low genetic distances (<0.2 of Genetic Diversity) among themselves. Nevertheless, they were found genetically distant (>0.4 of Genetic Diversity) from Bianchetta 5724 (Figure 2). A synonymous case was also observed between durum accessions Saragolla DB and Saragolla C78. Also homon- ymy cases were found in common wheat (Gentil rosso C59/Gentil rosso DB; Risciola DB/Risciola C33) as well as in durum accessions (Dauno III/Dauno 4852).
In order to identify a minimum number of SNP markers discriminating each acces- sion of the collection, the panel of 6,872 SNP markers was analyzed, according to the flow-chart suggested by Gao et al. (2016). The PIC value was calculated for each SNP, and 155 loci, showing the highest PIC value (PIC = 0.50) were kept. To further reduce this number, only SNPs markers with <5% missing data were retained. In this way, 30 informative SNP markers were selected. To evaluate the resolution of these SNPs, the Neighbour joining tree was tested on the 61 accessions (Bianchetta C38, Bianchetta DB, Bianchetta 5721, Rosetta C11 and Rosetta di Putignano C5 were excluded from analysis for high similarity with Bianchetta C). Among them, 55 accessions were distinguished from each other, accounting for 90.1% of wheat panel. The remaining 6 accessions (9.9%) clustered in three groups, each with two durum genotypes sharing the same SNP profile: Castiglione/Cotrone, Dauno 4852/Grifoni 235 and Perciasacchi/Saragolla DB.
Figure 1. Principal component analysis of wheat accessions genotyped with the 15K array. The symbols Ο and Δ were used to indicate durum and common wheat accessions. The color white and black were used for land-
races and cultivars respectively. I, II, III and IV indicate the four quadrants
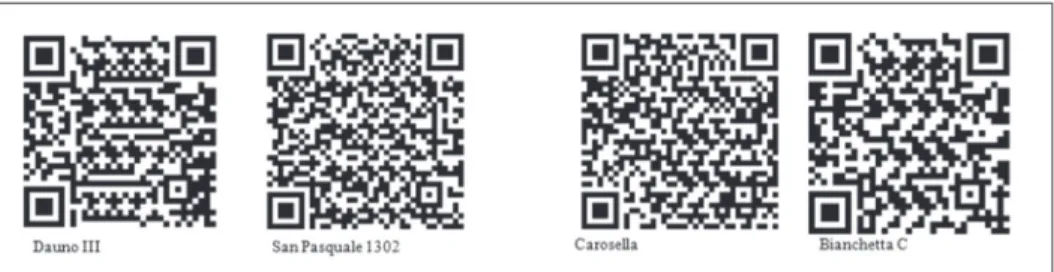
To finely discriminate these cases, the filtered SNP markers panel was screened for each pair of not distinguished accessions. For each comparison, the most informative SNP was chosen among the identified polymorphic ones. So far, a list of 33 markers (Table S3) was used to generate a SNP-based molecular barcode for each accession. The finger- prints of these accessions were translated into a 2D barcode that is easily accessible by cell phone (Figure 3).
Figure 2. Phylogenetic tree obtained by Neighbor-Join method in wheat collection, including landraces and cultivars
Discussion
The analysis carried out in the wheat collection using a set of 6,872 SNP markers, showed a noticeable division into durum and common wheat accessions and a clear discrimina- tion of landraces from elite cultivars. The heterozygosity level mean was found to be lower in cultivars (0.5%) than landraces (9.4%). The “cultivar” can be considered to be pure lines and should therefore exhibit a very limited heterozygosity. The wheat “lan- drace” can be defined as a bulk of pure lines; therefore, high heterozygosity level is ex- pected when different lines of same accession are pooled, as done in this study. Oliveira et al. (2014) tested a panel of 5,386 SNPs on several tetraploid landraces by genotyping a pool of five individual plants for each accession. The average of heterozygous loci was found to be 17.8% and they attributed this result to the genetic variation existing among the five individual plants bulked for each accession and/or to the heterozygosity of the single plants.
Our results showed that durum Italian landraces constituted a main group, suggesting that autochthonous Italian germplasm represents a secondary gene pool poorly exploited in modern durum breeding programs. Indeed, only the obsolete durum cultivars Timilia, Garigliano and Grifoni 235 clustered with durum landraces (Figure 1 and 2). Timilia was selected within Sicilian “Timilia landrace”; Garigliano was obtained by a cross with the Italian “Tripolino landrace”, and Grifoni 235 deriving from crossing cultivar Cappelli and an unknown parental (Grifoni 1955) that, according to our results, could be derived from an Italian landrace. Therefore, Timilia, Garigliano and Grifoni 235 can be considered durum cultivars directly derived from autochthonous Italian germplasm.
Durum wheat cultivars cluster was split in two clades: the first including only the ones released in Italy (Arcangelo, Trinakria, Ofanto, Ciccio, Creso, Simeto, Appulo and Capeiti-8), and the second one consisting mainly of those realized in the Middle-East (Aziziah, Omrabi 5, Cham 1, Belikh 2, Lahn). The old durum cultivar Cappelli, consid- ered to be the founder of several modern Italian cultivars (Maccaferri et al. 2003; Mac- caferri et al. 2007), grouped in the Middle-East released cultivars clade. This result con- firmed that Cappelli is a pure line selected from a North-African accession (Jean Rhetifa).
Within the Italian cultivars clade, also Appulo and Capieti-8 can be considered founders, as demonstrated by their pedigree data (Table S1).
Figure 3. Example of 2D barcode for two durum (Dauno III and San Pasquale 1302) and common (Carosella and Bianchetta C) wheat accessions based on 33 SNP markers
Based on the cluster analysis, the accessions Sicilia, Sammartinara, Ciciredda and Ma- donie, seemed to be a mixture of both common and durum wheat lines (Figure 2). This result could be due to the farmers’ harvesting methods. Indeed, landraces cultivation and propagation have been managed mainly by farmers without a severe seed purity check and thus leading to material contamination.
The phylogenetic tree highlighted that within Italian landraces group, synonymy and homonymy cases exist. The most evident was observed among Bianchetta C38, Bian- chetta C, Bianchetta DB, Bianchetta 5721, Rosetta C11 and Rosetta di Putignano C5, that showed high similarity (<0.2 of Genetic Diversity) and low heterozygosity levels (<2.5%).
This suggested that these common wheat accessions could be pure lines obtained from
“Bianchetta landrace”. This landrace was widely cultivated in Central and Southern Italy and displayed considerable environmental adaptability and yield stability (De Cillis 1927). The Bianchetta 5724 showed a high heterozygosity level (19.8%) and, according to our phylogenetic analysis, could be the landrace from which the accessions named
“Bianchetta” or “Rosetta” were selected (Figure 2).
Risciola DB showed a high heterozygosity level (20.9%) and clustered in the common wheat landraces group. Risciola C33 showed a lower heterozygosity (1.4%) and was in- cluded in common wheat cultivars cluster. This suggested that Risciola DB could corre- spond to “Risciola landrace” not related to Risciola C33, as it could be a pure line. Both accessions Gentil rosso C59 and Gentil rosso DB showed high heterozygosity levels (>20.0%) and resulted to be genetically distant (>0.6 of Genetic Diversity), although they grouped in the common wheat cluster. This homonymy case prevented the correct assess- ing of “Gentil rosso landrace”, already mentioned from De Cillis in 1927.
The durum accessions Saragolla C78 and Saragolla DB were phylogenetically close but they showed different heterozygosity levels (0.7 and 5.0%, respectively), proposing that Saragolla C78 could be a pure line selected within Saragolla DB, probably matching
“Saragolla landrace”. Similarly, the cultivar Timilia, which showed a low heterozygosity levels (0.2%), was found strongly related to Timilia AC (heterozygosity levels 10.3%), from which it could have been selected. Particularly interesting seems to be also the be- havior of the Marzellina, a wheat landrace anciently cultivated in Central and South-Italy mainly in sowing spring, which significantly cluster with Timilia a typical Sicilian wheat of more ancient origin whose name derives from the latin “tres-menses” which means the wheat of the “three months” because it was normally sown in spring (March) and col- lected in June after about three months. So, according to this study, Marzellina could be derived from the Sicilian landrace Timilia.
Dauno III belongs to a set of durum lines, distinguished with the numbers I to VIII, produced by Nazareno Strampelli by crossing unknown parental lines (De Cillis 1927).
Among these, Dauno III was the most widespread in Southern Italy because of its high grain yield. The low heterozygosity level observed in Dauno III (0.2%) could be the result of Strampelli’s selection pure lines programs. The accession Dauno III 4852 showed a genetic variation (3.0%) similar to that observed by Mangini et al. (2017) (3.2%). Never- theless, based on our results, durum accessions Dauno III and Dauno III 4852 seems to be not related.
Different genetic markers have been used for fingerprinting wheat germplasm (Bányai et al. 2006; Fujita et al. 2009; Mangini et al. 2010; Mangini et al. 2017). The first markers used were based on Southern blot procedure, such as Restriction Fragment Length Poly- morphisms (RFLPs). These markers were dismissed in wheat as complex, costly, and poorly polymorphic. A second generation of genomic markers occurred with Simple Se- quence Repeats (SSRs), easy to obtain at lower cost and highly informative (Mangini et al. 2010). Actually, a large number of SNPs have been identified by the array technology (Wang et al. 2014) and can be considered as the third-generation of markers. SNPs are highly frequent in the genome, easy to detect, cost efficient and provide the opportunity to extend DNA barcoding in crops. Gao et al. (2016) developed a flow chart of SNP-based molecular barcode to define a minimum SNP number to discriminate common wheat ac- cessions. Here, we have tested this flow chart in our germplasm and we have identified 33 SNPs that could be used to create a SNP-barcode. None of them was in common with the ones reported by Gao et al. (2016), suggesting that exotic wheat germplasm is genetically diverse from the Mediterranean one.
In conclusion, we pointed out the informative power of SNPs markers in exploring genetic diversity in wheat germplasm and the genetic relationship between Italian lan- draces and Mediterranean cultivars. Moreover, we demonstrated that SNPs are a good tool to discriminate wheat accessions, and, that they can be successfully used for barcodes development, useful for a traceability system of wheat end-products.
Acknowledgements
The work was supported by the project SaVeGraINPuglia – Progetto Integrato per la Bio- diversità, PSR Regione Puglia, FEASR 2014-2020, Misura 10.2.1 “Progetti per la con- servazione e valorizzazione delle risorse genetiche in agricoltura e selvicoltura” Reg.
(CE) 1305/2013 trascinamento Misura 214 PSR Puglia 2007/2013”.
References
Akhunov, E., Nicolet, C., Dvorak, J. 2009. Single nucleotide polymorphism genotyping in polyploid wheat with the Illumina Golden Gate assay. Theor. Appl. Genet. 119:507–517.
Anderson, J.A., Churchill, G.A., Sutrique, J.E., Tanksley, S.D., Sorrells, M.E. 1993. Optimizing parental selec- tion for genetic linkage maps. Genome 36:181–186.
Bányai, J., Szűcs, P., Karsai, I., Mészáros, K., Kuti, C., Láng, L., Bedő Z. 2006. Cultivar identification by molecular markers. Cereal Res. Commun. 34:865–870.
Bonneuil, C., Thomas, F. 2009. Gènes, Pouvoirs et Profits. Ed. Quae-FPH, Paris.
Bonnin, I., Bonneuil, C., Goffaux, R., Montalent, P., Goldringer, I. 2014. Explaining the decrease in the genetic diversity of wheat in France over the 20th century. Agr. Ecosyst. and Environ. 195:183–192.
Bradbury, P.J., Zhang, Z., Kroon, D.E., Casstevens, T.M., Ramdoss, Y., Buckler, E.S. 2007. TASSEL: software for association mapping of complex traits in diverse samples. Bioinformatics 23:2633–2635.
Cavanagh, C.R., Chao, S., Wang, S. 2013. Genome-wide comparative diversity uncovers multiple targets of selection for improvement in hexaploid wheat landraces and cultivars. P. Natl. Acad. Sci. USA 110:8057–
8062.
De Cillis, E. 1927. I grani d’Italia. Tipografia della Camera dei Deputati (ed.), Roma, Italy.
Fujita, Y., Fukuoka, H., Yano, H 2009. Identification of wheat cultivars using EST–SSR markers. Breeding Sci.
59:159–167.
Ganal, M.W., Altmann, T., Röder, M.S. 2009. SNP identification in crop plants. Curr. Opin. Plant Biol. 12:211–
217.
Gao, L., Jia, J., Kong, X. 2016. A SNP-Based molecular barcode for characterization of common wheat. PLoS ONE 11(3):e0150947.
Grifoni, E. 1955. Nuovi grani per l’Italia meridionale. Genetica agraria, pp. 366–377.
Harlan, J.R. 1975. Crops and Man. American Society of Agronomy. Madison, Wisconsin. pp. 150–189.
Lopes, S.M., El-Basyoni, I., Baenziger, P.S., Singh, S., Royo, C., Ozbek, K., Aktas, K., Ozer, E., Ozdemir, F., Manickavelu, A., Ban, T., Vikram, P. 2015. Exploiting genetic diversity from landraces in wheat breeding for adaptation to climate change. J. Exp. Bot. 66:3477–3486.
Maccaferri, M., Sanguineti, M.C., Donini, P., Tuberosa, R. 2003. Microsatellite analysis reveals a progressive widening of the genetic basis in the elite durum wheat germplasm. Theor. Appl. Genet. 107:783–797.
Maccaferri, M., Sanguineti, M.C., Xie, C., Smith, J.S.C., Tuberosa, R., 2007. Relationships among durum wheat accessions. II. A comparison of molecular and pedigree information. Genome 50:385–399.
Mangini, G., Margiotta, B., Marcotuli, I., Signorile, M.A., Gadaleta, A., Blanco, A. 2017. Genetic diversity and phenetic analysis in wheat (Triticum turgidum subsp. durum and Triticum aestivum subsp. aestivum) lan- draces based on SNP markers. Genet. Resour. Crop Ev. 64:1269–1280.
Mangini, G., Taranto, F., Giove, S.L., Gadaleta, A., Blanco, A. 2010. Identification of durum wheat cultivars by a minimum number of microsatellite markers. Cereal Res. Commun. 38:155–162.
Moore, G. 2015. Strategic pre-breeding for wheat improvement. Nature Plants 1:15018.
Oliveira, H.R., Hagenbland, J., Leino, M.W., Leigh, F., Lister, D.L., Penã-Chocarro, L., Jones, M.K. 2014.
Wheat in the Mediterranean revisited-tetraploid wheat landraces assessed with elite bread wheat Single Nucleotide Polymorphism markers. BMC Genet. 15:54.
Price, A.L., Patterson, N.J., Plenge, R.M., Weinblatt, M.E., Shadick, N.A., Reich, D. 2006. Principal compo- nents analysis corrects for stratification in genome-wide association studies. Nat. Genet. 38:904–909.
Saitou, N., Nei, M. 1987. The neighbor-joining method: a new method for reconstructing phylogenetic trees.
Mol. Biol. Evol. 4:406–425.
Stapley, J., Reger, J., Feulner, P.G., Smadja, C., Galindo, J., Ekblom, R., Bennison, C., Ball, A.D., Beckerman, A.P., Slate, J. 2010. Adaptation genomics: the next generation. Trends Ecol. Evol. 25:705–712.
van de Wouw, M., van Hintum, T., Kik, C., van Treuren, R., Visser, B. 2010. Genetic erosion in crops: concept, research results and challenges. Plant Genetic Resources 8:1–15.
Wang, S., Wong, D., Forrest, K. 2014. Characterization of polyploid wheat genomic diversity using a high- density 90000 single nucleotide polymorphism array. Plant Biotechnol. J. 12:787–796.
Wingen, L.U., Orford, S., Goram, R., Leverington-Waite, M., Bilham, L., Patsiou, L.S., Ambrose, M. Dicks J., Griffiths S. 2014. Establishing the A. E. Watkins landrace cultivar collection as a resource for systematic gene discovery in bread wheat. Theor. Appl. Genet. 127:1831–1842.
Wingen, L.U., West, C., Leverington-Waite, M., Collier, S., Orford, S., Goram, R., Yang, C.Y., King, J., Allen, A.M., Burridge, A., Edwards, K.J., Griffiths, S. 2017. Wheat landrace genome diversity. Genetics.
205:1657–1676.
Zeven, A.C. 1998. Landraces: A review of definitions and classifications. Euphytica 104:127–139.
Electronic Supplementary Material (ESM)
Electronic Supplementary Material (ESM) associated with this article can be found at the website of CRC at https://akademiai.com/loi/0806
Electronic Supplementary Table S1. Year and Country of Registration, pedigree and heterozygosity level of wheat cultivars evaluated with 15 k SNP array
Electronic Supplementary Table S2. Distribution of 6,872 SNP markers used to explore the diversity in wheat landraces
Electronic Supplementary Table S3. Information about the 33 SNP based on molecular barcode in wheat col- lection
Electronic Supplementary Figure S1. Flowering time (days from 01.04) in a wheat collection evaluated at Valenzano (Bari, Italiy) in 2017. The bars grey and white indicated the mean values of landraces and cultivars
respectively