Table of contents
1. Introduction 2
2. Literature 3
2.1 Standards 3 2.1.1 Hungarian standards for grain inspection 3 2.1.2 Grain inspection in the United States 4 2.1.3 Regulation of standard qualities for common wheat, rye, barley, maize and durum wheat in the European Community 8 2.2 Digital imaging 11 2.2.1 Illumination 11 2.2.2 Color measurement 12 2.2.3 Shape estimation 16 2.2.4 Texture analysis 20 2.3 Summary of literature 22 3. Objectives 23
4. Methods and materials 24
4.1 Vision system 24 4.2 Materials 24 4.3 Segmentation 25 4.4 Shape description 25 4.4.1 Generating outline data sets 25 4.4.2 Estimation with mathematical functions 27 4.4.3 Chaotic properties of shape 29 4.5 Color measurement 32 4.6 Evaluation of surface texture 33 4.7 Statistical evaluation 34 4.7.1 Discriminant analysis 34 4.7.2 Distance function 35 5. Results and discussion 36
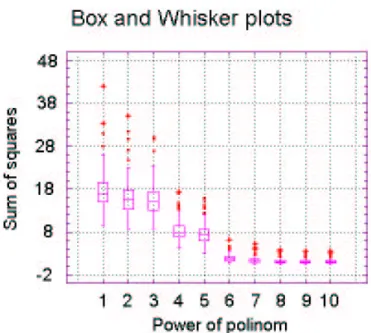
5.1 Outline estimation with sine functions 36 5.1.1 Sine function with variable period 36 5.1.2 Sine functions with variable amplitude 39 5.2 Polynomial regression on outline 42 5.3 Chaotic parameters of shape 44 5.4 Color information 47 5.5 Texture analysis 48 5.5.1 Evaluation based on PQS method 48 5.5.2 Evaluation with other methods 50 5.6 Optimal parameter set 51 6. Summary and conclusions 57
6.1 Methodology 58 6.2 Results and conclusions 60 7. Acknowledgments 61
8. Publication activity 62
9. References 64
10.Magyar nyelvû összefoglaló és tézisek 68
10.1 Módszerek fejlesztése 69
10.2 Eredmények és következtetések 71
1. Introduction
Almost as soon as digital computers became available, it was realized that they could be used to process and extract information from digitized images. Initially, work on digital image analysis dealt with specific classes of images such as text, photomicrographs, nuclear particle tracks, and aerial photographs; but by the 1960s, general algorithms and paradigms for image analysis began to be formulated. When the artificial intelligence community began to work on robot vision, these paradigms were extended to include recovery of three−dimensional information, at first from single images of a scene, but eventually from image sequences obtained by a moving camera; at this stage, image analysis had become scene analysis or computer vision. An ’existence proof’ for the feasibility of computer vision tasks is that animals and humans use vision quite effectively in the real world. A possible basis for this is that biological visual systems make use of redundant visual data and process it on redundant
’pathways’. Computer vision systems usually avoid such redundancy in order to reduce computational cost. History of digital image processing over the past half−century led to many elegant mathematical models and algorithms, as well. Real−world visual domains do not satisfy simple mathematical or probabilistic models. The inadequacy of scene models does not imply that computer vision systems will never perform adequately. Indeed, in many areas of application, successful image analysis and computer vision systems have been developed and marketed, even though the classes of scenes involved can be modeled only crudely, and the systems generally make use of ad hoc methods (A. Rosenfeld, 2000).
There is a growing interest in the grain industry for on−line monitoring of grain. Rapid evaluation of the content of a sample can be used to develop optimum cleaning strategies, make appropriate decisions, and for complete automation of certain operations. Such monitoring would result in increased throughput and enhanced recovery of salvageable grains. A sample of grain may contain seeds of several species and numerous type of impurities. The machine vision system should identify the primary grain from other materials present in a sample. The positive identification of the primary grain and determination of the fractions of small and large seeds in a sample is important in automating the controls of grain cleaning machinery (Shatadal et.al., 1995). In addition, grain−throughput of the combine and the loss of grain at this throughput are used to determine performance of grain harvesting machines. Portion of broken kernels in the separated grain is another important quality criteria in this case (Schneider, Häußer, Kutzbach, 1997). The mentioned quality parameters are usually measured by visual inspection. This type of evaluation takes too long, and allocates valuable human resources (requires well−trained people with experience).
Computerized image analysis is an objective and nondestructive method for measurement of morphometrical features such as shape, size, color and surface texture. It allows experts to describe visible attributes accurately. The importance of such support appears in the national and international standards and directives, where hand−picking is still the most important argument in the evaluation of purity of incoming or outgoing cereals.
2. Literature
2.1. Standards
2.1.1. Hungarian standards for grain inspection
Methodology for inspection of foreign materials is defined in the MSZ 6354/1−2 and MSZ 6367−2 standards in Hungary. This analysis is based on hand−picking. Equipment can help in advance assorting (bolter, aspirator, mixer). The following table presents minimum required sample size and maximum quantity of grain to be represented by a sample:
Table 1: Sample size requirements of the standard MSZ 6354/2−82 Maximum quantity
of one unit
Base Laboratory Evaluation
Minimum sample size Hungarian
kg
International
kg kg
Hungarian g
International g
Hungarian g
International g
25000 25000 10 1000 1000 100 120
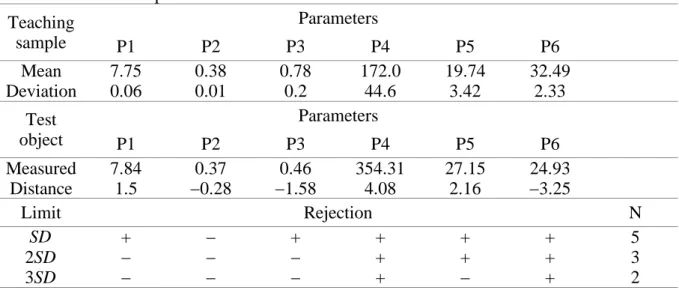
The quality report contains weight of the sample, name of the varieties and the number of kernels examined. Two parallel measurements have to be performed. The standard defines the maximum acceptable deviation from the average value. Limits were computed according to the expected differences without any error in the measurement.
Table 2: Quality requirements of wheat standard MSZ 6383
Quality requirements
Common wheat
extra in milling industry Durum wheat
quality I. II. III. I. II.
Test weight, kg/100 l 78 76 72 78 75
Moisture content, % 14.5 14.5 14.5 14.5 14.5
Mixed materials, % 2.0 2.0 2.0 2.0 2.0
− adverse materials % 0.5 0.5 0.5 0.5 0.5
− light mixture % 0.5 0.5 0.5 0.5 0.5
Over the 2.0 % allowed:
− broken grain, % 2.0 2.0 6.0 2.0 2.0
− germinated, % 2.0 2.0 5.0 2.0 2.0
− rye, % 2.0 2.0 3.0 − −
− defective kernels, % 2.0 2.0 2.0 3.0 3.0
− discolored kernels, % − − − 3.0 8.0
− chinch attacked, % * − 2 4 2 2
− common wheat, % − − − 4.0 10
Vitreous at least, % * − − 60 30
Fragments of insects NOT ALLOWED
* Number of kernels of certain attribute
Adverse materials are inorganic or organic materials with negative effect on food product or toxic seeds (weeds, blighted or mold damaged kernels: Datura stramonium, Conium maculatum, Claviceps purpurea, etc.). Defective kernels cannot be used in food production and are restricted in forage as well. Vitreosity tests are important in Hungary and have had significance since 1968. This quality parameter depends on the composition, structure and hardness of the endosperm.
Abnormal odor in cereals means:
smell of alcoholic fermentation or fermentation of lactic, acetic or butyric acid
musty or close air (probably as a result of mold damage)
sour smell because of the oxidative changes of fat
smell of chemicals, inorganic oil, other plants 2.1.2. Grain inspection in the United States
The Grain Inspection, Packers and Stockyards Administration, Federal Grain Inspection Service (FGIS), an agency of the United States Department of Agriculture (USDA), helps to move grain into the market place by providing farmers, grain handlers, processors, exporters, and international buyers with information that accurately and consistently describes the quality and quantity of grain being bought and sold. The official inspection and weighing system is a unique public−private partnership overseen by FGIS. The system includes Federal offices and States and private agencies authorized by FGIS to provide official inspection and weighing service to the domestic and export grain trade. The Official United States Standards for Grain provide the criteria for determining the kind, class, and condition of grain. The standards also define quality and condition factors and set grade limits based on factor determinations. Quality factors, which vary by grain, include test weight, damaged kernels, and foreign materials. Condition factors include heating, objectionable odor, and insect infestation. It is important to note that the Official United States Standards for Grain are not seasonally adjusted, regardless of average new crop quality.
The process of inspecting grain begins with sampling and usually follows a prescribed path whether the grain is being inspected for grade or for factors only. First, the sample is examined for objectionable odor, insect infestation, and other harmful or unusual conditions.
Then, a portion of grain is divided out from the sample and its moisture content is determined. The sample may next be tested for dockage, followed by a test weight determination. For some grains, test weight is determined before dockage. After this, the sample is divided into small portions; and the portions are examined for other factors, such as damaged kernels and foreign material. All equipment are tested at least twice a year against known standards and are adjusted as needed. When reducing samples in size or dividing factor portions from samples, Boerner dividers or any other devices that gives equivalent results are used. The recommended minimum portion sizes are as follows:
Table 3: Recommended minimum portion sizes by FGIS
Barley Corn Oats Sorghum Soybeans Wheat Portion weights in grams
Damage 15 125 30 15 125 15
Dockage 250 N/A N/A 250 N/A 250
Foreign material 30 250 30 250 125 30
Heating The lot as a whole
Infestation The original sample or lot as a whole
Moisture Amount recommended by the instrument manufacturer Objectionable odors The original sample or lot as a whole
Oil Amount recommended by the instrument manufacturer Protein Amount recommended by the instrument manufacturer Test weight Amount recommended by the instrument manufacturer
For other types of grain, the portion sizes recommended for a grain of similar size are used.
Grain that is contaminated by harmful substances is graded as "U.S. Sample grade." To be
considered "contaminated," the original sample must contain:
Animal filth (e.g., excreta)
corn: animal filth in excess of 0.20 %.
barley, flaxseed, oats, sorghum, soybeans, and sunflower seed: 10 or more rodent pellets, bird droppings, or an equal quantity of other animal filth.
rye, triticale, and wheat: 2 or more rodent pellets, bird droppings, or an equal quantity of other animal filth.
Castor Beans
All grains except canola: 2 or more castor beans.
Cockleburs
barley, corn, flaxseed, and sorghum: 8 or more cockleburs or similar seeds.
Crotalaira Seeds
All grains, except canola: 3 or more crotalaria seeds
Distinctly low quality
All grains: when a lot of grain is of inferior quality because of an unusual state or condition and it cannot be graded properly using the grading factors provided in the standards.
Glass
All Grains, except wheat and canola: 2 or more pieces of glass.
wheat and canola: 1 or more pieces of glass.
Stones
barley, rye, and triticale: 8 or more stones or any number of stones which have an aggregate weight in excess of 0.2 % of the sample weight.
flaxseed, oats, sorghum, soybean and sunflower seed: 8 or more stones which have an aggregate weight in excess of 0.2 % of the sample weight.
corn: 1 or more stones which have an aggregate weight in excess of 0.1 % of the sample weight.
wheat: 4 or more stones or any number of stones which have an aggregate weight in excess of 0.1 % of the sample weight.
Unknown foreign substance
All grains, except canola: 4 or more particles of an unknown foreign substance, including rock salt or crystalline substances, or a commonly recognized harmful or toxic substance, including so−called "pink wheat."
canola: 2 or more particles of an unknown foreign substance, including rock salt or crystalline substances, or a commonly recognized harmful or toxic substance.
Wheat that contains a total of 5 or more particles of any harmful substances should be considered "contaminated" and graded "U.S. Sample grade." The amount of foreign material in canola, flaxseed, mixed grain, mustard seed, rapeseed, or sunflower seed is not usually determined. Foreign materials are:
for barley: all matter other than barley, other grains, and wild oats that remains in the sample after the removal of dockage.
for corn: all matter that passes readily through a 12/64−inch round−hole sieve and all matter other than corn that remains in the sample after sieving.
for rye and triticale: all matter other than rye (or triticale) that remains in the sample after the removal of dockage.
for soybeans: all matter that passes through an 8/64−inch round−hole sieve, and all matter other than soybeans that remains in the sample after sieving.
for wheat: all matter other than wheat that remains in the sample after the removal of dockage and shrunken and broken kernels.
Determination of foreign materials is done by mechanical dockage tester (corn, sorghum, sunflower seed), hand sieves (corn, oats, sorghum, soybeans) or handpicking (barley, oats, rye, triticale, sorghum, soybeans, sunflower seed, wheat).
The most common types of kernel damage are germ−, frost−, immature−, heat−, mold−, scab−, sprout−, insect−, ground−, and cob rot−damage. Most of these types of damage result in some sort of discoloration or change in kernel texture. If two or more insect−damaged kernels are found in a 15 g portion of wheat, a second 15 g portion is examined. If two or more insect−damaged kernels are found in the second portion, a 70 g portion is examined and then the number of insect−damaged kernels found in all three portions are combined. If 32 or more insect−damaged kernels are found in the combined portions (i.e., 100 grams) the wheat is classed "U.S. Sample grade." If fewer than two insect−damaged kernels are found in either the first or second portion, the examination is discontinued.
Table 4: Characteristics of damages according to US Grain Standard Acts Type of damage Characteristics
Black Tip Fungus−Damaged Kernels (wheat)
Kernels with black tip fungus growth on the germ and in the crease of the kernel.
Blue−Eye Mold−Damaged Kernels (corn)
Kernels with blue mold in the germ. Blue−eye mold should not be confused with purple plumule, which is not a type of damage. Purple plumule is generally purple in color and is always found in the center of the germ.
Cob Rot−Damaged Kernels (corn)
Kernels that are distinctly discolored or rotting as a result of a fungus that attacks corn ears.
Drier−Damaged Kernels Kernels that are discolored, wrinkled, and blistered; or are puffed or swollen and slightly discolored, and often have damaged germs; or whose seed coats are peeling off or appear fractured.
Frost−Damaged Kernels Kernels that are discolored, blistered, or have a slightly flaked−off bran coat; or kernels with a distinctly wax−like or candied appearance due to frost.
Germ−Damaged Kernels Kernels that are discolored by heat or mold resulting from respiration.
Ground− or Weather−
Damaged Kernels
Kernels with dark stains or discoloration and rough cake−like appearance caused by ground and/or weather conditions.
Heat−Damaged Kernels Kernels that are materially discolored and damaged by external heat or as the result of heating caused by fermentation.
Immature− or Green−
Damaged Kernels
Kernels that are intensely green in color.
Malt−Damaged Kernels (barley)
Kernels that have undergone the malting process and show any degree of sprout.
Mold−Damaged Kernels (External)
Kernels that have considerable evidence of mold.
Mold−Damaged Kernels (Internal)
Kernels that have any evidence of mold.
Scab−Damaged Wheat Kernels
Kernels having a dull, lifeless, and chalky appearance.
Weevil− or Insect−Damaged Kernels
Kernels which bear evidence of boring or tunneling by insects.
The Official United States Standards for Grain describe the numerical grades for cereals (barley, oats, rye, triticale, wheat, etc.). The lowest grade that may be assigned to any of these grains is "U.S. Sample grade." This grade is applied to grain that:
Does not come within the grade requirements of any of the numerical grades;
Has a musty, sour, or commercially objectionable foreign odor;
Is heating;
Contains 32 or more insect−damaged kernels per 100 grams (wheat only);
Is contaminated with stones, pieces of glass, toxic seeds, unknown or toxic substances, animal filth, crotalaria seeds, or castor beans;
Is otherwise of distinctly low quality.
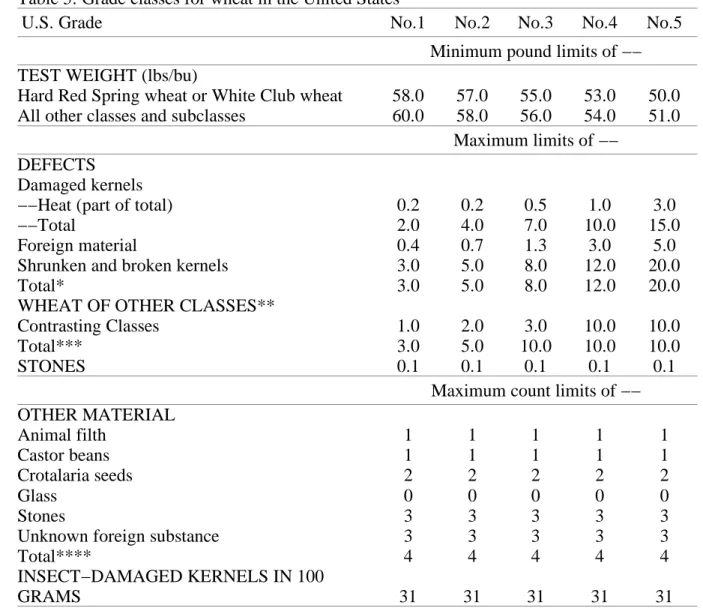
Table 5: Grade classes for wheat in the United States
U.S. Grade No.1 No.2 No.3 No.4 No.5
Minimum pound limits of −−
TEST WEIGHT (lbs/bu)
Hard Red Spring wheat or White Club wheat All other classes and subclasses
58.0 60.0
57.0 58.0
55.0 56.0
53.0 54.0
50.0 51.0 Maximum limits of −−
DEFECTS Damaged kernels
−−Heat (part of total)
−−Total
Foreign material
Shrunken and broken kernels Total*
WHEAT OF OTHER CLASSES**
Contrasting Classes Total***
STONES
0.2 2.0 0.4 3.0 3.0 1.0 3.0 0.1
0.2 4.0 0.7 5.0 5.0 2.0 5.0 0.1
0.5 7.0 1.3 8.0 8.0 3.0 10.0
0.1
1.0 10.0
3.0 12.0 12.0 10.0 10.0 0.1
3.0 15.0
5.0 20.0 20.0 10.0 10.0 0.1 Maximum count limits of −−
OTHER MATERIAL Animal filth
Castor beans Crotalaria seeds Glass
Stones
Unknown foreign substance Total****
INSECT−DAMAGED KERNELS IN 100 GRAMS
1 1 2 0 3 3 4 31
1 1 2 0 3 3 4 31
1 1 2 0 3 3 4 31
1 1 2 0 3 3 4 31
1 1 2 0 3 3 4 31
In Table 5:
*Includes damaged kernels (total), foreign material, and shrunken and broken kernels.
**Unclassed wheat of any grade may contain not more than 10.0 percent of wheat of other classes.
***Includes contrasting classes
****Includes any combination of animal filth, castor beans, crotalaria seeds, glass, stones, or unknown foreign substance.
2.1.3. Regulation of standard qualities for common wheat, rye, barley, maize and durum wheat in the European Community
The regulation EEC No. 2731/75 of the Council of 29 October 1975 is to fix standard quality and price for wheat, rye, maize, sorghum and durum wheat with reference to specific standard qualities. These specifications should correspond as far as possible to the average qualities of those cereals harvested under normal conditions within the community. This document was modified more times. The last amendment was done by document 397R2594, in 1997.
The standard quality for which the target price and the threshold prices for common wheat are fixed is defined as wheat of a sound and fair merchantable quality, free from abnormal smell and live pests, of a color specific to this cereal (article 1). The physical quality criteria:
moisture content should not exceed 14 %.
The total percentage of matter other than basic cereals of unimpaired quality is maximum 5 %, of which the maximum percentage of
broken grains is 2 %
grain impurities is 1.5 %. This means shriveled grains, grains of other cereals, grains damaged by pests, grains showing discoloration of the germ and grains heated by drying.
sprouted grains is 1 %
miscellaneous impurities is 0.5 %. This group consists of extraneous seeds, damaged grains, extraneous matter, husks, ergot, decayed grains, dead insects and fragments of insects.
The specific weight is 76 kg/hl. The technical quality criteria for common wheat are:
the dough from such wheat does not stick during the mechanical kneading process
the protein content (5.7 x N), in terms of dry matter, is at least 11.5 %
the Zeleny index is at least 25
the Hagberg falling number is at least 230, including preparation (agitation) time of 60 s The standard quality for rye is defined as rye of a sound and fair marketable quality, free from abnormal smell and live pests, of a color proper to this cereal (article 2). Maximal moisture content is 16 %. The total percentage of matter other than basic cereals of unimpaired quality is maximum 5 %, of which the maximum percentage of
broken grains is 2 %
grain impurities is 1.75 %. Impurities means shriveled grains, grains of other cereals, grains damaged by pests and grains overheated during drying.
sprouted grains is 1 %
miscellaneous impurities is 0.5 %. Miscellaneous impurities consist of extraneous seeds, damaged grains, extraneous matter, husks, ergot, dead insects and fragments of insects.
Specific weight of rye is 71 kg/hl.
The standard quality for barley means barley of a sound and fair marketable quality, free from abnormal smell and live pests, of a color proper to this cereal (article 3). Maximal moisture content is 16 %. The total percentage of matter other than basic cereals of unimpaired quality is maximum 6 %, of which the maximum percentage of
broken grains is 2 %
grain impurities is 2 %, where impurity means shriveled grains, grains of other cereals, grains damaged by pests and grains overheated during drying.
sprouted grains is 1 %
miscellaneous impurities is 1 %. The group of miscellaneous impurities consists of
extraneous seeds, damaged grains, extraneous matter, husks, dead insects and fragments of insects.
Standard specific weight for barley is 67 kg/hl.
The standard quality for which the target price, the intervention price and the threshold price for maize are fixed is defined as maize of a sound and fair marketable quality, free from abnormal smell and live pests (article 4). The allowed maximum moisture content is 15.5 %.
The total percentage of matter other than basic cereals of unimpaired quality is maximum 8
%, of which the maximum percentage of
broken grains is 2 %, where broken grains mean pieces of grain or grains which pass through a sieve with a circular mesh 4.5 mm in diameter.
grain impurities is 4 %. This means grains of other cereals, grains damaged by pests and grains heated by drying.
sprouted grains is 1 %
miscellaneous impurities is 1 %. This group consists of extraneous seeds, damaged grains, extraneous matter, cob fragments, dead insects and fragments of insects.
The standard physical quality criteria for durum wheat is defined as durum wheat of a sound, genuine and fair merchantable quality, free from abnormal smell and live pests, amber yellow to brown in color, with a vitreous section of translucent, horny appearance (article 5).
Maximal moisture content is 13 %. Total percentage of matter other than durum wheat grains of unimpaired quality is maximum 25 %, of which the maximum percentage of
durum wheat grains which have wholly or partly lost their vitreous aspect is 20 %
broken grains is 2 %
grain impurities is 2 %. Shriveled grains, grains of other cereals, grains damaged by pests, grains showing discoloration of the germ, mottled grains, grains affected with fusariosis and grains overheated during drying are selected.
sprouted grains is 0.5 %
miscellaneous impurities is 0.5 %, where it means extraneous seeds, damaged grains, extraneous matter, husks, ergot, decayed grains, dead insects and fragments of insects.
Specific weight for durum wheat is 80 kg/hl. Technology quality criteria:
protein content (5.7 x N) is not less than 12.5 % of dry matter
gluten content is not less than 8.75 % of dry matter
Hagberg falling number is not less than 250, including 60 s preparation (agitation) time According to the regulation of European Community
all grains of which endosperm is partially uncovered shall be considered as broken grains.
Grains damaged by threshing and grains from which the germ has been removed also belong to this group. This definition does not apply to maize.
grains which, after elimination of all other matter, pass through sieves with apertures of 2 mm for wheat, 1.8 mm for rye, 1.9 mm for durum wheat or 2.2 mm for barley shall be considered as shriveled grains. In addition, grains damaged by frost and unripe (green) grains belong to this group.
other cereals in grain impurities means all grains which do not belong to the species of grain sampled.
extraneous seeds are seeds of plants, whether or not cultivated, other than cereals. They include seeds not worth recovering, seeds which can be used for livestock and noxious seeds. Noxious seeds means seeds which are toxic to humans and animals, seeds hampering or complicating the cleaning and milling of cereals and seeds affecting the quality of products processed from cereals.
grains overheated during drying are grains which show external signs of scorching but which are not damaged.
grains damaged by pests are those which have been nibbled or insect−bored.
grains showing discoloration of the germ are those of which the tegument is colored brown to brownish black and of which the germ is normal and not sprouting. For common wheat, grains showing discoloration of the germ are disregarded up to 8 %. For durum wheat, mottled grains are grains which show brown to brownish black discoloration on parts other than the germ and grains affected with fusariosis are grains whose pericarp is contaminated
with Fusarium mycelium. Fusarium attacked grains look slightly shriveled, wrinkled and have pink or white diffuse patches with an ill−defined outline.
sprouted grains are those in which the radicle or plumule is clearly visible to the naked eye. However, account must be taken of the general appearance of the sample when its content, of sprouted grains is assessed. In some kinds of cereals the germ is protuberant (e.g. durum wheat) and its tegument splits when the batch of cereals is shaken. These grains resemble sprouted grains but must not be included in that group. Sprouted grains are only those where the germ has undergone clearly visible changes which make it easy to distinguish the sprouted grain from the normal.
damaged grains are those rendered unfit for human consumption and, as regards feed grain, for consumption by cattle, owing to putrefaction, mildew, bacterial or other causes.
Grains which have deteriorated through spontaneous generation of heat or by too extreme drying also belong to this group. These are fully grown grains in which the tegument is colored grayish brown to black, while the cross−section of the kernel is colored yellowish gray to brownish black. Grains attacked by wheat−midge shall be considered as damaged grains only when more than half the surface of the grain is colored gray to black as a result of secondary cryptogamic attack. Where discoloration covers less than half of the surface of grain, the latter must be classed with grains damaged by pests.
mitadiné grains of durum wheat are grains whose kernel cannot be regarded as entirely vitreous.
All matter in a sample of cereals retained a sieve with apertures of 3.5 mm (with the exception of grains of other cereals and particularly large grains of the basic cereal) and that passing through a sieve with apertures of 1 mm shall be considered as extraneous matter. Stones, sand, fragments of straw and other impurities in the sample which pass through a sieve with apertures of 3.5 mm and are retained by a sieve with apertures of 1 mm are also included in this group. This definition does not apply to maize. For that cereal, all matter in a sample which passes through a sieve with apertures of 1 mm must be considered as extraneous matter.
2.2. Digital imaging
2.2.1. Illumination
Computer vision is not limited to visible radiation. As soon as imaging detector systems became available, other types of radiation were used to probe scenes and objects of interest.
Recent developments in imaging sensors cover almost the whole electromagnetic spectrum from x−rays to radiowaves. In standard applications, illumination is frequently taken as given and optimized to illuminate objects evenly with high contrast. Such setups are appropriate for object identification and geometric measurements. Monochromatic illumination consists of a certain frequency. The distribution of radiation over the range of possible wavelengths is called the spectrum or spectral distribution. Only a very narrow band of electromagnetic radiation between 380 nm and 780 nm is visible to the human eye. Light is received by stimulating the retina after passing the preretinal optics of eye. The retina consists of two different type of sensors: rods and cones. At high levels of irradiance the cones are used to detect light and to produce the sensation of colors (this is called photopic vision). Rods are used mainly for night vision at low illumination levels (this is called scotopic vision). The peak of the relative spectral luminous efficiency for scotopic vision can be found at 507 nm compared to the peak at 555 nm for photopic vision. As the response of the human eye to radiation depends on a variety of physiological parameters, differing for individual human observers, the spectral luminous efficiency can correspond only to an average normalized observer. At intermediate illumination levels both photopic and scotopic vision are involved.
This range is called mesopic vision. (B. Jähne, H. Haußecker and P. Geißler, 1999, vol.1) The most important properties of illumination sources are: spectral characteristics, intensity distribution, radiant efficiency, luminous efficacy, electrical properties, temporal characteristics and package dimensions. In many cases, features of interest can be made visible by a certain geometrical arrangement or spectral characteristics of the illumination rather than by trying to use expensive computer vision algorithms to solve the same task.
Good image quality increases the performance and reliability of any processing algorithm.
Single illumination sources are not the only way to illuminate the scene. For outdoor scenes, natural sources, such as solar irradiance and diffuse sky irradiance, play an important role. In some applications, they might be the only illumination sources available. In other cases, they are unwanted sources of errors and they have to be eliminated. In order to acquire images of good quality, artificial illumination sources are used:
incandescent lamps are among the most popular all−purpose illumination sources. The most prominent examples are standard light bulbs with carbon or tungsten (more modern version) filament.
discharge lamps operate on the physical principle of gas discharge. Spectral lamps are plain gas discharge lamps, without additional coatings, filled with xenon (Xe), mercury (Hg) or their mixtures. Fluorescent lamps are discharge lamps (usually filled with Hg) that are additionally coated with special fluorescent materials. These layers absorb ultraviolet radiation and convert it into longer wavelength radiation in the visible region, which is finally emitted.
arc lamps have anodes and cathodes made of tungsten and sealed in clear quartz glass (filled with deuterium, Hg or Xe−Hg mixture).
infrared emitters are emitters of thermal radiation from quartz tungsten halogen lamps to lamps with high ohmic resistance.
Light−emitting diodes (LEDs) are small and powerful light sources. Their most important advantages are: high luminous efficacy, small dimensions, suitability for integration into large arrays of any arbitrar shape, low power consumption, and fast response time.
lasers are the most powerful monochromatic light source available. Lasers usually have low radiant efficiency and high luminous efficacy. Lasers are available for a large variety of spectral ranges, from x−rays into the microwave region.
According to the position of artificial light sources, the following setups are distinguished:
directional illumination or specular illumination denotes a setup in which parallel light or light from a point light source is used to illuminate the object. This is the most simple type of illumination, consisting of single light sources at a certain distance from the surface of object.
diffuse illumination consists of an extended source, which emits light in all directions.
Examples are extended diffusing plates, rings, and fiber optical illumination.
rear illumination is used if the geometrical outline of a flat object is of interest.
bright field illumination, where a direct path exists from the light source to the camera. As long as no object present, the image appears bright.
telecentric illumination is used to convert the spatial radiance distribution of a light source into bundles of parallel rays that reflect the radiance (and spectral distribution) of a single point of the light source.
pulsed illumination can be used to increase the performance of the illumination system, reduce blurring effects, measure time constants and distances, and allow fast image processing.
2.2.2. Color measurement
Commission Internationale de l’Éclairage (CIE) is the international organization that undertook the task of developing specifications for colorimetry. The CIE standard colorimetry is based on a trichromatic system of red, green, and blue color components (with peaks at 700 nm, 546.1 nm, and 435.8 nm respectively). A color matching function is used to compute color from R,G,B signals:
C λ =R⋅ R AG⋅G AB⋅B (Eq.1)
this C(λ) represents only the color information. Luminance of a color matched by the amounts R red units, G green units and B blue units will be (Schanda, 2000):
L=1.0000⋅RA4.5907⋅GA0.601⋅B (Eq.2) If R, G and B values are computed from radiometric quantities, L will be the corresponding photometric quantity. There are negative values in the original colour space of RGB signals that may lead to computation errors. For this reason this space is transformed into the X,Y,Z colour space. The basis vector transformation was done in such a form that
1. the tristimulus values of the colour stimulus of the equi−energetic spectrum should again be equal;
2. all the photometric information (luminance, if the stimulus is measured in radiance units) should be presented in a single parameter;
3. the tristimulus values of all real colours should be positive and the volume of the tetrahedron should be as small as possible (i.e. the borders of the colour cone should touch the tetrahedron at as many as possible places).
Color matching functions can be built in this system, as well (Fig.1.). Using these functions, the X, Y, Z tristimulus values of a colour stimulus (S(λ)) can be calculated. The colour stimulus distributions are presented in Fig.2. Color matching and stimulus functions are presented on the basis of data tables published in CIE 1931 Standard Colorimetric Observer.
Fig.1: X,Y,Z color matching functions Fig.2: Color stimulus functions
Unfortunately the X, Y, Z tristimulus values are not very easy to interpret and it is not very easy to "see" the color they specify. As the luminance measure has been condensed into the Y tristimulus value, it seemed to be reasonable to transform from the X, Y, Z space into another space where Y is one of the coordinates and the other two are describing chromaticity. To do this the CIE introduced the chromaticity coordinates x, y, z and defined them in the following form:
x= X
XAYAZ ; y= Y
XAYAZ; z= Z
XAYAZ (Eq.3)
As x + y + z = 1, it is enough to use two of the chromaticity coordinates to describe the chromaticity of the stimulus. It is usual to use x and y, and to plot the chromaticities in a chromaticity diagram.
As the reflection properties of average samples might differ considerably from those of an ideal standard, i.e. they are neither totally diffuse (Lambertian) nor are they reflecting only regularly (mirror like), at different locations and with different instruments reproducible measurements can only be achieved if the measuring geometry used is the same. The CIE standardized four measuring geometries: 45°/normal, normal/45°, diffuse/normal and normal/diffuse. Here the first angle description refers to irradiation, the second to observation (Lukács, 1982; Schanda, 2000):
Case a) 45°/normal (symbol: 45/0): The specimen is irradiated by one or more beams whose effective axes are at an angle of 45°±2° from the normal to the specimen surface. The angle between the direction of viewing and the normal to the specimen should not exceed 10°. The angle between the axis and any ray of an irradiating beam should not exceed 8°. The same restriction should be observed in the viewing beam.
Case b) normal/45°(symbol: 0/45): The specimen is irradiated by a beam whose effective axis is at an angle not exceeding 10° from the normal to the specimen surface. The specimen is viewed at an angle of 45°±2° from the normal to the specimen surface. The angle between the axis and any ray of the irradiating beam should not exceed 8°. The same restriction should be observed in the viewing beam.
Case c) diffuse/normal (symbol d/n): The specimen is irradiated diffusely by an integrating sphere. The angle between the normal to the specimen surface and the axis of the viewing beam should not exceed 10°. The integrating sphere may be of any diameter provided the total area of the ports does not exceed 10 percent of the internal reflecting sphere area. The angle between the axis and any ray of the viewing beam should not exceed 5°.
Case d) normal/diffuse (symbol: 0/d): The specimen is irradiated by a beam whose axis is at an angle not exceeding 10° from the normal to the specimen surface. The reflected flux is collected by means of an integrating sphere. The angle between the axis and any ray of the irradiating beam should not exceed 5°. The integrating sphere may be of any diameter provided the total area of the ports does not exceed 10 percent of the internal reflecting sphere area.
300 400 500 600 700 800
0,00 0,50 1,00 1,50
2,00 X
Y Z
wavelength, nm
power
300 400 500 600 700 800 900 -25
0 25 50 75 100 125
150 S0
S1 S2
wavelength, nm
relative power
For the conditions ’diffuse/normal’ and ’normal/diffuse’ the regularly reflected component of specimens with mixed reflection may be excluded by the use of a gloss trap. If a gloss trap is used, details of its size, shape and position should be given.
In the ’normal/diffuse’ condition the sample should not be measured with a strictly normal axis of irradiation if it is required to include the regular component of reflection. Similarly, in the ’diffuse/normal’ condition the sample should not be measured with a strictly normal axis of view if it is required to include the regular component of reflection.
Case a), b) and c) give values of reflectance factor, R(l). For directional viewing with a sufficiently small angular spread, these reflectance factors become identical to radiance factors. For case d), viewing with an integrating sphere, in ideal case the reflectance is measured.
Fig.3: Computer generated color spectra
Computers represent color with the mixture of red, green and blue color components. Intensity values are scaled from 0 to 255 (limits of one byte). Each point of the picture (called pixel) has its own R, G and B values in the case of 24 bit/pixel color depth.
Figure 3 presents available colors for computers.
Besides color information, coefficients contain intensity of pixels, as well. In order to compute independent color information, normalization can be used. Simple (case a) and quadratic (case b) normalization are introduced in Eq.4. After this step all color vectors have the same length and are comparable with less dependence on illumination.
a.) r= R
RAGAB b.) r= R2
R2AG2AB2 (Eq.4.) Red, green and blue intensity values are usually
transformed into the hue−saturation−intensity (HSI) system (or HSV, where V = value). This is called the Munsell color system. The transformation between HSI and RGB color spaces is presented in Eq.5 (Majumdar, Jayas, 2000). Value represents the brightness or total intensity, degree of saturation (or chroma) means how muted or vivid the color is, and correspondence to the dominant wavelength is called hue (Fig.4). The chief advantage of such systems is that color is split into conceptually distinct parts This distinction cannot be made within the RGB system (Ewing, Horton, 1999).
Fig.4: HSI color system (MathWorks) I=RAGAB
3 S=1Bmin R, G, B I
H=cosB1
1
2 RBG A RBB RBG 2A RBB GBB 1⁄2
where if B I >G
I then H=360o−H
(Eq.5)
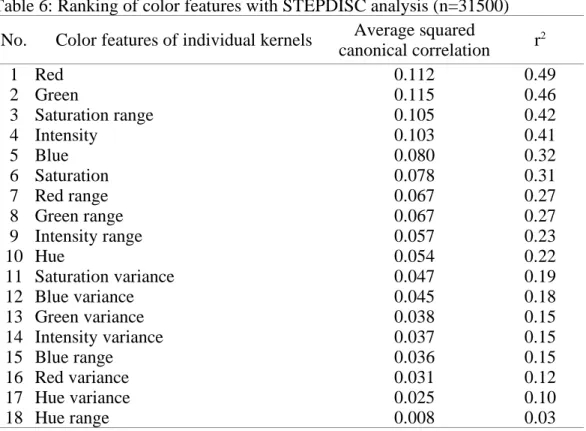
Majumdar and Jayas (2000) used red, green, blue, hue, saturation and intensity parameters with their average value, range and variance. Ranking of color features of individual kernels (independently) is presented in Table 6. Red, green and blue average values are at the top of the table. Intensity, saturation and hue reached lower positions.
Table 6: Ranking of color features with STEPDISC analysis (n=31500) No. Color features of individual kernels Average squared
canonical correlation r2
1 Red 0.112 0.49
2 Green 0.115 0.46
3 Saturation range 0.105 0.42
4 Intensity 0.103 0.41
5 Blue 0.080 0.32
6 Saturation 0.078 0.31
7 Red range 0.067 0.27
8 Green range 0.067 0.27
9 Intensity range 0.057 0.23
10 Hue 0.054 0.22
11 Saturation variance 0.047 0.19
12 Blue variance 0.045 0.18
13 Green variance 0.038 0.15
14 Intensity variance 0.037 0.15
15 Blue range 0.036 0.15
16 Red variance 0.031 0.12
17 Hue variance 0.025 0.10
18 Hue range 0.008 0.03
The red−, white− and amber−colored wheat classes were well separated in Canada, according to their mean RGB reflectance properties (Neuman et.al., 1989, I−II.). Discrimination of red spring classes was relatively high (above 90%), but classification of varieties within these groups was not successful.
According to the current trends in digital image analysis, average RGB values are usually augmented with surface color distribution parameters. J. Meuleman and C. van Kaam used unsupervised neural networks in 1997, in order to improve segmentation of leaves, flowers, stamen, stems and background. Eighteen parameters were used to feed the neural network:
red, green and blue intensities of the selected pixel, normalized RGB values of the same pixel, and normalized RGB values of four additional pixels in the 5x5 environment of the central point. Three layers partitioned input data set into two subsets recursively.
Classification was evaluated in each step on the basis of deviation of new classes compared to the original set. The partitioning process was stopped if the following ratio became too low:
∑
n1⋅X1,i2 An2⋅X2,i2
∑ ∑
x1,i,jBX1,i
2A
∑ ∑
x2,i,jBX2,i
2 (Eq.6)
where n1and n2 mean the number of pixels, x the intensity parameters, X the average values.
This clustering approach on a 450−pattern data set made only one mistake: one pixel of stamen was recognized as leaf.
2.2.3 Shape estimation
Digital images are data matrices, where each element of the matrix contains color information about the represented area of the real scene. Comparison of these values allows computers to distinguish between foreground and background parts of the picture and to select objects. The shape of the selected area may be estimated several ways according to the purpose of analysis. These methods are based on the coordinates of the pixels belonging to the object of interest.
In the work of Marshall, Ellison and Mares (1984; 1986) simple geometric models of wheat grains were analyzed to determine the effects of changes in shape and size on volume per unit surface area and hence potential milling yield. The shape and size of kernels of Australian cultivars were measured and found to be significantly different from the optimum required to maximize volume per unit surface area (spherical shape). For kernels of a given mean volume, the questions of concern to the plant breeder interested in improving milling yield by altering kernel shape and size are:
What are the optimum dimensions of a kernel (length, width and height) so that grain volume per unit surface area and milling yield are maximized?
Is the potential increase in milling yield that can be achieved by altering kernel dimensions large enough to justify selection for optimum grain shape in breeding programs?
Is there sufficient variability in wheat germplasm to develop varieties with optimum grain shape?
Similarly, for kernels of a given shape and dimensions the critical questions are:
What is the relationship between volume per unit surface area and grain volume?
How large an increase in kernel volume would be required to significantly improve milling yield in wheat?
Is there sufficient genetic variability among bread wheat and their near relatives to achieve such an increase in kernel volume?
To answer the first question, five geometric models were examined: cylinder, rectangular prism, triangular prism, double cone and prolate spheroid. These unrealistic models were used to factor out the best way of improvement of milling yield (Fig.5).
Fig.5: Five geometric models used by Marshall, Ellison and Mares in 1984
Increases in seed weight and volume are usually due more to increases in seed length than in seed width or height. For this reason, as grain volume is increased, there will be a correlated change in grain shape away from the optimum required to maximize volume per unit surface area of the seed.
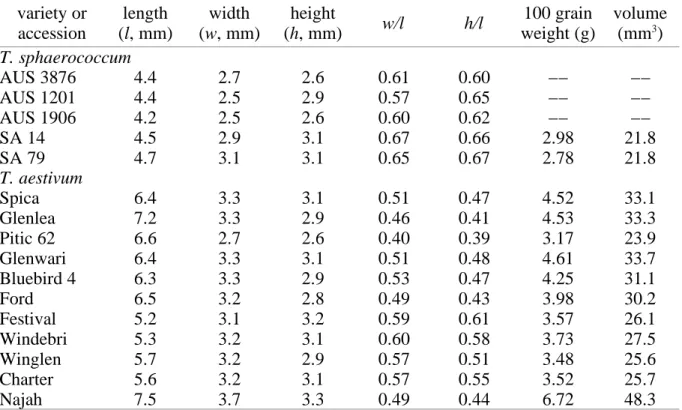
Table 7: Parameters of some cultivated wheat varieties in Australia variety or
accession
length (l, mm)
width (w, mm)
height
(h, mm) w/l h/l 100 grain
weight (g)
volume (mm3) T. sphaerococcum
AUS 3876 4.4 2.7 2.6 0.61 0.60 −− −−
AUS 1201 4.4 2.5 2.9 0.57 0.65 −− −−
AUS 1906 4.2 2.5 2.6 0.60 0.62 −− −−
SA 14 4.5 2.9 3.1 0.67 0.66 2.98 21.8
SA 79 4.7 3.1 3.1 0.65 0.67 2.78 21.8
T. aestivum
Spica 6.4 3.3 3.1 0.51 0.47 4.52 33.1
Glenlea 7.2 3.3 2.9 0.46 0.41 4.53 33.3
Pitic 62 6.6 2.7 2.6 0.40 0.39 3.17 23.9
Glenwari 6.4 3.3 3.1 0.51 0.48 4.61 33.7
Bluebird 4 6.3 3.3 2.9 0.53 0.47 4.25 31.1
Ford 6.5 3.2 2.8 0.49 0.43 3.98 30.2
Festival 5.2 3.1 3.2 0.59 0.61 3.57 26.1
Windebri 5.3 3.2 3.1 0.60 0.58 3.73 27.5
Winglen 5.7 3.2 2.9 0.57 0.51 3.48 25.6
Charter 5.6 3.2 3.1 0.57 0.55 3.52 25.7
Najah 7.5 3.7 3.3 0.49 0.44 6.72 48.3
Zayas, Pomeranz and Lai in 1989 used more sophisticated morphological parameters. They selected basic parameters (area, perimeter, length, width, Feret’s diameters at 0°, 45°, 90° and 135°) and derivative parameters to create wheat pattern prototypes.
Table 8: Derived shape factors (Zayas, Pomeranz, Lai 1989)
Parameter minimum maximum
Area (pixels) 1000 21000
Radiusarea/radiusperimeter 0.6 0.9
Perimeter/convex perimeter 1 1.3
Convex perimeter/length 2 2.5
Feret 0°/Feret 45° 0.4 0.7
Feret 90°/Feret 135° 1.1 1.4
The first parameter differentiates in size, the second one in concavity. The rest of parameters differentiate among objects with different degrees of symmetry. Table 9 shows the identity and number of wheat and non−wheat objects identified by multivariate discriminant analysis.
Table 9: Classification result (Zayas, Pomeranz, Lai 1989)
Object No. Wheat Non−wheat
Without stones (test data)
Wheat 34 33 1
Non−wheat 99 12 87
With stones (test data)
Wheat 34 33 1
Non−wheat 158 23 135
Morphological and crush−force parameters were combined to identify six classes and seventeen varieties of wheat kernels by Zayas, Martin, Steele and Katsevich (1996). Although shape was measured from down and profile views with 26 attributes, only hard and soft wheat classes were discriminated.
Shatadal, Jayas, Hehn and Bulley in 1995 classified various seed types into primary grain, small seed and large seed categories. The seed types used in each category were: hard red spring wheat (HRS) and barley as primary grains; canola, brown mustard, yellow mustard, oriental mustard and flaxseed as small seeds; Laird lentils, Eston lentils, pea beans, green peas, black beans and buckwheat as large seeds. The objective of their study was to assess the classification success in identifying HRS wheat and barley from other small and large seeds using morphological features. Orientation of the kernels for camera viewing was random. The following parameters were measured: perimeter, area, width, maximum and minimum radii.
The calculated parameters were: rectangular aspect ratio (ratio of length to width), thinness ratio (ratio of square of perimeter to area), radius ratio (ratio of maximum to minimum radii), area ratio (ratio of area to product of length and width) and H−ratio (ratio of mean to standard deviation of all radii). The result of classification is presented in Table 10.
Table 10: Correct recognition of seed categories (Shatadal et al., 1995)
Categories HRS wheat Barley Small seeds Large seeds N
HRS wheat 995 1 2 2 1001
Barley 4 995 0 0 999
Small seeds 0 0 4987 0 4987
Large seeds 28 3 0 5969 6000
Morimoto, Takeuchi, Miyata and Hashimoto (1998) measured the randomness of perimeter.
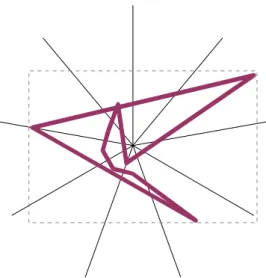
They used chaotic parameters to detect irregular shapes. Attractors (Singh, Maru and Moharir, 1998; Bünner et.al., 2000; Gleick, 2000) were drawn to show complexity of radial distances (radii) along the outline of objects. Let R(i) be the radius of one point, where i = 1 .. N and N is the length of perimeter. An attractor is drawn onto the plane with X = R(i) and Y
= R(i+s) coordinates. The plane of R(i) and R(i+s) is called phase space. In case of a spherical shape, all radii are equal (R(i)=R(j); i,j=1..N), and its attractor is one single point.
The more the shape differs from a sphere, the more complex its attractor will be. The complexity of the attractor depends on the value of shifts as well. If the shift is set to zero, all attractors are plotted on a line that starts at the origin and has a 45° slope. Morimoto et al.
used variable shift and computed fractal dimensions (Eq.7). In Morimoto’s work, attractors assumed the shape of ellipses and the ratio of widths of the smallest (W2) and the largest (W1) was calculated.
D=Blog L τ
logτ (Eq.7)
where D means fractal dimension, L(τ) length of the total perimeter measured in τ(the length of basic step). Threshold values, in order to distinguish between good and badly shaped tomatoes, were from 0.375 to 0.531 for W2/W1 and from 1.464 to 1.514 for D.
Besides the measurement of chaotic properties, shapes can be compared to a template, an ideal shape profile (Liao et.al., 1993; Firtha, 1998). A corn kernel profile was built by Liao et.al. in 1993 to identify broken kernels (Fig.6). Kernels were divided into three regions: crown, body and tip cap.
Eight morphological features were extracted and analyzed with a neural network. This method reached 93.25%
accuracy with round kernels and 97.5% with flat kernels, compared to human inspector classification. Firtha (1998) divided the outlines of onions into six regions and estimated them with mathematical functions (constant, exponential and cosine). The coefficients contain all information required to reconstruct shape, to compare the shapes of different varieties or to build the three−dimensional model of this vegetable. Martinovich and Felföldi (1996) used Fast Fourier
Fig.6: Corn shape model (Liao et.al. 1993)
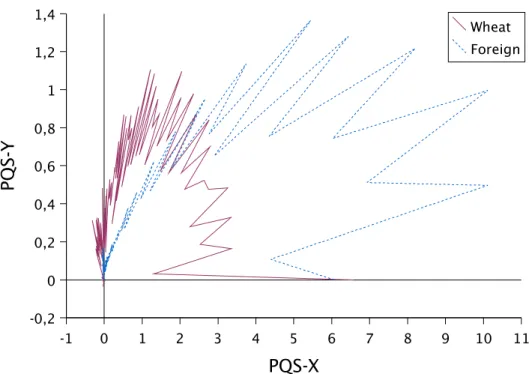
Transform (FFT), the direct comparison of outlines and the Polar Qualification System (PQS) to evaluate shapes of onion varieties. The Polar Qualification System is a general and powerful data reduction method rooted in the evaluation of near infrared spectra. The quality point of spectra, or any spectra like data set, is defined as the center of its polar spectrum (polar coordinate system, where radius is the function of spectral value and angle is a function of wavelength). Three approaches exist to compute coordinates of the quality point (Kaffka, Gyarmati, 1998). The Point method is introduced in Eq.8:
x=1 k
∑
i=0 kB1
Vλ⋅icos iα y=1 k
∑
i=0 kB1
Vλi⋅sin iα (Eq.8) The Line method is introduced in Eq.9:
x=1 L
∑
i=0 kB1
∆Li⋅wi y=1 L
∑
i=0 kB1
∆L⋅vi i , where
∆Li= Vλ iA1 cos iA1 αBVλicos iα 2A VλiA1 sin iA1 αBVλisin iα 2 wi=Vλicos iαAVλ iA1 cos iA1 α
2 vi=Vλisin iαAVλ iA1 sin iA1 α 2
and L is the total length of the curve.
(Eq.9)
The Surface method is introduced in Eq.10:
x= 1 6T
∑
i=0 kB1
vλicos iαAVλiA1 cos iA1 α⋅VλiVλiA1 sinα y= 1
6T
∑
i=0 kB1
vλisin iαAVλ iA1 sin iA1 α⋅VλiVλiA1 sinα and T=1
2
∑
i=0 kB1
VλiVλ iA1 sinα , the area of the included surface.
(Eq.10)
These formulas calculate coordinates of quality points, where Vli is the spectral value, a = 360/k and k is the number of data points in the set (in our case it will be the length of perimeter in pixels).
Han, Feng and Weller in 1996 used two−dimensional Fourier transforms on enhanced images of corn kernels. Contrast was amplified and Roberts filter was used to enhance edges. Sixteen ring signatures, 16 wedge signatures and a DC value were used to describe each kernel. Two cultivars were tested and discriminant analysis was able to detect stress cracks with an average success ratio of 96.4% for Pioneer 3165 and 96.3% for Pioneer 3147.
2.2.4. Texture analysis
Texture is an important characteristic for the analysis of many types of images, from multispectral scanner images obtained from aircraft or satellite platforms to microscopic images of cell cultures or tissue samples. Despite its importance and ubiquity in image data, neither a formal approach nor a precise definition of texture exists. Texture discrimination techniques are for the most part ad hoc (Haralick, Shapiro 1992).
Statistical approaches use the autocorrelation function, the spectral power density function, frequency of edges per unit area, spatial gray level co−occurrence probabilities, gray level run−length distributions, relative extrema distributions, and mathematical morphology. An image texture is described by the number and types of its primitives and their spatial organization or layout. Gray level primitives are regions with gray level properties (average, minimum, maximum levels). A region is a maximally connected set of pixels having a certain gray level property. The spatial organization may be random, may have a pairwise dependence of one primitive on a neighboring primitive, or may have a dependence of n primitives at a time. This dependence may be structural, probabilistic, of functional (like a linear dependence).
The gray level spatial dependence approach characterizes texture by the co−occurrence of its gray levels. The gray level co−occurrence can be specified in a matrix of relative frequencies Pij. Eight of the common features computed from this matrix are presented in Table 11, where i and j index variables mean the gray level (intensity of point in the gray−scaled image).
Table 11: Texture parameters (Haralick, Shapiro 1992)
Feature Computation
Uniformity of energy
∑
Pi,j 2Entropy B
∑
Pi,j⋅log Pi,j
Maximum probability max( Pi,j )
Contrast
∑
iBj k Pi,j lInverse difference moment
∑
Pi,jl
iBjk; i≠j
Correlation
∑
iBµ jBµ Pi,jσ2 where µ=
∑
i⋅Pi,jProbability of a run length n
for gray level i
∑
PiBPi,j2 Pi,j nB1 Pin
Homogeneity
∑
1APii,jBjCluster tendency
∑
iAjB2µ kPi,jThe co−occurrence matrix is easy to understand and to compute quickly. If a vector is used instead of the co−occurrence matrix, the gray level difference spectrum is produced.
Direction has significance because of the increased probability of dependence on texture position (rotation). Scanning direction and distance of compared pixels are defined by the displacement vector(s). In order to minimize dependence on the rotation of object, four directions are suggested: 0°, 45°, 90° and 135° (Jähne, Haußecker, Geißler, 1999, vol.2). As a result, the number of parameters is also increased.
Majumdar and Jayas (2000) tested the gray level co−occurrence matrix (GLCM) and gray level run length matrix (GLRM) based approaches. They concluded that the maximum number of gray levels in an image should be reduced from 256 to 8 to reduce computational time and increase accuracy. Fifteen parameters were used: 8 GLRM attributes, 4 GLCM attributes and 3 other (mean value, variance, range). These parameters were measured on individual color signals, gray level, and three color band combinations: G1=(3R+2G+B)/6, G2=(2R+G+3B)/6 and G3=(R+3G+2B)/6. Classification accuracies were 92.0% (independent data sets) and 92.9% (test data sets).
Texture analysis techniques are very popular in remote sensing. The ages of tropical forest areas were estimated with fuzzy and texture−based processing and classification of Landsat images (Palubinskas et.al., 1995). Eleven classes of regenerating forest were used to compare methods. Texture−based classifiers (based on a Markov random field model) consistently provided higher classification accuracy. Post−classification of fuzzy output was generally less accurate. The combination of Markov random field and neural networks was able to increase the effectiveness of segmentation or classification. Szirányi and Zerubia in 1997 used noisy artificial images (Fig.7) to measure the power of this combined method. The classification errors were 1.3% and 1.0% with the Modified Metropolis Dynamics and the Metropolis algorithm, respectively.
a.) b.)
Fig.7: Noisy image (a) and after segmentation (b) (Szirányi, Zerubia, 1997)
2.3 Summary of literature
Current standards in Hungary, in the European Community and in the United States insist on measuring width and height of kernels to analyze shape, and human inspectors use handpicking in evaluation of the quality of grain samples. There are numerous applications for that purpose presented in the literature, but digital image processing offers more detailed analysis. Computer programs are able to acquire images of cereals (or fruits and vegetables) rapidly, and to calculate and evaluate parameters online.
Color can distinguish some types of seeds (wheat − brownish, corn − yellow or red, weed seeds and stones − gray) according to the intensity of red, green and blue color components.
Because color is not enough to separate varieties within these classes, it is usually augmented with other visual attributes.
There are several approaches to model shapes of seed grains or fruits. Traditional parameters are width, height, and their ratio; average radius; area; and perimeter. There are ideal (expected) shapes, and they can be used as templates to fit to the objects. In this case, coefficients of template functions or shape factors are computed. In addition, chaotic properties are general factors to measure irregularity of shapes. If shapes are plotted into the phase space, their trajectories (attractors) will visualize chaos or irregularity as well.
Analysis of surface texture is hardly used in agriculture. A lot of methods were developed to process gray−scaled satellite images. They are very sophisticated and use the latest results of mathematical science. These techniques are able to segment areas of different surface structures, according to the periodic changes of shades and light parts. If these methods are extended to the color signals, color distributions or color patterns will be measured.
Accurate and objective measurement of visual parameters is able to complement other experiments (plant development, invention, optimization, etc.) with useful information.
3. Objectives
The objective of this work was to find visual quality parameters to measure shape, color and surface texture parameters of grains. The main goal was to combine these attributes so that computer programs would be able to distinguish different types of objects: wheat, string−pea, corn, barley, weed seeds, fragments of plants and fragments of insects.
In order to fulfill the objectives and understand the visual properties of objects, the following tasks were planned:
segment the object and background parts of images with high accuracy, even if their intensities are close and they differ only in color (black background and dark brown weed seeds)
model the shape of objects
− with common mathematical functions (sine)
− with polynomial functions
− on the basis of regularity and self−similarity
measure the average color of the surface with less dependence on illumination
determine color distribution and texture of surface
4. Methods and materials
4.1. Vision system
The image acquisition system of the Department of Physics & Control at SzIE University was used. This setup is consisting of a Hitachi HV−C20 CCD camera, Canon zoom lenses, bulbs, grabber board (VIGA Window, AVER PCImager, Studio PCTV Pro) and a personal computer (Intel Celeron processor, 64 MB RAM). Three types of grabber boards were used, because of the hardware development of the system. A black tray was placed in front of the objective lens, approximately 4cm far away. On the basis of the CCD sensing area (7.95x6.45 mm), and the optical parameters of the lens system (focal length, distance of principal planes), dimensions of one pixel were approximately 0.055mm (width) and 0.055mm (height).
Only one object was placed on the tray at a time to capture as many details as possible.
Images were stored in bitmap files with truecolor data format (24 bit/pixel). Depending on the grabber boards, 320x200 or 384x284 picture sizes were used.
4.2. Materials
Samples of wheat grains containing impurities were received from the milling industry, and wheat samples of known varieties were received from the National Institute for Quality Control in Agriculture (OMMI, Budapest). Table 12 presents the composition of the sample of seed grains and other materials. Numbers of grains in these parts represented their real occurrence.
Table 12: Composition of the sample
Name Pieces Percentage
Corn kernels 310 24.58
Barley kernels 209 16.57
Whole wheat grains 201 15.94
Small wheat grains 200 15.86
Broken wheat grains 56 4.44
Foreign materials* 57 4.52
Insect attacked wheat kernels 51 4.04 Mixture for testing, in which 177 14.04
− weed seeds 57 4.52
− fragments of plants 42 3.33
− broken wheat grains 37 2.93
− corn kernels 19 1.51
− string−pea 18 1.43
− stones 4 0.32
Total 1261 100.00%
*Materials passing through the first siever for wheat
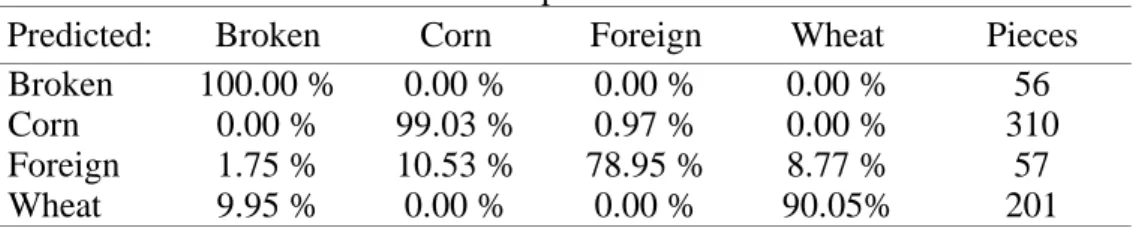
Subgroups of this quantity were selected to teach and test the classification process. A special mixture (n=177, 14.04%) was separated to test the final version of the statistical evaluation and classification algorithm. The sample of whole wheat grains was divided into two groups:
large and small grains. This division was done because whole wheat grains of small size are usually recognized incorrectly.