Molecular imaging by correlative confocal and STORM super-resolution microscopy
Ph.D. thesis
László Barna Semmelweis University
János Szentágothai Doctoral School of Neurosciences
Consultant: Dr. István, Katona, DSc.
Official Reviewers: Dr. István Ábrahám, DSc.
Dr. Gusztáv Schay, PhD.
Head of the Final Examination
Committee: Dr. Miklós Réthelyi, DSc.
Members of Final Examination
Committee: Dr. Ágnes Kittel, DSc.
Dr. Szabolcs Osváth, PhD.
Budapest 2017
2
1. Introduction
The functioning of the nervous system is based on spatio-temporally orchestrated synaptic and non-synaptic signal transmission processes of nerve cells and glia cells. One of the hottest topics in contemporary neuroscience research is connectomics, which aims at producing a wiring map of individual neural networks by focusing on the spacial identification of inter-neural chemical synapses as one of the numerous signal transmission connections. The human brain has about 86 billion neurons, which can be grouped into hundreds or even more than a thousand different types. These neurons form about 1.5 * 1014 synapses with one another. However, in order to understand the functioning of the nervous system, it is not enough to map out the network of connections, because the efficiency of synapses is not constant in time and space. The constant change, controlled in an activity-dependent manner, of the efficiency of synaptic signal transmission processes is crucial inter alia for complex cognitive processes to take place.
Therefore, the explanation of more complex neural phenomena requires an understanding of molecular-level processes in synapses. These processes are difficult to examine due to the large number and small physical scale of synapses. The synaptic cleft, i.e. the distance between cell membranes of two nerve cells, is merely 20 ± 2.8 nm, the diameter of synaptic boutons containing classic amino-acid transmitters is just 35 ± 0.3 nm and the length of the pre-synaptic active zone is as small as 300 ± 150 nm.
Therefore, the examination of the physiological and patho-physiological functioning of chemical synapses requires methods that allow the nanoscale measuring of the spatial distribution and quantity of key molecular players in a particular signalling pathway in identified synapses in brain tissue.
Thus, in my thesis, in collaboration with my colleagues I developed a method which allows for combining neuro-physiological measurements and selective labelling of single neurons for anatomical experiments with a new super-resolution light microscopy, whose molecular localisation accuracy is around 20 nm, enabling the achievement of the above objectives.
3
1.1. Diffraction-limited resolution light microscopy
The limitation of the resolution of light microscopy due to diffraction was fully described mathematically by Ernst Abbe in 1873 as follows:
𝑑𝑥𝑦 = 𝜆
2𝑁𝐴= 𝜆
2𝑛 sin 𝛼 (1)
where (n) is the refractive index, (α) is the focused light cone angle and (NA) is the numerical aperture (NA=n*sin α). Considering, therefore, a typical wavelength (525 nm) and one of the highest numerical aperture oil immersion objectives, light microscopy yields a lateral resolution (on the XY plane) of around 200 nm. This means that it is impossible to distinguish the microscopic image of two point sources if they are closer to each other than 200 nm. PSF (Point Spread Function) is a three-dimension function characterised by a larger axial than lateral dimension, so imaging in this direction has an even lower resolution (~500nm). The formula clearly indicates that in order to increase the resolution, either wavelength must be decreased or numerical aperture increased.
Lowering wavelength poses a particular challenge for the designers of the objective, because transmission of glass in the UV direction dramatically decreases, moreover, biological samples degrade or are destroyed under high-energy radiation. The numerical aperture cannot be increased either for reasons of geometry and the difficulty of producing a medium of high refractive index.
Advances in quantum mechanics offered new possibilities to decrease wavelength with the discovery of the dual (particle/wave) nature of matter. In 1933, Ernst Ruska presented the first functioning electron microscope, which, instead light, forms images with a beam of electrons accelerated to an appropriate energy level. This technology allows for a resolution of around 1nm on biological samples.
However, electron microscopy has a number of drawbacks compared to light microscopy. Samples have to be placed in a vacuum tube, otherwise it is not possible to create a focused electron beam, which is incompatible with live-cell imaging. In transmitted imaging, truly high resolution can only be achieved on ultra-thin samples (30- 150 nm), which makes sample processing and cutting time-consuming and requires high-
4
level professional practice. Multiple labelling of proteins and other biomolecules usually also poses technical difficulties.
Therefore, there has been an increasing need in life-science research to increase resolution while retaining visible or longer-wavelength imaging light.
1.2. Super-resolution Light Microscopy
The 2000's saw the discovery of three completely different light-microscopy solutions whose resolution far exceeds the limitations caused by light diffraction: Stimulated Emission Depletion (STED), Structured Illumination (SIM) and Single Molecule Localisation (SML) microscopy. Stefan Hell and Eric Betzig were awarded the Nobel Prize in Chemistry for STED and PALM (one of the SMLM technic), respectively. STED achieves super-resolution by point spread function (PSF) engineering and varying the intensity of the STED beam, while SIM brings into the observable area frequency regions which are eliminated by the optical transfer function upon imaging.
1.2.1. Single Molecule Localisation Microscopy (PALM and STORM)
Because of the wave nature of light, the microscopic image of a point source shows spread intensity distribution, which also gives the transfer function of the imaging system also known as point spread function (PSF). If we fit a Gaussian function on the 2D image of a point source, its centroid will give the localisation of the source with a much higher accuracy than a diffraction-limited image. With the introduction of digital video microscopy, this method enabled, for instance, the observation of kinesin motor protein movement with an accuracy of some nanometres.
The problem is that sources are so close to each other that two neighbouring PSF's overlap in the image (dense labelling), since in such situations the Gauss fitting cannot be carried out. In 2006, three single molecule localisation methods were introduced at the same time with dense labelling relying on the temporally separated switched-on state of the fluorescent dyes. Two of these methods, namely PALM (Photoactivated Localization Microscopy) and FPALM (Fluorescence Photoactivation Localization Microscopy) used PA-GFP (Photo-Activatable Green Fluorescent Protein), while the third one, STORM
5
(STochastic Optical Reconstruction Microscopy) is based on small molecule fluorescent dye.
Logically, the above methods rely on the basic principle that out of the originally switched-off fluorescent dyes only such an amount is switched on in each imaging cycle that two adjacent PSF's should not overlap. Resolution depends mainly on the number of photons detected during the on state of each fluorophore.
1.3. STORM microscopy in neuro-sciences
Although the bulk of my thesis is taken up by the methodological, visualisation and data analysis developments included in the section Results, the new methods were first applied in order to address molecular neuro-anatomical problems concerning the nanoscale organisation of the synaptic endocannabinoid signalling pathway. Therefore, this system will also be described below.
1.3.1. Retrograde synaptic signalling
Information flow from pre-synaptic to post-synaptic cells is based on the anterograde synaptic transmission of neurotransmitters released from synaptic vesicles.
One of the most common forms of negative feedback in chemical synapses is the retrograde endocannabinoid signalling pathway. Endocannabinoid signalling molecules released from post-synaptic cells are able to decrease pre-synaptic vesicle release in the short or long term through pre-synaptic CB1 cannabinoid receptors, thereby exerting retrograde control of the strength of the synaptic connection. During the last decade, it became clear that the feedback mechanism occurs in most types of synapses in all areas of the nervous system and plays an important role in several physiological and patho- physiological processes, so it is worth gaining a more profound understanding of its basic functioning principles.
1.3.2. Structure of the endocannabinoid system
Type 1 cannabinoid receptor (CB1) is a G-protein coupled trans-membrane protein, where the THC component of cannabis takes effect. The endogen ligands of CB1 receptor are anandamid and 2-AG. In order to understand the complete system, it is worth noting
6
which enzymes synthesise the internal endogen ligands, also known as endocannabinoids and how the degrading process takes place. The internal cannabinoid effect is caused primarily by 2.AG, which is synthesised from phospholipids making up the cell membrane by means of an enzymatic cascade. At the last stage of the process the fatty acid in the sn-1 position of the secondary messenger 1,2-diacilgyicerol (DAG) is split by the sn-1-specific diacylglycerol lipase (DGL) enzyme. 2-AG is degraded by monoacylglycerol lipase (MGL) enzyme. It is still not clear how highly lipophylic endocannabinoids get from the post-synaptic side to the CB1 receptors found on the pre- synaptic side.
Activation of CB1 triggers the Gi/o signalling pathway whose quick effect via βγ subunit is to block voltage-dependent calcium channels, thereby decreasing the probability of vesicle release. On the other, slower Gi/o signalling pathway, the αi subunit blocks adenylate cyclase, which decreases cAMP levels. As a result, positioning of RIM- 1α protein is obstructed through protein kinase A enzyme, permanently blocking vesicular docking.
2. Objectives
I. Optimising STORM microscopic imaging in cell culture and nerve-tissue preparation.
Measuring the resolution of Nikon N-STORM. Investigating quantitative features of STORM microscopy. Exploring resolution of STORM-imaging of CB1 immune staining in nerve tissue.
II. Construction of a correlative confocal and STORM super-resolution microscope, optimisation of image acquisition.
III. Displaying confocal and STORM super-resolution microscope images and nano-scale data-analysis methods in VividSTORM software. Measurement of molecular distances and densities in localisation microscope images. Calculation of shortest distance between two points along the surface of convex hull. Examination of clustering in localisation microscope images. Measurement of receptor internalisation in hippocampal interneuron terminals.
7
3. Methods
3.1. Animals and cell culture
HEK293 cells were maintained in T25 flasks under routine conditions. Before transfection, the cells were split onto poly-D-lysine (20 μg/ml) coated glass-bottom petri dishes. For the transfection we applied N-terminal EGFP tagged CB1 coding cDNA, to which we added 1 μg Lipofectamine 2000 (Invitrogen) per dish as instructed by the manufacturer. The dishes containing the cells were kept at 37 °C-on in the presence of 5% CO2 for 18 hours in order to obtain the appropriate protein expression. After incubation, cells were fixed in 4% PFA for 15 minutes.
Littermate adult (50-60 day) male CB1+/+ and CB1–/– C57BL/6H mice were used for the immune-staining experiments. Before perfusion, the animals were administered an intraperitoneal injection of ketamine–xylazine for deep anaesthesia. The mice were perfused transcardially with physiological saline solution, then perfunded with 0.1 M phosphate-buffer containing 4% paraformaldehyde for 20 minutes to fix the tissues. After perfusion, the brain was removed from the skull and postfixation was carried out in 4%
PFA for 2 hours. 20 μm thick coronal sections were collected from the block, using vibratome, and washed extensively in PB.
3.2. Patch-clamp recording
25-30 day old male C57BL/6H CB1+/+ or CB1–/– C57BL/6H mice were decapitated in deep anaesthesia and the brains were quickly removed and placed in ice-cold artificial cerebrospinal fluid (ACSF). The 300 μm slices were kept in ACSF at 34°C for 1 hour, then placed in the microscope sample chamber continually perfused with a patch-clamp pipette (3–4 MΩ) filled with 0.2% biocytin was used for whole-cell recording. The hippocampal CA1 pyramidal cells and radiatum-layer interneurons were whole-cell patch-clamp recorded. After the measurement the slices were placed in PB containing 4%
PFA for 40 hours at 4°C to fix the tissue for subsequent microscopic examination.
8
3.3. Immunostaining
After fixation, the tissue containing the biocytin-filled cell was washed and treated with Triton X-100 for 30 minutes. Biocytin was developed with AF488-streptavidin, then embedded in Vecatashield containing DAPI.
Amino-reactive Alexa Flour (AF) 405 or Cy3 and AF647 dyes mixed in a tube with unlabelled antibody was used for the activator-reported STORM double staining. Donkey AF594 anti-mouse or AF647 anti-mouse labelled antibodies were ready purchased (Jackson).
20 μm tissue sections were stained in a free floating manner, using the following primer antibodies: CB1 (guinea pig, 1:1000, M. Watanabe), CB1 (rabbit, 1 μg/ml, ImmunoGenes), bassoon (mouse, 1:2000, Ab82958, Abcam), CCK (mouse, 1:3000
#9303, CURE).
3.4. Confocal and correlative confocal and STORM imaging
In order to characterise the filled cells, we used Nikon A1R or C2 confocal microscopes and collected Z-stacks with a 20x objective from the cell optimally placed in the field of view.
All STORM and correlative confocal and STORM images were acquired with a Nikon Eclipse Ti-E microscope body equipped with Nikon C2. We used a cylindrical lens placed in front of the Andor EMCCD camera for astigmatism-based 3D imaging. A new imaging medium was prepared for the examination of each sample, containing 5% glucose, 0.1 M 2-mercaptoethylamine, 1 mg/ml glucose oxidase (Sigma) and 1500U/ml catalase (Sigma) in DPBS (Dulbecco’s phosphate buffered saline).
3.5. Confocal and correlative confocal STORM image analysis
The high-resolution Z-stacks were deconvolved with Huygens-el (SVI) with PSF calculated on the basis of the parameters of the microscope and the medium. For the correlative analysis, the deconvolved confocal image and the STORM image were registered with TurboReg plug-in of ImagJ. The series of images recorded by Nikon N- STORM microscope was analysed with the N-STORM 3.4 module of the Nikon NIS- Elements AR 4.3 programme. The boutons on the pixel-based confocal images were
9
freehand selected to separate the STORM localisations belonging to each bouton. Data analyses on these localisations were conducted with the programmes Matlab (Mathworks) and Python (Python Software Foundation).
4. Results
4.1. Measurement of resolution of Nikon N-STORM microscope
100 nm beads evenly distributed on the cover slip were used to test our microscope set- up. Several successive measurements were carried out with different excitation illumination intensity but with identical exposure time in order to measure resolution in function of the number of collected photons. Five hundred images of beads were collected and the localisation points obtained were plotted along the X-axis and fitted with a Gaussian function, as it is known that the half-width of the Gaussian function equals the resolution. In the case of 6000 photons, our measurements located the position of the 100 nm beads with a lateral resolution of about 6 nm.
4.2. Assessing the quantitative power of STORM
An important question is whether STORM imaging is capable of relative quantitative measurements. Essentially, STORM is a stochastic imaging method, which means that individual labels can be detected with a certain probability. Moreover, a particular label may appear more than once, so the suitability of STORM for relative quantification needs to be tested. For this purpose we used a HEK-293 cell culture transfected with a plasmid DNA containing the coding sequence of the human cnr1 gene (encoding the CB1 protein) fused with the coding sequence of the fluorescent protein EGFP. This resulted in the HEK-293 cells producing large amounts of N-terminal EGFP (extra-cellular)-CB1
(transmembrane) fusion protein. CB1 immune staining was visualised by means of STORM imaging. EGFP confocal fluorescent signal corresponding to the whole images of the HEK cells and the value of all localisation points showed strong positive linear correlation (n = 46 cells, 5 cover slips, Spearman’s rank order correlation, R = 0.92, p <
0.001).
10
4.3. Examination of parameters effecting the resolution of STORM- imaging in CB
1immune-stained nerve-tissue preparation
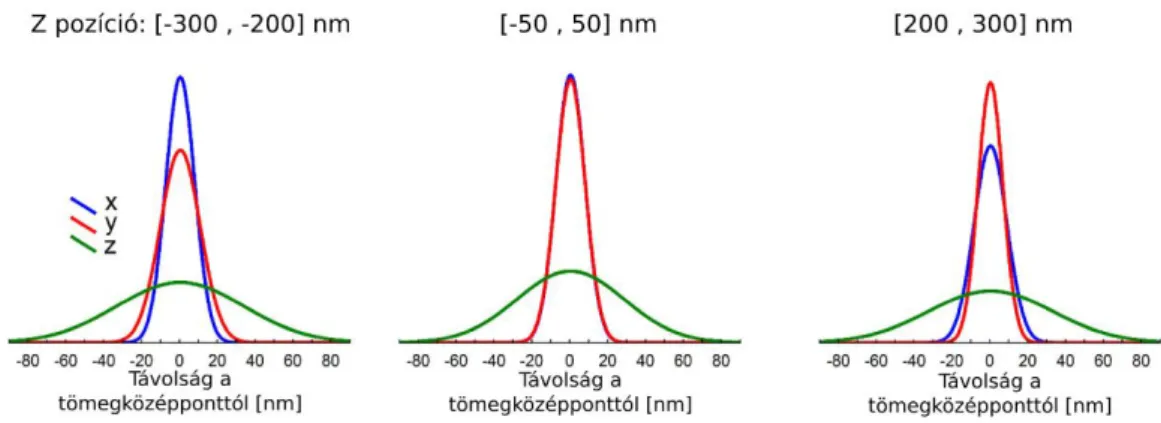
The half-width of the Gaussian function plotted over the spacial distribution of the multiple appearance of the image of the light source was established as the measurement of the resolution of tissue STORM microscopy. Immune staining always contained aspecific labelling. Since a secondary antibody may contain several AF647 and one fluorophore appears several times, these aspecifically bounded labels appear as isolated localisation groups in the image. These clusters are identifiable in the images and can be aligned to each other by their centre of mass. Our experiment demonstrated that the dataset is suitable for measuring resolution in the direction X-Y and Z in the brain tissue as well. In the case of the CB1 immune staining of tissues, we received sigma values of 6 nm in the direction X-Y and 41 nm in direction of Z at a depth of 5 µm in the hippocampal sections (Figure 1).
Figure 1. The resolution of STORM imaging in brain tissue. Localization clusters produced by single, non-specifically bounded fluorophores aligned by its center of mass and fitted a Gaussian on the lateral distribution. We collected clusters from different focal depth and determined the resolution. In the focal plane the resolution was X-Y 18nm, and 65 nm in Z direction.
4.4. Correlative confocal and individual molecule localisation super- resolution light microscopy
At the time of my experiments, STORM imaging of membrane labelling of tissues was not yet available, therefore, the axon terminals of cells specifically labelled during the
11
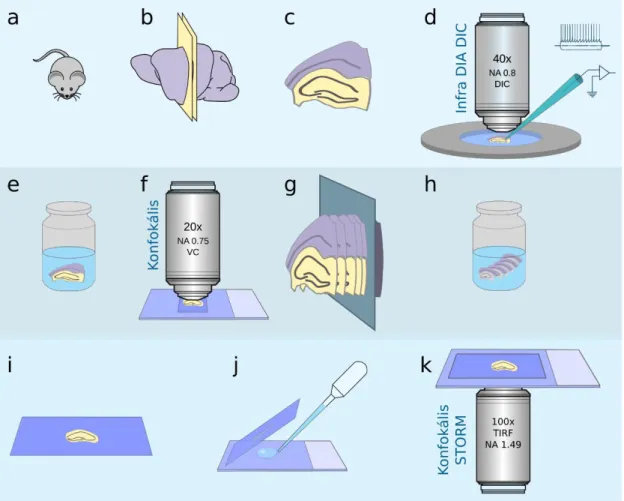
electro-physiological measurements could only be visualised by means of traditional confocal imaging. Thus, we decided to combine the image of traditional confocal-level resolution with STORM-imaging. For this purpose, we equipped our original Nikon N- STORM microscope with a C2 confocal head in order to achieve the correlative confocal STORM-imaging. We developed the following method for correlative confocal and STORM-imaging of the boutons of cells individually filled by patch-pipettes (Figure 2).
1) In vitro whole cell patch-clamp electro-physiology recording in acute surviving hippocampal slice preparations of mice. Individual target cell filled up with biocytin during physiological characterisation.
2) Fixation of slice and development of biosytin labelling with AF488-streptavidin, visualisation of target cell, DAPI staining for visualisation of nuclei and delineation of layer boundaries.
3) Confocal Z-stack of filled cells acquired in mounted slice for morphological reconstruction and cell type identification.
4) Re-slicing of 300 µm thick acute physiological slices into 20 µm hippocampal sections.
5) Free floating immuno-staining of 20 µm sections. Drying on cover slip.
6) STORM and confocal imaging.
7) Visualisation of images and data analysis
4.5. VividSTORM a correlative confocal and STORM super-resolution microscopic analysis programme
Since a biologically important structure (in this case a labelled hippocampal interneuron) was available as a deconvolved confocal volex based image and the CB1 receptor as a coordinate-based STORM dataset, we needed a software programme which is capable of handling these completely different modalities together, i.e. in a correlative manner.
Furthermore, localisation datasets give rise to completely novel data analysis possibilities for the examination of nano-scale molecular spacial distributions. Although since I began my thesis work and published our studies on the subject, several works on correlative
12
Figure 2. Sample preparation and imaging process in electrophysiology recording combined correlative confocal and STORM imaging. (a-c) Preparing acute surviving 300 µm brain slices (d) Electrophysiology recording. (e) Tissue fixation and developing the biocytin. (f) Collecting Z-stack of the whole labeled cell. (g) Embedding the sections and slicing 20µm thin sections. (h) Immunostaining. (i) Mounting and drying stained sections on coverslip. (j) Just before STORM imaging embed the sections in imaging medium . (k) Correlative confocal and STORM imaging.
method have been published, such as electronmicroscope-SMLM or confocal microscope-SMLM, as far as we are aware, there was no appropriate, freely available software solution. Therefore, we decided to write a software programme capable of correlative visualisation and multiple analysis, which we named VividSTORM. We were pleased to see that since its publication, our study on the presentation of the VividSTORM software has been downloaded by more than 5000 people from Nature Protocols website.
13
The finished software has been downloaded by more than 700 users in 35 countries from the SourceForge website.
4.6. Measurement of molecular distances and density in individual molecule localisation microscope images
The simplest calculation is to determine the Euclidean distance between localisation points. In terms of interactions between receptors or ion channels in cell membranes it is more likely that the shortest distance between them measured on the membrane surface could be considered to have data value as opposed to Euclidean distance. Since the CB1
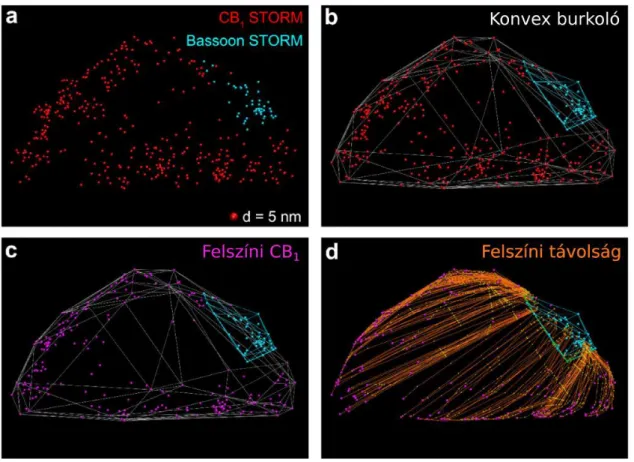
cannabinoid receptor is a G-protein coupled membrane protein and one of its significant downstream signalling target is the voltage gated calcium channel (VGCC), itself also being a membrane protein, a natural solution was to develop distance measurement on the membrane surface in the localisation images. The very large number of CB1-receptors in the axon terminals of CB1-positive hippocampal inter-neurons offered a good opportunity to model the membrane. The easiest way to approach the covering hull of a group of points modelling a membrane is the convex hull. After the plasma membrane model and the corresponding CB1 localisations become available, the next step was to label the synaptic active zone, which we made visible with bassoon staining. We developed our own algorithm to calculate the shortest surface distance between the bassoon staining and the CB1 localisations in the cell membrane (Figure 3). In order to be able to measure whether the CB1 -receptor is enriched around the active zone, we had to develop a method for measuring molecular density on the convex hull. We evenly spread sampling points on the convex hull surface in such a way that the average closest distances should be identical to the desired sampling frequency. Sampling frequency was adjusted to the XY resolution of STORM-images to measure density. We calculated the shortest surface distance of each sampling point from the active zone and measured the number of CB1 localisations within a radius of 200 nm. In order to be able to estimate the extent of density difference we can measure with this method, we modelled different levels of enrichment around the active zone, taking into account the characteristic geometric conditions of the boutons. The difference between the 0–250 nm and the 1000–
1250 nm bins is already significant at 20% (p < 0.0001), but not at 10% enrichment (p = 0.84).
14
Figure 3. Modelling the cell membrane by convex hull and the shortest distance calculation along the hull. (a) Double CB1 bassoon STORM image of axon terminal. (b) Convex hull of CB1 and bassoon localizations. (c) Only the membrane CB1 localizations displayed. (d) The shortest surface distances between CB1 localizations and the bassoon convex hull
4.7. Cluster analysis in localisation microscope images
Staining of spatially well separated biological structures and functional areas appears as separate groups of pixels or voxels up to the resolution limits in traditional microscopy as well. In localisation microscopy, these separate details appear as groups or clusters of localisation points. In pixel-based microscopy, segmentation according to intensity can be used to separate individual structures. This function can be realised with respect to individual-molecule localisation microscopic data by means of localisation clustering.
We need an algorithm in which there is no need to determine the number of clusters in advance and there is a separate set to handle the noise (to filter non-specific signals). One such method is Density-Based Spatial Clustering with Noise (DBSCAN). A point is member of a cluster if there are at least an N number of other points in its epsilon-radius
15
surrounding. In order to set the epsilon and N parameters, we have to take into account label density and the characteristic size of structures. With the DBSCAN function implemented in VividSTROM, it was easy to separate individual mitochondria in the mouse nerve-tissue preparation during our experiments.
4.8 Measurement of receptor internalisation in CB
1-positive interneuron terminals
Ligand binding induced GPCR signalling activation is followed by the internalisation of the receptors. In this case the receptor disappears from the plasma membrane via chlatrin mediated endocytosis, then it is recycled or degraded. In VividSTORM, we introduced two ways to calculate the internalisation index (II). The first one involves calculating a 2D convex hull on the localisation points (ignoring Z coordinates), determine its area and calculate radius r which belongs to a circle having this area. We calculate the 3D centre of mass M of the localisation points and calculate d, which is the Euclidean distance between M and the LP (localisation point). The d/r values calculated for each LP are then averaged to obtain II, whose value is around 1 if all LP's are located in the plasma membrane and 0 if they are in the centre of mass. Another method for calculating II is to calculate a convex hull over the LP labelling the membrane and measure the Euclidean distance of the LP's labeling the receptors from this surface. We consider internalised all LP's that are farther from the convex hull than a given threshold. Finally, the II value is obtained as the ratio of the number of LP's in the membrane and the internalised LP's.
In our experiments, we also tested the internalisation effects of exo- and endocannabinoids with this analysis.
5. Conclusions
In my thesis, my main objective was to develop a method which enables molecular imaging in a nano-scale in a cell-type and subcellar domain-specific way in nerve tissue by combining confocal and STORM super-resolution microscopy. We optimised classical neuro-anatomical preparation and immuno-staining processes for super-resolution
16
microscopy, combined a confocal microscope with a STORM-system and created new software which is capable of simultaneous visualisation of the images acquired from the two-microscope modality and the analysis of data. As a result of our work, we drew the following conclusions:
1. Our experiments conducted in cell-free preparations, cell cultures and nerve-tissue preparations demonstrated that that STORM super-resolution microscopy is able to achieve localisation precision of X-Y plane under 20 nm and of Z direction around ~50 nm. This localisation precision corresponds to molecular imaging precision achievable with pre-embedding silver intensificated immunogold electron microscopy.
2. Our experiments show that STORM-microscopy is capable of relative measurement of quantitative changes, including spatial changes of target molecules, for instance to follow up receptor internalisation.
3. Correlative confocal and STORM super-resolution microscopy allow for molecular imaging in identified nerve cells and their specific sub-cellular compartments. The procedure can be extended from nerve tissue to other tissue types.
4. The VividSTORM correlative confocal and individual molecule localisation microscopy visualisation and data analysis software developed by our team is capable of arranging different microscope modalities manually or in the case of appropriate labelling automatically and correlatively analysing pixel intensities and localisation points. The open-source VividSDTORM software is freely downloadable and can be improved by other users. Within a specific target area it is able to measure molecular quantities, establish molecular distances, for instance on the surface of a convex hull modelling the surface of a cell compartment, determining molecular densities and cluster properties and calculating the internalisation index.
All things considered, it can be concluded that STORM super-resolution microscopy is a useful tool in neuro-sciences and more comprehensively in life sciences and still holds a lot of development potential.
17
6. List of publications
Publications related to this thesis:
Barna, L., Dudok, B., Miczan, V., Horvath, A., Zs.I., Laszlo., és Katona, I. (2016).
Correlated confocal and super-resolution imaging by VividSTORM. Nat. Protoc. 11, 163–183.
Dudok, B., Barna, L., Ledri, M., Szabó, S.I., Szabadits, E., Pintér, B., Woodhams, S.G., Henstridge, C.M., Balla, G.Y., Nyilas, R., és mtsai. (2014). Cell-specific STORM super- resolution imaging reveals nanoscale organization of cannabinoid signaling. Nat.
Neurosci. 18, 75–86.
Other publications:
Dormán, G., Cseh, S., Hajdú, I., Barna, L., Kónya, D., Kupai, K., Kovács, L., és Ferdinandy, P. (2010). Matrix metalloproteinase inhibitors. Drugs 70, 949–964.
Flachner, B., Varga, A., Szabó, J., Barna, L., Hajdú, I., Gyimesi, G., Závodszky, P., és Vas, M. (2005). Substrate-assisted movement of the catalytic Lys 215 during domain closure: Site-directed mutagenesis studies of human 3-phosphoglycerate kinase.
Biochemistry 44, 16853–16865.
Fülöp, K., Barna, L., Symmons, O., Závodszky, P., és Váradi, A. (2009). Clustering of disease-causing mutations on the domain-domain interfaces of ABCC6. Biochem.
Biophys. Res. Commun. 379, 706–709.
Gál, P., Harmat, V., Kocsis, A., Tunde, B., Barna, L., Ambrus, G., Végh, B., Balczer, J., Sim, R.B., Náray-Szabó, G., és mtsai. (2005). A true autoactivating enzyme - Structural insight into mannose-binding lectin-associated serine protease-2 activations. J. Biol.
Chem. 280, 33435–33444.
Gál, P., Barna, L., Kocsis, A., és Závodszky, P. (2007). Serine proteases of the classical and lectin pathways: Similarities and differences. Immunobiology 212, 267–277.
Kallo, I., Mohacsik, P., Vida, B., Zeold, A., Bardoczi, Z., AM, Z., Farkas, E., Kadar, A., Hrabovszky, E., R, A. e D., és mtsai. (2012). A Novel Pathway Regulates Thyroid
18
Hormone Availability in Rat and Human Hypothalamic Neurosecretory Neurons. PLoS One 7.
Kamondi, S., Szilágyi, A., Barna, L., és Závodszky, P. (2008). Engineering the thermostability of a TIM-barrel enzyme by rational family shuffling. Biochem. Biophys.
Res. Commun. 374, 725–730.
NG, T., Romero, R., Meiri, H., Erez, O., Xu, Y., Tarquini, F., Barna, L., Szilagyi, A., Ackerman, R., Sammar, M., és mtsai. (2011). PP13, maternal ABO blood groups and the risk assessment of pregnancy complications. PLoS One 6.
Papp, A., Szommer, T., Barna, L., Gyimesi, G., Ferdinandy, P., Spadoni, C., Darvas, F., Fujita, T., Ürge, L., és Dorman, G. (2007). Enhanced hit-to-lead process using bioanalogous lead evolution and chemogenomics: application in designing selective matrix metalloprotease inhibitors. Expert Opin. Drug Discov. 2, 707–723.
SH, L., Ledri, M., Toth, B., Marchionni, I., CM, H., Dudok, B., Kenesei, K., Barna, L., SI, S., Renkecz, T., és mtsai. (2015). Multiple Forms of Endocannabinoid and Endovanilloid Signaling Regulate the Tonic Control of GABA Release. J. Neurosci. 35, 10039–10057.
Tomori, T., Hajdu, I., Barna, L., Lorincz, Z., Cseh, S., és Dorman, G. (2012). Combining 2D and 3D in silico methods for rapid selection of potential PDE5 inhibitors from multimillion compounds’ repositories: biological evaluation. Mol. Divers. 16, 59–72.