Biomolecular Chemistry
PAPER
Cite this:Org. Biomol. Chem., 2018, 16, 2997
Received 25th January 2018, Accepted 29th March 2018 DOI: 10.1039/c8ob00213d rsc.li/obc
A rapid and concise setup for the fast screening of FRET pairs using bioorthogonalized fl uorescent dyes †
Réka Petrovics,aBianka Söveges,aAlexandra Egyed,aGergely Knorr,a
Attila Kormos, aTímea Imre,bGyörgy Török, cAndrás Zeke,dÉva Kocsmár,e Gábor Lotz,ePéter Kele aand Krisztina Németh *a
One of the most popular means to follow interactions between bio(macro)molecules is Förster resonance energy transfer (FRET). There is large interest in widening the selection of fluorescent FRET pairs especially in the region of the red/far red range, where minimal autofluorescence is encountered. A set of bioorthogonally applicable fluorescent dyes, synthesized recently in our lab, were paired (Cy3T/Cy5T;
Cy1A/Cy3T and Cy1A/CBRD1A) based on their spectral characteristics in order to test their potential in FRET applications. For fast elaboration of the selected pairs we have created a bioorthogonalized platform based on complementary 17-mer DNA oligomers. The cyclooctynylated strands were modified nearly quantitatively with the fluorophoresvia bioorthogonal chemistry steps, using azide- (Cy1; CBRD1) or tetrazine-modified (Cy3; Cy5) dyes. Reactions were followed by capillary electrophoresis using a method specifically developed for this project. FRET efficiencies of thefluorescent dye pairs were compared both in close proximity (5’and 3’matched) and at larger distance (5’and 5’matched). The specificity of FRET signals was further elaborated by denaturation and competition studies. Cy1A/Cy3T and Cy1A/CBRD1A introduced here as novel FRET pairs are highly recommended for FRET applications based on the signifi- cant changes influorescence intensities of the donor and acceptor peaks. Application of one of the FRET pairs was demonstrated in live cells, transfected with labeled oligos. Furthermore, the concise installation of the dyes allows for efficientfluorescence modification of any selected DNA strands as was demon- strated in the construction of Cy3T labeled oligomers, which were used in the FISH-based detection of Helicobacter pylori.
Introduction
Detection of bio(macro)molecules in biological samples or their interactions are preferably followed by fluorescence.1–3 The derivatization of target molecules of interest by means of small fluorescent molecules is less laborious than expressing them with fusion tags (e.g.GFP).4Furthermore, small molecules are less likely to perturb the function and interacting character- istics of the protein of interest (POI). Moreover, the use of fusion proteins as tagging agents is limited to proteins, leaving out other biomolecules that are not directly encoded in the genome.5,6 Detection of specific oligonucleotide sequences, whose presence is associated with infections or pathophysio- logical alterations (e.g.cancer), is mostly carried out by labeled counterstrands as hybridization probes. Such diagnostic methods are rationalized by the fluorescentin situhybridization technique (FISH) or DNA arrays in DNA chips.7–12
An alternative setup employing two (or more) fluorophores is possible through the Förster-type resonance energy transfer
†Electronic supplementary information (ESI) available: Spectral overlap of the dyes, details of the capillary electrophoretic follow up, the LC-MS spectra of the labeled oligomers, calculation of the oligomer distances, the temperature con- trolled denaturation of the DNA oligomers, flow cytometric analysis and NMR spectra of Cy1 dye. See DOI: 10.1039/c8ob00213d
aResearch Centre for Natural Sciences of Hungarian Academy of Sciences, Institute of Organic Chemistry,“Lendület”Chemical Biology Research Group, H-1117 Budapest, Magyar tudósok krt. 2, Hungary. E-mail: nemeth.krisztina@ttk.mta.hu;
Tel: +361 382 6659
bResearch Centre for Natural Sciences of Hungarian Academy of Sciences, Instrumentation Center, MS Metabolomics Research Group, H-1117 Budapest, Magyar tudósok krt. 2, Hungary
cResearch Centre for Natural Sciences of Hungarian Academy of Sciences, Institute of Enzymology, Molecular Cell Biology Research Group, H-1117 Budapest,
Magyar tudósok krt. 2, Hungary
dResearch Centre for Natural Sciences of Hungarian Academy of Sciences, Institute of Enzymology, Protein Research Group, H-1117 Budapest, Magyar tudósok krt. 2, Hungary
e2ndDepartment of Pathology, Semmelweis University, Budapest H-1091 Üllői str. 93, Hungary
Open Access Article. Published on 29 March 2018. Downloaded on 1/17/2019 11:48:10 AM. This article is licensed under a Creative Commons Attribution-NonCommercial 3.0 Unported Licence.
View Article Online
View Journal | View Issue
(FRET) effect. FRET is a non-radiative, long-range energy trans- fer process between two light responsive moleculesviadipole–
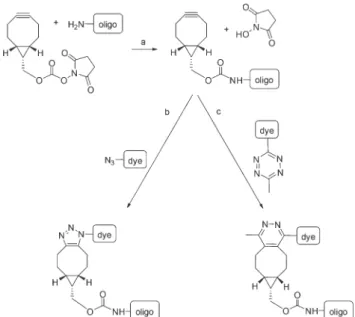
dipole interactions.13–16 FRET efficiency depends mainly on the spectral overlap integral (including quantum yields) of the partners. Moreover, it is inversely proportional to the sixth power of the distance between the donor and acceptor mole- cules and highly affected by the orientations of the transition dipoles of the donor and the acceptor moieties.17,18 Since FRET based assays are widely used in research and in clinical diagnostics e.g. in the 5′ nuclease assay for PCR monitoring (TaqMan probes), single nucleotide polymorphism (SNP) detection, real-time nucleic acid detection, multiplex real-time PCR quantification, allelic discrimination, and cleavage and mutation detection7,19–22 there is great interest in widening the selection of available fluorescent FRET pairs, especially in the orange/red/far red range. Furthermore, fluorophores with large Stokes shifts are ideal candidates for FRET applications as they prevent direct excitation of acceptor emission by the light used to excite the donor.23 Installation of fluorophores onto oligonucleotides is crucial. Bioorthogonal chemical trans- formations offer fluorescent modulation schemes that are high yielding, biocompatible and proceed even inside cells. Of the bioorthogonal reactions the strain-promoted azide–alkyne cycloaddition (SPAAC) and the inverse electron demand Diels– Alder reaction (IEDDA) of tetrazines and strained olefins are the most popular ones due to their full biocompatibility and reasonable reaction rates.23 Bioorthogonalization of oligonu- cleotides can be carried out through post-synthetic modifi- cation with biorthogonal handlesviareactive functional group modifiers conjugated mostly at the termini of the oligo- nucleotide strand.5,24Internal incorporation of non-canonical nucleotides harboring a reactive motif is also possible either through the post-synthetic transformation of modified mono- mers orviathe enzymatic incorporation of bioorthogonalized nucleotides.25Accordingly, fluorescent labeling of oligonucleo- tides is accomplished in a subsequent step using fluorescent probes carrying the complementary biorthogonal function.
Fluorescently labeled double stranded DNAs are ideal models for screening fluorescent dyes for FRET applications.
Upon varying the oligomer length the Förster radii can also be estimated.26,27
In this study we aimed to test selected fluorescent dye pairs from our dye-set in FRET applications. Selection criteria were based on the Stokes-shifts and excitation/emission bands of the dyes.
Results and discussion
Selection of dye pairs for efficient FRET
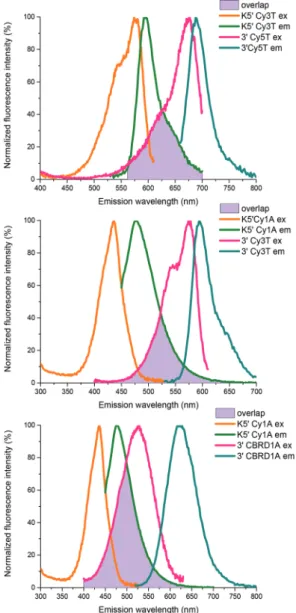
Firstly, we determined the fluorescence spectra of the dyes syn- thesized in our lab and paired them according to the spectral overlaps between absorption (acceptors) and emission spectra (donors) (Fig. 1). From the screening procedure the following three pairs seemed to be promising: Cy3-tetrazine/Cy5-tetra- zine; Cy1-azide/Cy3-tetrazine; and Cy1-azide/CBRD1-azide
(Chemical Biology Research Group dye 1: (E)-1-(3-azidopropyl)- 4-(2-(7-(diethylamino)-2-oxo-2H-chromen-3-yl)vinyl)pyridin-1- ium)28(Fig. S1 and S2†). Tetrazine modified labeling reagents have advantage over other bioorthogonal motifs in that they react orders of magnitudes faster with their partners.23,29The Cy3/Cy5 pair is widely used in FRET applications;14,18,26on the contrary the other two fluorescent dye pairs are not available in the literature – according to the best of our knowledge.
Almost identical overlaps were established for the Cy3T/Cy5T and Cy1A/Cy3T pairs, while more considerable interaction is expected for the Cy1A/CBRD1A pair. CBRD1A is remarkable for its large Stokes-shift.28Besides spectral overlap and distance, orientation of transition moments can also modulate the efficiency of energy transfer.
Bioorthogonal fluorescent labeling of DNA oligomers
In order to be able to test the selected partners quickly and efficiently, we aimed at establishing a concise protocol. To this end, we have selected complementary 17-mer oligonucleotide sequences for fluorescent derivatization. The selected sequences are suitable for the detection ofHelicobacter pylori strains susceptible to clarithromycin (a macrolide antibiotic used in the first-line treatment ofH. pylori) in gastric biopsies of human patients in FISH-based assays.30The complementary oligos carried an amine modified linker either at the 5′or 3′
end (NH2-(CH2)6-5′CGG-GGT-CTT-TCC-GTC-TT3′ – Clarwt5′;
5′CGG-GGT-CTT-TCC-GTC-TT3′-(CH2)7-NH2–Clarwt3′and NH2- (CH2)6-5′AAG-ACG-GAA-AGA-CCC-CG3′ – ClarwtK5′). The oligos were modified with a strained cyclooctyne motif, (1R,8S,9S)- bicyclo[6.1.0]non-4-yn-9-ylmethanol (BCN), via treatment of the amino modified DNA strands with commercially available BCN-succinimidyl ester (NHS-BCN) (Scheme 1). BCN was selected as a bioorthogonal motif as it can readily react with both azides and tetrazines in SPAAC and IEDDA reactions, respectively. In order to follow the installation of BCN onto the oligos and subsequent fluorescent labeling reactions a high resolution capillary zone electrophoretic (CE) method was developed (Fig. S3†). CE analysis indicated that the oligos, especially the GC richClarwt5′andClarwt3′, existed in multiple conformations probably due to inter- and intramolecular inter- Fig. 1 Structures of the selected dyes forfluorescent labeling of DNA oligomers.
Open Access Article. Published on 29 March 2018. Downloaded on 1/17/2019 11:48:10 AM. This article is licensed under a Creative Commons Attribution-NonCommercial 3.0 Unported Licence.
actions through H-bond formation giving rise to a group of peaks on the electropherogram. This finding is fully in line with secondary structure predictions using the mFOLD server, indicating the capacity to form an internal helix, incorporating the 5′end of the oligonucleotide (Fig. S4†). The folding energy would correspond to an internal melting point of∼41 °C at the ionic strength of 50 mM Na+ (the estimated melting tem- perature of the duplex is at∼55 °C at the same ionic strength).
As a consequence, some of these conformations turned out to be less reactive upon reaction with NHS-BCN. Elevation of the temperature to 60 °C for a short period of time (5 min) was found to be efficient to disrupt these secondary binding forces. As a result, a single peak appeared in the electrophero- gram. In addition, the terminal amino group became fully accessible; thus, upon treatment of 100 µM amino-DNAs with 5 mM NHS-BCN nearly quantitative conversion (90%) was obtained (Scheme 1). The efficiency of this CE method was quite satisfying as in each case the starting materials and the product could be well resolved. The reactions completed within 20 minutes in each case. A subsequent size exclusion (G25) spin column purification step was carried out yielding products of 90% purity with 20–25% loss. Subsequent fluo- rescent derivatization using fluorescent or fluorogenic dyes (500 µM) required only 15 min incubation time at room tem- perature resulting in an average of 90% conversion. The product peaks were confirmed both by UV absorption and by fluorescent detection (LIF-CE) at wavelengths corresponding to the respective dyes. The products were purified similarly using a G25 spin column. The identification of the labeled oligos was carried out by LC-MS (Fig. S5–S15†). Final concentrations
of the labeled oligos were estimated from the peak area in CE at 260 nm and also with UV detection using a Nanodrop system at 260 nm. The total yields fell between 20 and 30%
with 90% purity (Fig. S16–S26†).
Application of fluorescently labeled DNA oligos as FISH probes Before moving onto the actual FRET studies, we were curious about the applicability of our labeled DNA strands in FISH applications. The selected oligomers are indeed suitable for the detection of Helicobacter pyloriinfections, through whole cell hybridization with the 23S rRNA sequence ofH. pylori. We tested the suitability of two labeled oligos in the genotypic detection of clarithromycin resistance/susceptibility in H. pyloriinfected gastric tissues.30,31Human gastric biopsies were treated with fluorescently (Cy3T) modified oligosClarwt5′ and Clarwt3′ (Fig. 2). We have chosen samples from patients suffering from clarithromycin-susceptible H. pylori infection ( previously diagnosed by commercial FISH probes32) and healthy controls as well. In the microscopy images it is clearly seen that the bacteria fluoresce in red in the apical mucosa of the prefixed and treated sections, while no labeling can be detected in the healthy control samples (Fig. 2). Both the 5′and 3′conjugated DNA strands seemed similarly efficient in this FISH protocol. These results suggest that suitable fluo- rescent dyes, even ones not available commercially can be easily adopted for FISH applications using the above protocol.
FRET models
Fluorescently labeled complementary oligonucleotide strands provide an easy tool for investigating the suitability of novel dyes in FRET application.33,34 When fluorescence modifi- cations were situated in close proximity (5′ and 3′ matched) the estimated distance of the dyes was 18 Å; while positioned at distal ends (5′and 5′matched sequences) this distance was Scheme 1 Bioorthogonal labeling reactions of amino modified DNA
oligomers. Derivatization with NHS-BCN; fluorescent labeling by an azide or tetrazine group harboring a dye through click chemistry.
Experimental conditions: 100μM DNA oligo, 110 mM NaHCO3+ 2.2 mM EDTA buffer ( pH 9.0), incubation: 25 °C for 20 min (a, b, c), 5 mM NHS-BCN (a), 500μM dye (b, c).
Fig. 2 Labeling of clarithromycin sensitive Helicobacter pylori by a Cy3T modified DNA oligomer in gastric biopsies of healthy (A) and infected (B, C) patients. The arrows indicate that the stained bacteria fluoresce in red in the mucosa. The DAPI nuclear counterstain produces bluefluorescence (original magnification: 63×). Labeling efficiency was independent of the modification site (3’ or 5’, Panels B and C, respectively).
Open Access Article. Published on 29 March 2018. Downloaded on 1/17/2019 11:48:10 AM. This article is licensed under a Creative Commons Attribution-NonCommercial 3.0 Unported Licence.
51 Å ± 5 Å (Fig. 3 and Table S1†). Since in FRET 50% efficiency can be achieved at around these distances according to the literature data the predicted lengths for oligomer pairs were quite suitable for the estimation of Förster radii (e.g.for Cy3–Cy5 pairs Förster radiusR0= 56–59 Å).13,27,35
We prepared all combinations of fluorescently labeled DNA oligos by the above two-step method. Since FRET efficiency seemed to be independent of the labeling site (i.e. which strand was conjugated by the acceptor or donor dyes) we show here the case whereClarwt3′andClarwt5′were modified with the acceptor dyes while the counterstrandClarwtK5′ held the donors. The spectral overlap of the fluorescently labeled DNA oligomers is presented in Fig. 4.
Testing the FRET efficiencies of selected dye pairs
FRET efficiencies were monitored by measuring fluorescence intensities and changes in the spectra of the donor and the acceptor peaks. Before analyzing the results obtained upon annealing the oligomers we aimed to assess the occurrence of any non-specific FRET signals. The concentration range of the DNAs in FRET measurements was chosen according to the dis- sociation constant of the strands (1–10 nM).36At 500 nM with a 1 : 1 ratio of the free dyes (not conjugated to DNA) no FRET signal could be observed. Furthermore, at the same concen- tration, the acceptor–oligo conjugates did not demonstrate any remarkable fluorescent signal when excited at the excitation wavelength of the respective donor.
Fig. 5 shows the changes in normalized fluorescence inten- sities of the donor and acceptor dyes, when the concentration of the donor–ClarwtK5′ was kept constant (500 nM), while the concentration of the acceptor–Clarwt3′orClarwt5′varied within the range of 62.5 to 2000 nM. The maximal FRET efficiencies are summarized in Table 1. The apparent FRET efficiencies were cal- culated according to the following equation:Eapp= 1−(IDA/ID), whereIDAandIDare the fluorescence intensity of the donor dye measured in the presence and in the absence of the acceptor, respectively.Eapp provides only an approximate indicator of the dye–dye distances because of the uncertainty of the orientation factor of the fluorophores. Furthermore, instrumental correc- tions were ignored and are not involved in the equation.
Regarding proximal modification–i.e.annealing of labeled Clarwt3′ andClarwtK5′ – the most impressive decrease in the
donor fluorescence was detected for the Cy3T/Cy5T pair (nearly 90%). In the case of the other two pairs the decrease in the donor fluorescence wasca.70%. On analysing the increase in the acceptor fluorescence intensity a negligible effect for Cy3T/Cy5T was observed. On the contrary, in the case of the Cy1A/Cy3T and Cy1A/CBRD1A pairs, acceptor signals changed considerably upon annealing. The specificity of the FRET signals was further supported by competition studies using unlabeled strands. Increasing amounts of unlabeled competi- tor strands resulted in a substantial decrease of the FRET signal (data not shown).
When fluorescence modifications were localized at the distal termini of the DNA oligomers, FRET efficiencies dropped in general and only 39–56% FRET efficiencies could be achieved. On the other hand quite a good estimation of the Förster radii could be done suggesting thatR0is approximately 50 Å for the Cy1A/CBRD1A pair and a bit shorter for the other Fig. 4 Spectral overlap of the DNA oligomers labeled by the selected dye pairs.
Fig. 3 Estimated distances of the 17-base pair long double stranded DNA.
Open Access Article. Published on 29 March 2018. Downloaded on 1/17/2019 11:48:10 AM. This article is licensed under a Creative Commons Attribution-NonCommercial 3.0 Unported Licence.
two pairs. The specificity of FRET signals was further tested by the temperature controlled denaturation of the hybridized double stranded DNA oligomers. Changes in the fluorescence spectra were monitored between 25 °C and 75 °C. Data were corrected with the temperature dependent fluorescence changes of single stranded oligos. Around the melting point
(Tm = 55–60 °C) the FRET efficiencies dramatically dropped both in the case of the proximally and distally labeled oligo- nucleotide pairs (Fig. S27†). The apparent melting point shifted to higher values in the case of proximally labeled strands, suggesting the existence of attractive interactions between the dyes (Table 1).
FRET signals in live cells
DNA oligomers labeled with Cy1A and Cy3T dye pairs were selected for the microscopy analysis of FRET signals in live cells. HEK293T cells were transfected with the donor (Cy1A conjugated ClarwtK5′) or with the acceptor (Cy3T conjugated Clarwt3′) or simultaneously with both labeled oligomers.
Transfection efficiencies were monitored by flow cytometry
Fig. 5 Changes influorescence intensity of the donor–DNA conjugate (500 nM; control-black) upon increasing acceptor concentration (62.5–2000 nM from brown to red). Fluorescence spectra of the accep- tor–DNA conjugate (500 nM) are presented in violet (A, C, and E). A, C, E:fluorescent labeling at the proximal termini of the DNA oligomers; B, D, F:fluorescent labeling at the distal termini of the DNA oligomers;
A–B: Cy3T/Cy5T; C–D: Cy1A/Cy3T; E–F: Cy1A/CBRD1A; A, B:
λex: 540 nm; C, D, E, F:λex: 420 nm.
Table 1 Maximal FRET efficiencies and melting points of labeled DNA oligomer pairs
Dye pairs Labeling site FRET efficiencya(%) Tmb(°C)
Cy3T/Cy5T Proximal 92 65
Distal 39 57
Cy1A/Cy3T Proximal 70 61
Distal 40 57
Cy1A/CBRD1A Proximal 77 63
Distal 56 59
aFRET efficiencies were observed at 500 nM donor–ClarwtK5′conjugate and labeled Clarwt3′ and Clarwt5′ from 62.5 to 2000 nM. bMelting points (Tm) were estimated from the FRET efficiency changes upon temperature controlled denaturation of the complementary DNA oligo- mer pairs.
Fig. 6 Fluorescence imaging of HEK293T cells transfected with oligos labeled either with the donor (Cy1A conjugated ClarwtK5’; top row) or the acceptor (Cy3T conjugated Clarwt3’: middle row) or both (bottom row) detected in the Cy1 channel (λex: 405 nm; λem: 475–545 nm); Cy3 channel (λex: 514 nm;λem: 620–800 nm); and FRET channel (λex: 405 nm;λem: 620–800 nm). White bars represent 10μm.
Fig. 7 Difference in bleaching kinetics of the donor in the presence (black) and in the absence (red) of the acceptor.
Open Access Article. Published on 29 March 2018. Downloaded on 1/17/2019 11:48:10 AM. This article is licensed under a Creative Commons Attribution-NonCommercial 3.0 Unported Licence.
(Fig. S28†). Confocal fluorescence microscopy images indicate that there is no cross-talk between the dyes and no emission of the acceptor occurs (between 620 and 800 nm) upon excitation at the donor’s excitation wavelength (405 nm). On the other hand, when the cells were transfected with both the donor and the acceptor, evident FRET signals could be detected between 620 and 800 nm upon excitation at 405 nm (Fig. 6). The bleaching kinetics was also analyzed. Fluorescence intensity of the donor dropped to half of the original value within 13 s in the absence of the acceptor, while an extended time course of 50 s was observed in the presence of the acceptor, further con- firming the efficiency of FRET (Fig. 7).
Conclusions
We designed bioorthogonalized oligonucleotide strands based on previously reportedClarwtsequences as platforms suitable for fast and efficient labeling by azide or tetrazine modified dyes. Not only are the selected sequences suitable for the elaboration of FRET efficiencies, the length of the oligonucleo- tides also allows for the estimation of Förster radii.
We have used these platforms to test selected, bioorthogon- ally applicable fluorescent probes from our existing dye-set.
The results indicated that the selected dyes exhibit strong FRET signals (70–90%) when the dyes are situated at proximal termini. As expected, decreased FRET efficiencies were detected when the distal termini were labeled. We have also examined the changes in FRET efficiencies as a function of temperature and concluded that in case of the double stranded oligos labeled at the proximal ends the Tm shifted towards higher temperatures, presumably due to attractive interactions between the dyes. The specificity of the FRET signals was affirmed by competitive studies using a non-labeled counter- strand. Regarding the pairs tested, the use of the Cy3T/Cy5T pairs is proposed when decrease in fluorescence intensity of the donor dye is desirable upon interactions between macro- molecules, while the Cy1A/CBRD1A or Cy1A/Cy3T pairs are suggested as primary choices when evolution of the acceptor signal is to be detected. The Cy1A/Cy3T pairs were further tested in live cells. Confocal microscopy images showed no considerable cross-talk between the donor and the acceptor, while a remarkable FRET signal was observed in HEK293T cells transfected with complementary DNA oligomers labeled fluorescently with the donor and the acceptor dyes, respect- ively. The evolution of the FRET effect was further proved by the donor bleaching kinetics in the presence of the acceptor.
Furthermore, the Cy3T labeledClarwtoligomers were applied in the FISH detection of H. pylori in gastric biopsy samples showing further use of the two-step – bioorthogonalization and bioorthogonal labeling–modification scheme. We believe that such easily accessible and modifiable oligonucleotide platforms can be applied in screening for further spectrally matching fluorophore pairs. The newly identified FRET pairs are suitable for expanding the spectral range in FRET appli- cations, not to mention the fact that these dyes are easily
installed to virtually any kind of biomolecules following bioorthogonalization.
Experimental
General methods
Unless otherwise indicated, all starting materials were obtained from commercial suppliers (Sigma-Aldrich, Fluka, Merck, Alfa Aesar, Reanal, Molar Chemicals, and Fluorochem) and used without further purification. Analytical thin-layer chromatography (TLC) was performed on silica gel 60 F254 precoated aluminium TLC plates from Merck. Visualization of TLC samples was performed with a 254/365 nm UV lamp.
NMR spectra were recorded on a Varian Inova 500 MHz instru- ment. Chemical shifts (δ) are given in parts per million ( ppm) using solvent signals as the reference. Coupling constants (J) are reported in hertz (Hz). The exact masses were determined with an Agilent 6230 time-of-flight mass spectrometer. All melting points were measured on an OptiMelt Automated Melting Point System and are uncorrected.
Synthesis
The synthesis of CBRD1A has been described previously by Keleet al.28The synthesis and application of Cy3T and Cy5T is published elsewhere.37
Synthesis of Cy1-azide
2-((6-Azido-3-ethyl-1,3-benzothiazol-2(3H)-ylidene)methyl)-3- ethyl-1,3-benzothiazol-3-ium hexafluorophosphate. A mixture of 3-ethyl-2-methylbenzothiazol-3-ium iodide38 (100 mg, 0.33 mmol), 6-azido-3-ethyl-2-methylsulfanylbenzothiazolium sulfate39 (108 mg, 0.36 mmol) and triethylamine (50 μL, 0.36 mmol) in 10 mL ethanol was stirred at 75 °C for 60 min under a N2 atmosphere (Scheme 2). After cooling, the solid was filtered and washed with cold ethanol. The salt was dis- solved in acetonitrile, and 0.3 g ammonium-hexafluoro- phosphate in water was added to the solution. The acetonitrile was removed, and the precipitated product was filtered, washed with water and dried in vacuo to give Cy1A (57 mg, 0.108 mmol, 33%) as a yellow solid. The product was used without further purification. Rf: 0.51 (cc. NaCl : EtOH = 1 : 9);
m.p.: decomp. in the presence of light; 1H NMR (500 MHz, DMSO-d6) δ8.25 (d,J = 7.7 Hz, 1H), 8.10 (d,J= 2.1 Hz, 1H), 7.91 (d,J= 8.7 Hz, 2H), 7.70 (t,J= 7.4 Hz, 1H), 7.51 (t,J= 7.6
Scheme 2 Synthesis of the Cy1A dye.
Open Access Article. Published on 29 March 2018. Downloaded on 1/17/2019 11:48:10 AM. This article is licensed under a Creative Commons Attribution-NonCommercial 3.0 Unported Licence.
Hz, 1H), 7.43 (dd,J= 8.8, 2.0 Hz, 1H), 6.72 (s, 1H), 4.73–4.63 (m, 4H), 1.40 (t,J= 7.3 Hz, 3H), 1.39 (t, J = 7.3 Hz, 3H);13C NMR (126 MHz, DMSO-d6)δ161.3, 161.2, 139.8, 137.2, 136.6, 128.7, 126.8, 125.0, 125.0, 123.6, 120.1, 114.7, 113.9, 113.6, 82.1, 41.8, 41.6, 12.2; HRMS: [M]+: calcd for [C19H18N5S2]+: 380.1004, found: 380.1002. For details see the ESI.†
DNA oligomers
The DNA oligos (NH2-(CH2)6-5′CGG-GGT-CTT-TCC-GTC-TT3′,
5′CGG-GGT-CTT-TCC-GTC-TT3′-(CH2)7-NH2 and NH2-(CH2)6-5′
AAG-ACG-GAA-AGA-CCC-CG3′) purchased from Metabion (Steinkirchen, Germany) were diluted in sterile distilled water in 1 mM concentration. These stock solutions were further diluted ten times with 110 mM Na2CO3 – NaHCO3, buffer (pH 9.0) containing 2.2 mM EDTA.
Based on several, unrelated, experimentally determined DNA or DNA–protein complexes available in the Protein Data Bank (PDB), the average distance between two opposing mono- mers that are 17 positions apart was estimated (Table S1†).
The average distance was not altered by including mildly bent, distorted, crosslinked or damaged DNA duplexes, as long as strands were fully complementary.
Conjugation processes
DNA oligos (100 μM) in 110 mM NaHCO3 + 2.2 mM EDTA buffer pH 9.0 were incubated at 60 °C for five minutes before labeling. (1R,8S,9S)-Bicyclo[6.1.0]non-4-yn-9-ylmethyl N-succinimidyl ester (NHS-BCN) was added to the oligos in 5 mM concentration at room temperature for 20 min. The modified oligos were separated from the excess of NHS-BCN on a Sephadex G25 “Fine” desalting gel (Pharmacia Fine Chemicals, Sweden) with SpinPrep column technology (Sigma, St Louis, MO, USA). The modified oligos were fluorescently labeled with 500μM dyes (Cy1A, Cy3T, Cy5T and CBRD1A) at room temperature for 20 min. The samples were purified with the desalting G25 spin column described above.
Analytical methods
Capillary electrophoresis.The background electrolyte (BGE) component boric acid was purchased from Sigma (St Louis, MO, USA), and sodium hydroxide, sodium carbonate and bicarbonate were purchased from Merck GmbH (Darmstadt, Germany).
Capillary electrophoresis was performed with an Agilent Capillary Electrophoresis 3DCE system (Agilent Technologies, Waldbronn, Germany) applying a bare fused silica capillary having 64.5 cm total and 56 cm effective length with 50 μm I.D. (Agilent Technologies, Santa Clara, CA, USA). On-line absorption at 260 nm was monitored for the detection of DNA and 420 nm, 500 nm, 540 nm and 595 nm for Cy1A, CBRD1A, Cy3T and Cy5T, respectively by a DAD UV-Vis detector. A laser (λex: 488 nm) (Melles Griot, Carlsbad, USA) induced fluorescent (LIF) signal was observed by a ZetaLIF Discovery detector (Picometrics, Labege, France) at 45.5 cm effective length. The capillary was thermostated at 25 °C. Between measurements, the capillary was rinsed subsequently with 0.1 M HCl, 1.0 M
NaOH, 0.1 M NaOH and distilled water for 3 minutes each and with BGE (200 mM sodium borate ( pH 9.0)) for 5 minutes.
Samples were injected by 5 × 10³ Pa pressure for 6 s. Runs were performed in the positive-polarity mode with 30 kV.
Nanodrop. Final concentrations of the dye–DNA conjugates were determined based on UV absorbance at 260 nm using a Nanodrop ND-1000 V3.5.2 spectrophotometer (NanoDrop Technologies, Wilmington, USA). A 3 µl sample was dropped onto the detector cell.
LC-MS analyses of fluorescently labeled oligonucleotides.
A Sciex 6500 QTRAP triple quadrupole/linear ion trap mass spectrometer, equipped with a Turbo V Source in an electro- spray mode (Sciex, CA, USA), and a PerkinElmer Series 200 micro LC system (Massachusetts, USA) consisting of a binary pump and an autosampler were used for LC–MS ana- lysis. Data acquisition and processing were performed using Analyst software version 1.6.2 (AB Sciex Instruments, CA, USA).
Chromatographic separation was achieved by a Purospher STAR RP-18 endcapped (55 mm × 2.1 mm, 3 µm) LiChocart®
55-2 HPLC cartridge. The sample was eluted with gradient elution using solvent A (0.1 mM ammonium formate in water) and solvent B (0.1 mM ammonium formate in MeOH). The flow rate was set to 0.4 ml min−1. The initial condition was 10% B for 1 min, followed by a linear gradient to 90% B by 5 min; from 6 to 8 min 90% B was retained; and from 8 to 8.5 min it was back to the initial condition with 10% eluent B and retained to 13 min. The column temperature was main- tained at room temperature and the injection volume was 10 µl (200–300 pmol on column). Nitrogen was used as the nebulizer gas (GS1), heater gas (GS2), and curtain gas with the optimum values set at 35, 40 and 40 (arbitrary units). The data were acquired in a negative ionization mode fromm/z= 300 to 2000 in 1.7 s. The source temperature was 400 °C and the spray voltage was set at −4500 V. The declustering potential value was set to−60 V.
Fluorescencein situhybridization
Clarithromycin-susceptible Helicobacter pylori bacteria were labeled by our fluorescently modified (Cy3T) oligos in human samples as described earlier.30,32In short, a freshly cut 4 µm tissue section of the formalin-fixed, paraffin-embedded gastric mucosa specimen was mounted on a coated glass slide, depar- affinized and microwaved in a Vector Antigen Unmasking Solution H-3300 (Vector Laboratories, Burlingame, CA, USA) at 400 W for 10 minutes. Hybridization solution containing one of the fluorescently (Cy3T) modified oligos (Clarwt5′ and Clarwt3′) was added to the specimens and incubated for 90 minutes at 46 °C. After a post-hybridization wash (15 minutes at 46 °C), the slides were mounted using a fluo- rescent mounting medium containing a blue fluorescent nuclear counterstain (Vectashield with DAPI, Vector Laboratories, Burlingame, CA, USA). Specific signals were examined using an epifluorescence microscope Leica DM-RXA (Leica Microsystems, Wetzlar, Germany) equipped with a DAPI filter for blue fluorescence as well as Spectrum Green and Spectrum Orange filters (Vysis, Downers Grove, IL, USA) for Open Access Article. Published on 29 March 2018. Downloaded on 1/17/2019 11:48:10 AM. This article is licensed under a Creative Commons Attribution-NonCommercial 3.0 Unported Licence.
green and orange-red fluorescence, respectively. Images were taken using a Leica DFC365 FX camera and documented by Leica CW4000 FISH analysis software.
FRET measurements
Fluorescence spectra were obtained by a PerkinElmer EnSpire Multimode Reader (PerkinElmer Inc.; Waltham; USA), a plate reader using a 384 well round bottom black plate (Corning;
Corning; NY, USA) at room temperature with 100 flashes per point. The sample volume was 20 µl. Data were acquired and handled by Corning Enspire Manager 4.10 software. Excitation wavelengths were 420 nm and 560 nm for Cy1A and Cy3T, respectively.
The temperature dependency of FRET efficiency was investi- gated using a Jasco FP-8300 spectrofluorimeter with the Spectra Manager 2.12 software between 25 and 75 °C. A heating step of 2 °C was achieved by elevating 0.8 °C min−1, and incubating for 2 min. A 200 µl sample was measured in a QS High Precision Cell, a 10 mm narrow SUPRASIL® quartz cuvette (HellmaAnalytics, Germany).
Cell culture
HEK293T cells (ATCC® CRL3216™) were cultured in Dulbecco’s modified Eagle’s medium (DMEM) (Life Technologies 41965-039) completed with 1% penicillin–
streptomycin (Sigma P0781), 1% L-glutamine (Sigma G7513), 1% sodium pyruvate (Life Technologies 11360), and 10% FBS (Sigma F7524) at 37 °C under a 5% CO2atmosphere.
FRET microscopy
For imaging we used poly-L-lysine treated 8-well Lab-Tek II chambers (Lab-Tek 155409). The wells were pretreated with 0.01 mg ml−1poly-L-lysine (Sigma P5899) for 4 h at room temp- erature and washed twice with PBS. HEK293T cells were seeded into the chambers (30 000 cell per well) and incubated for 24 h at 37 °C under a 5% CO2atmosphere. Afterwards the cells were transfected with 25 pmol fluorescently labeled DNA using Lipofectamine-3000 (Invitrogen L3000-001) and Optimem medium (Gibco 70011-044) and incubated for 4 h at 37 °C under a 5% CO2 atmosphere. Before measurements, cells were washed with PBS. Imaging was performed on a Zeiss LSM 710 microscope, applying a Zeiss PlanApo 40× (NA 1.4) objective. Bleaching constants were calculated by Fiji software and the exponential decay equation was calculated using Origin Pro9 software (OriginLab Corp.).
Con fl icts of interest
There are no conflicts to declare.
Acknowledgements
György Várady and Edit Szabó are greatly acknowledged for the flow cytometric measurements and Erzsébet Kovács for the
technical support in FISH analysis. The research was finan- cially supported by the Hungarian Academy of Sciences and the Hungarian Scientific Research Fund (Lendület Grant–LP 2013-55/2013 and OTKA-NN-116265). G. K. and É. K. acknowledge the support of the ÚNKP-17-3 New National Excellence Program of the Ministry of Human Capacities (ÚNKP-17-3-IV-ELTE-274 and ÚNKP_17-3-II-SE-3).
References
1 Y. Yan,Curr. Opin. Chem. Biol., 2003,7, 635.
2 A. Miyawaki,Dev. Cell, 2003,4, 295.
3 V. Marx,Nat. Methods, 2017,14, 949.
4 X. Chen and Y. W. Wu,Org. Biomol. Chem., 2016,14, 5417.
5 K. Rombouts, K. Braeckmans and K. Remaut,Bioconjugate Chem., 2016,27, 280.
6 E. Kozma, O. Demeter and P. Kele,ChemBioChem, 2017,18, 486.
7 V. V. Didenko,BioTechniques, 2001,31, 1106.
8 C. Cui, W. Shu and P. Li,Front. Cell Dev. Biol., 2016,4, 89.
9 L. Hu, K. Ru, L. Zhang, Y. Huang, X. Zhu, H. Liu, A. Zetterberg, T. Cheng and W. Miao, Biomark. Res., 2014, 2, 3.
10 G. Ramsay,Nat. Biotechnol., 1998,16, 40.
11 R. Bumgarner, Curr. Protoc. Mol. Biol, 2013, Chapter 22, Unit 22 1.
12 X. P. He, X. L. Hu, T. D. James, J. Yoon and H. Tian,Chem.
Soc. Rev., 2017,46, 6687.
13 P. G. Wu and L. Brand,Anal. Biochem., 1994,218, 1.
14 H. Sahoo,J. Photochem. Photobiol., C, 2011,12, 20.
15 S. E. Braslavsky, E. Fron, H. B. Rodriguez, E. S. Roman, G. D. Scholes, G. Schweitzer, B. Valeur and J. Wirz, Photochem. Photobiol. Sci., 2008,7, 1444.
16 T. Förster, Fluoreszenz organischer Verbindungen, Vandenhoeck & Ruprecht, Göttingen, 1951.
17 L. M. Loura,Int. J. Mol. Sci., 2012,13, 15252.
18 A. Munoz-Losa, C. Curutchet, B. P. Krueger, L. R. Hartsell and B. Mennucci,Biophys. J., 2009,96, 4779.
19 I. Täpp, L. Malmberg, E. Rennel, M. Wik and A. C. Syvänen,BioTechniques, 2000,28, 732.
20 S. Tyagi and F. R. Kramer,F1000 Med. Rep., 2012,4, 10.
21 Y. J. Chen, B. Groves, R. A. Muscat and G. Seelig, Nat.
Nanotechnol., 2015,10, 748.
22 N. Xie, J. Huang, X. Yang, X. He, J. Liu, J. Huang, H. Fang and K. Wang,Anal. Chem., 2017,89, 12115.
23 G. B. Cserep, A. Herner and P. Kele,Methods Appl. Fluoresc., 2015,3, 042001.
24 P. Z. Qin and A. M. Pyle,Methods, 1999,18, 60.
25 M. Merkel, S. Arndt, D. Ploschik, G. B. Cserep, U. Wenge, P. Kele and H. A. Wagenknecht, J. Org. Chem., 2016,81, 7527.
26 A. Dietrich, V. Buschmann, C. Müller and M. Sauer, Rev.
Mol. Biotechnol., 2002,82, 211.
27 R. A. Cardullo, S. Agrawal, C. Flores, P. C. Zamecnik and D. E. Wolf,Proc. Natl. Acad. Sci. U. S. A., 1988,85, 8790.
Open Access Article. Published on 29 March 2018. Downloaded on 1/17/2019 11:48:10 AM. This article is licensed under a Creative Commons Attribution-NonCommercial 3.0 Unported Licence.
28 P. Kele, G. Mezo, D. Achatz and O. S. Wolfbeis, Angew.
Chem., Int. Ed., 2009,48, 344.
29 K. Lang and J. W. Chin,ACS Chem. Biol., 2014,9, 16.
30 K. Trebesius, K. Panthel, S. Strobel, K. Vogt, G. Faller, T. Kirchner, M. Kist, J. Heesemann and R. Haas,Gut, 2000, 46, 608.
31 E. Demiray-Gurbuz, O. Yilmaz, A. Z. Olivares, C. Gonen, S. Sarioglu, M. Soyturk, S. Tumer, O. Altungoz, I. Simsek and G. I. Perez Perez,J. Pathol.: Clin. Res., 2017,3, 29.
32 E. Kocsmar, I. Szirtes, Z. Kramer, A. Szijarto, L. Bene, G. M. Buzas, I. Kenessey, P. Bronsert, A. Csanadi, L. Lutz, M. Werner, U. F. Wellner, A. Kiss, Z. Schaffand G. Lotz, Helicobacter, 2017,22, e12387.
33 J. Joseph, K. N. Baumann, P. Koehler, T. J. Zuehlsdorff, D. J. Cole, J. Weber, S. E. Bohndiek and S. Hernandez- Ainsa,Nanoscale, 2017,9, 16193.
34 P. Moroz, W. P. Klein, K. Akers, A. Vore, N. Kholmicheva, N. Razgoniaeva, D. Khon, S. A. Díaz, I. L. Medintz and M. Zamkov,J. Phys. Chem. C, 2017,121, 26226.
35 K. M. Parkhurst and L. J. Parkhurst,Biochemistry, 1995,34, 285.
36 S. Xu, J. Zhan, B. Man, S. Jiang, W. Yue, S. Gao, C. Guo, H. Liu, Z. Li, J. Wang and Y. Zhou,Nat. Commun., 2017,8, 14902.
37 G. Knorr, E. Kozma, J. M. Schaart, K. Nemeth, G. Torok and P. Kele, Bioconjugate Chem., 2018, DOI: 10.1021/acs.
bioconjchem.8b00061.
38 A. J. Winstead, N. Fleming, K. Hart and D. Toney, Molecules, 2008,13, 2107.
39 O. Demeter, A. Kormos, C. Koehler, G. Mezo, K. Nemeth, E. Kozma, L. B. Takacs, E. A. Lemke and P. Kele, Bioconjugate Chem., 2017,28, 1552.
Open Access Article. Published on 29 March 2018. Downloaded on 1/17/2019 11:48:10 AM. This article is licensed under a Creative Commons Attribution-NonCommercial 3.0 Unported Licence.