Organic &
Biomolecular Chemistry
rsc.li/obc
ISSN 1477-0520
PAPER
Volume 16 Number 32 28 August 2018 Pages 5723–5934
Biomolecular Chemistry
PAPER
Cite this:Org. Biomol. Chem., 2018, 16, 5756
Received 29th March 2018, Accepted 19th June 2018 DOI: 10.1039/c8ob00742j rsc.li/obc
Tracking down protein – protein interactions via a FRET-system using site-speci fi c thiol-labeling †
B. Söveges,aT. Imre,bÁ. L. Póti,cP. Sok,cZs. Kele,aA. Alexa,cP. Kele aand K. Németh *a
Förster resonance energy transfer is among the most popular tools to follow protein–protein interactions.
Although limited to certain cases, site-specific fluorescent labeling of proteinsvianatural functions by means of chemical manipulations can redeem laborious protein engineering techniques. Herein we report on the synthesis of a heterobifunctional tag and its use in site-specific protein labeling studies aiming at exploring protein–protein interactions. The oxadiazole-methylsulfonyl functionality serves as a thiol specific warhead that enables easy and selective installation offluorescent labels through a bioortho- gonal motif. Mitogen activated protein kinase (MAPK14) and its substrate mitogen activated protein kinase activated kinase (MAPKAP2) or its docking motif, a 22 amino acid-long peptide fragment, were labeled with a donor and an acceptor, respectively. Evolution of strong FRET signals upon protein–protein inter- actions supported the specific communication between the partners. Using an efficient FRET pair allowed the estimation of dissociation constants for protein–protein and peptide–protein interactions (145 nM and 240 nM, respectively).
Introduction
The human genome consists of nearly 30 000 genes, coding over half a million proteins. According to current estimations ca.80% of proteins operate in complexes.1Understanding the interactions in such protein complexes is important in the exploration of biochemical processes e.g. antibody–antigen interactions, signal transduction and regulation or hormone- receptor binding.2 Nowadays many robust methods are avail- able for the detection of protein–protein interactions (PPI) (e.g., affinity blotting, immunoprecipitation, quantitative pro- teomics, chemical crosslinking).3,4To investigate protein com- munication in live cells, however, fluorescence methods e.g.
bimolecular fluorescence complementation (BiFC)5,6or Förster resonance energy transfer (FRET) are the methods of choice.
Due to the time requirement for the reporter protein to mature BiFC cannot provide real-time information on PPIs, not to mention that the reconstituted fluorescent protein (FP) remains stable; thus the interaction is irreversible making BiFC less suitable to determine the dynamic features or spatio- temporal changes.7
The phenomenon of FRET is a highly distance-dependent process where an excited-state donor molecule transfers its energy to the acceptor molecule vianon-radiative, coulombic interactions. Because the efficiency of FRET is inversely pro- portional to the sixth power of the distance between the donor and the acceptor, it proves to be a very sensitive and dynamic tool for the investigation and characterization of the dynamics of protein–protein interactions.8,9
Selective fluorescence modulation of the proteins of interest can be considered one of the major challenges in the FRET technology. Fused FPs overcome this limitation in terms of selectivity; however, the comparable size of the fusion tags often hamper the dynamics of the interaction studied.
Selective fluorescent tagging with small organic reporters can be achieved by the use of smaller fusion tags (SNAP, CyS4etc.) or by encoding fluorescent or bioorthogonalized non-canoni- cal amino acids.10 While these techniques are powerful they are often laborious and require special skills and advanced infrastructure. In certain cases, purely chemical modification can be effected e.g. with reagents harboring a warhead that
†Electronic supplementary information (ESI) available: Accessible surface area calculations, Kdcalculation, mass spectrometric analysis of labeled proteins, spectral overlap of the fluorescent proteins, NMR spectra of the synthetic pro- ducts. See DOI: 10.1039/c8ob00742j
aResearch Centre for Natural Sciences of the Hungarian Academy of Sciences, Institute of Organic Chemistry, Chemical Biology Research Group, Magyar tudósok krt. 2, H-1117 Budapest, Hungary. E-mail: nemeth.krisztina@ttk.mta.hu;
Tel: +36 1 382 6659
bResearch Centre for Natural Sciences of Hungarian Academy of Sciences, Instrumentation Center, MS Metabolomics Research Group, Magyar tudósok krt. 2., H-1117 Budapest, Hungary
cResearch Centre for Natural Sciences of the Hungarian Academy of Sciences, Institute of Enzymology, Protein Research Group, Magyar tudósok krt. 2, H-1117 Budapest, Hungary
Open Access Article. Published on 19 June 2018. Downloaded on 1/17/2019 11:50:24 AM. This article is licensed under a Creative Commons Attribution-NonCommercial 3.0 Unported Licence.
View Article Online
View Journal | View Issue
selectively targets rare functions.11 Among the 20 protein- building amino acids, cysteine is one of the most suitable targets for such selective reactions because of the low abun- dance and good nucleophilicity of the free sulfhydryl group.12 Hence, various methods were developed for cysteine bioconju- gation,13such as reactions with electrophiles (α-halo carbonyl derivatives),14 use of Michael acceptors (maleimide deriva- tives,15vinyl sulfone16), thiol–yne or–ene reactions,17disulfide exchange,18 nucleophilic aromatic substitution of perfluoro- benzene derivatives,19or use of allenamide derivatives.20The majority of these approaches suffer from some limitations, such as some of the reagents being able to also modify other nucleophilic amino acid side chains. In the case of Michael- acceptors the resulting products are often unstable, due to retro-Michael reactions or in the case of maleimides due to the fact that the maleimide linkage is prone to hydrolysis.13 Moreover, the thioether group suffers from reversible exchange reactions with reactive thiols. Disulfide conjugates also tend to participate in exchange reactions,21while traditional thiol–ene reactions require nucleophilic or UV-light activation.22 The vinyl sulfone derivatives successfully addressed these pro- blems; however, their reaction kinetics is still too slow for certainin vivobiological experiments.23Recently, Toda and co- workers investigated the Julia–Kocienski-like methylsulfonyl- functionalized heteroaromatic derivatives and presented a new thiol-selective reagent, which was stable in biological environ- ments and offered superior reaction kinetics compared to other thiol-specific reactions.24
In this study, we aimed at investigating protein–protein interactions using FRET as an indicator of the communication of model protein p38α(MAPK14) and its direct substrate MK2 (MAPKAP2). Both proteins are the key components of the mitogen-activated protein kinase signaling pathway.25p38αis the main transponder of the inflammatory response, and MK2 plays an important role in the production of inflammatory cytokines.2
Based on our previous studies26with p38 and calculations of solvent accessible surface areas of the proteins, both of them contain accessible cysteines on their surface regions.
Along the above considerations we designed a bifunctional chemical reporter tag carrying a thiol-reactive oxadiazole- methylsulfone and a bioorthogonally reactive cyclooctyne motif that creates a platform for fluorescent modification. The fluorescently labeled protein constructs were then used in the exploration of protein–protein interactions using FRET.
Results and discussion
Synthetic procedures
First, we wanted to screen for FRET pairs from our azide and tetrazine derivatized dye-pool.27–30Since photophysical charac- teristics may substantially change upon conjugation to pro- teins, we needed a heterobifunctional tag that would enable Cys-specific targeting on the one hand and allow sequential one-pot high yielding modification both with azide- and tetra-
zine-modified fluorescent probes. To this end we designed cyclooctyne bearing methylsulfonyl-oxadiazole10(Scheme 1).
The synthesis started with Boc-protection of aminoethoxy- ethanol, 1, followed by the activation of the hydroxyl group with tosyl-chloride to provide3. The product was reacted with ethyl-hydroxybenzoate under basic conditions to obtain 4 in excellent yields. Hydrazide5was accessed upon treatment of4 with hydrazine monohydrate.
Oxadiazole6was then formed in good yields by a reaction of hydrazide5with carbon disulfide. Methylation of the sulf- hydryl moiety was effected by treatment of 6 with methyl iodide to furnish7. Oxidation of7withm-chloroperoxybenzoic acid gave8. Acidic removal of the Boc-protecting group quanti- tatively afforded amine 9. Compound 9 was functionalized with commercially available BCN–NHS to result in the Cys- specific heterobifunctional linker10.
Protein labeling and FRET pair screening
For protein–protein interactions we chose a mutant variant of p38αwhere the cysteine at position 162 was replaced by serine ( p38C162S). This site should remain minimally perturbed, as it is located near the docking site of the protein. For an interact- ing partner we selected its downstream substrate, the wild type MAPKAP2 (MK2). Besides mutant p38C162Sand MK2 we extended our study to a 22 amino acid oligopeptide represent- ing the docking motif of MK2 (CQIKIKKIEDASNPLLLKRRKK, pepMK2).25
In order to screen for potential FRET pairs, we aimed at comparing the excitation and emission spectra of our dyes in their conjugate forms. To this end, we created a bioorthogon- ally targetable protein scaffold using heterobifunctional tag 10, and p38C162S(Scheme 2).
Scheme 1 Reaction conditions: (a) Boc2O, DCM, 0–25 °C, 14 h, 96%;
(b) TsCl, Et3N, DCM, 25 °C, 14 h, quant.; (c) ethyl 4-hydroxybenzoate, K2CO3, DMF, 60 °C, 14 h, 99%; (d) N2H4× H2O, EtOH,Δ, 6 h, 99%; (e) CS2, KOH, EtOH, 85 °C, 14 h, 87%; (f ) CH3I, Et3N, THF, 25 °C, 2 h, quant.;
(g)mCPBA, DCM, 0–25 °C, 14 h, 84%; (h) TFA, H2O, DCM, 25 °C, 1 h, 99%; and (i) BCN–NHS, EDIPA, DCM, 0–25 °C, 90 min, 25%.
Organic & Biomolecular Chemistry Paper
Open Access Article. Published on 19 June 2018. Downloaded on 1/17/2019 11:50:24 AM. This article is licensed under a Creative Commons Attribution-NonCommercial 3.0 Unported Licence.
View Article Online
Before labeling, we confirmed that10reacts solely with sulf- hydryls. To do so we allowed 10 to react with glutathione (GSH). MS measurements (Fig. S1†) affirmed that only the SH- group participated in the reaction and no N-terminal modifi- cation was observed. These results are in agreement with the conclusions of Todaet al.24
Intact whole protein MS measurements verified that com- plete conversion of p38C162S could be achieved within 10 minutes by adding 2 equivalents of10to the protein, result- ing in a mono-conjugated form of p38C162Swith a negligible amount of any multiply labeled species (Fig. S2 and 3†).
In order to identify the labeling site, tandem mass-spec- trometry measurements were performed following trypsin digestion of p38C162Streated with9(Fig. S11†). A comparison of untreated and derivatized p38C162S samples revealed that the linker reacted mainly at Cys119, which is in accordance with our former results on calculated accessible surface area values (Table S1†).26
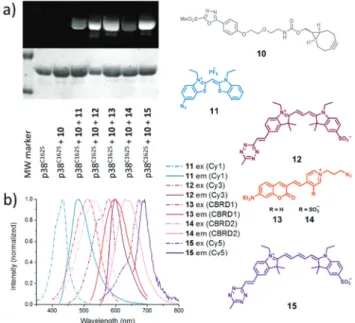
Next, we wanted to screen for the most promising FRET pairs in our bioorthogonal dye-pool. For this, we applied the bifunctional, cyclooctyne bearing chemical reporter 10 on mutant p38 in sequential labeling experiments with a series of azide or tetrazine bearing fluorescent or fluorogenic dyes (11–15). The labeling reactions were conducted in one-pot with sequential administration of10and the respective dyes to the solution of p38C162S, without any intermediate purification steps. Such bioorthogonal conjugation of the dyes was very efficient and in each case the conversion rates reached ca.
100% within 10 minutes, according to intact protein MS ana- lyses (Fig. S2–8†). Due to the fluorogenic nature of the dyes, no non-specific signal was observed even if non-specific adhesion of the dyes onto the surface of the proteins occurred (Table S3†). The labeled proteins were separated using SDS-PAGE and imaged under different excitation sources. In each case the dyes labeled the protein successfully (Fig. 1).
Next, we analyzed the excitation and emission spectra of the dye–protein conjugates to identify donor–acceptor pairs with overlapping emission and excitation bands. After evaluat-
ing the spectra, we identified a potential FRET pair of 11–12 (Fig. S13a†).
The efficiency and selectivity of the conjugation of 10 to MK2 were also assessed. In this case, addition of 2 equivalents of10to MK2 resulted in mono- and double-conjugated species as seen from intact whole protein MS measurements (Fig. S10†). Comparative MS-analysis of labeled and unlabeled, trypsin digested MK2 samples revealed that the two most accessible cysteines i.e., Cys224 and Cys98 were involved (Table S2†).
FRET measurements
To explore the FRET efficiency between11(Cy1) and12(Cy3), the interacting partners were modified with the dyes applying the same sequential scheme using10as a heterobifunctional linker (Scheme 2). This way, mutant p38 was labeled with11, while MK2 and pepMK2 were tagged with12(Fig. S12†).
Following the purification of the fluorescently labeled pro- teins and peptide, we studied the interaction between Cy1- conjugated p38C162Sand Cy3-conjugated pepMK2 or MK2. The FRET interaction between labeled p38C162S (0.5 µM) and increasing amounts of pepMK2 (0 to 8 µM) was monitored upon excitation of the donor fluorophore (λexc= 420 nm). The evolution of the FRET signal resulted in a gradual decrease of the donor fluorescence with a simultaneous increase of the acceptor’s fluorescence (Fig. 2). FRET efficiency was calculated using the below equation:
EFRET¼100ð1D=D0Þ;
Scheme 2 Sequential chemical labeling strategy using the heterobi- functional linker and the bioorthogonalizedfluorescent dyes.
Fig. 1 (a) Fluorescent labeling of linker (10) tagged p38C162S with bioorthogonalized dyes (11–15) monitored by SDS-PAGE. The upper gel refers to thefluorescence emission at different wavelengths (11: 488/
520; 12: 532/580; 13–14: 488/610; and 15: 633/670). The lower gel shows the result of the Coomassie staining. (b) Excitation and emission spectra of the listed dyes conjugated to p38C162S.
Open Access Article. Published on 19 June 2018. Downloaded on 1/17/2019 11:50:24 AM. This article is licensed under a Creative Commons Attribution-NonCommercial 3.0 Unported Licence.
whereDis the fluorescence intensity of the donor in the pres- ence of the acceptor at 482 nm at different concentrations and D0is the fluorescence intensity of the donor, in the absence of the acceptor. As seen in the inset of Fig. 2b the curve reached the saturation value at a remarkably high, 87% FRET- efficiency. This high FRET signal is in good accordance with the estimated short distance (10.6 Å) of the pepMK2 cysteine and the labeled Cys119 in p38 (according to the structure of the protein PDB code 2OZA).31The dissociation constant (Kd= 240 nM; see the ESI†) for pepMK2 was calculated to be slightly higher than the literature data (i.e. 50 nM) obtained for wild type p38α.25 The difference can be attributed to the altered interactions caused by mutation at position 162 of p38 as well as the presence of the additional Cys residue at the N-terminal of the peptide. Differences in the measurement methods can also be the reason e.g., fluorescence vs. polarization.
Systematic comparative measurements supported this hypoth- esis (for more detailscf.ESI part S7†).
In the case of the protein–protein interactions similar con- ditions were applied (Fig. 3). Signal changes were monitored at the same wavelengths upon interaction of fluorescently labeled Cy1-p38C162S with increasing amounts of Cy3-labeled MK2 (0 to 4 µM). For the calculation of the FRET efficiency the same equation was used; however, effects of protein interaction on donor fluorescence were taken into account as the presence of MK2 creates a less-polar environment for the donor resulting in an increase of the fluorescence intensity. Thus, the fluo-
rescence intensity of the donor fluorophore in the presence of acceptor labeled MK2 was always normalized with the fluo- rescence intensity of the donor, in the presence of unlabeled MK2 at the respective concentrations (Fig. S15†). The FRET efficiency went to saturation at 74% (Fig. 3b). Both cysteines were located within the critical distance i.e., 100 Å necessary for efficient FRET (dCys224= 29.8 Å anddCys98= 23.7 Å accord- ing to the structure of the protein complex PDB code 2OZA).31 The decreased FRET efficiency compared to the p38C162S– pepMK2 interaction could be explained by the longer distance between the labeling sites. The binding affinity between p38 and MK2 protein was found to beKd= 145 nM (see the ESI†).
EstimatedKdvalues in the literature vary between 1 and 100 nM depending on the amino acid sequence, the size of the given fragment, the activity ( phosphorylation) state of the interacting molecules and the ionic strength of the media.32
The high salt concentration– applied in order to prevent the aggregation of MK2–was concomitant of lower affinity in our setup.
Conclusions
In conclusion, we demonstrated the synthesis and use of a heterobifunctional linker that enables highly specific and efficient modification of proteinsviafree-sulfhydryl functional- ities of cysteine residues through its methylsulfonyl-oxadiazole warhead. The cyclooctyne functionalized bifunctional methyl- Fig. 2 (a) The structure of the complex of protein p38C162S(based on
PDB code 2OZA) and peptide MK2. The accessible cysteines are high- lighted in yellow. (b) Changes influorescence upon interaction between the Cy1-labeled p38C162Sand Cy3-labeled peptide MK2 (inset shows the calculated FRET-efficiency).
Fig. 3 (a) The structure of the complex of protein p38C162Sand protein MK2 (based on PDB code 2OZA). The accessible cysteines are high- lighted in green. (b) The FRET signal between Cy1-labeled p38C162Sand Cy3-labeled protein MK2 (inset shows the calculated FRET-efficiency).
Organic & Biomolecular Chemistry Paper
Open Access Article. Published on 19 June 2018. Downloaded on 1/17/2019 11:50:24 AM. This article is licensed under a Creative Commons Attribution-NonCommercial 3.0 Unported Licence.
View Article Online
sulfonyl linker readily creates a bioorthogonal platform that offers easy and high-yielding modification with azide or tetra- zine modified fluorescent probes. First, we used this heterobi- functional linker to screen for possible FRET pairs from our existing bioorthogonalized fluorescent pool. Following the identification of a promising FRET pair, we used this Cys- specific linker to modify p38C162Sand its interacting partner MK2 or its docking motif pepMK2 with a FRET donor and acceptor, respectively. Tandem-MS measurements verified the selective and specific labeling of both protein components.
FRET studies involving donor and acceptor labeled p38C162S– MK2 or p38C162S–pepMK2 partners confirmed the specific interactions of the proteins. Such heterobifunctional linkers are suitable for the selective modification of proteins posses- sing accessible free sulfhydryl functionalities. On the other hand, the high FRET efficiency between the identified dye pairs (ca.80%) is suitable for the detection of protein–protein interactions and estimation of the strength of affinity.
Experimental
Organic syntheses
General methods. Unless otherwise indicated, all starting materials were obtained from commercial suppliers (Sigma- Aldrich, Fluka, Merck, Alfa Aesar, Reanal, Molar Chemicals, Fluorochem) and used without further purification. The fluorogenic dyes (11–15) were prepared as described pre- viously. Analytical thin-layer chromatography (TLC) was per- formed on silica gel 60 F254 precoated aluminium TLC plates from Merck. Visualization of TLC samples was performed using a 254/365 nm UV lamp and/or KMnO4 stain. Column chromatography was carried out with silica gel (0.06–0.2 mm) purchased from Zeochem. Ratios of the solvents for the eluents are given in volumes (mL/mL). Flash column chrom- atography was performed on a CombiFlash Rf+System (Teledyne ISCO, Lincoln, NE, USA). NMR spectra were recorded on Varian Inova 500 MHz and Varian 600 MHz NMR spec- trometers. Chemical shifts (δ) are given in parts per million ( ppm) using solvent signals as the reference. Coupling con- stants (J) are reported in hertz (Hz). Splitting patterns are designated as s (singlet), d (doublet), t (triplet), qr (quadru- plet), qv (quintuplet), m (multiplet), dd (doublet of a doublet), td (triplet doublet), dt (doublet triplet), and brs (broad singlet). The exact masses were determined using an Agilent 6230 time-of-flight mass spectrometer. All melting points were measured on an OptiMelt Automated Melting Point System and are uncorrected.
Synthesis of tert-butyl (2-(2-hydroxyethoxy)ethyl)carbamate (2). To a solution of 2-(2-aminoethoxy-ethan-1-ol) (1.04 mL;
10.37 mmol) in CH2Cl2 (60 mL) di-tert-butyl-dicarbonate (2.26 g; 10.37 mmol) was added, and the reaction mixture was stirred at room temperature for 18 h. After the evaporation of the solvent the crude product was purified by silica gel column chromatography (hexane/ethyl acetate = 1/3) to yield 2.05 g product as a colorless oil (96%).Rf= 0.29 (hexane/ethyl acetate
= 1/1). 1H NMR (500 MHz, CDCl3) δ 3.71–3.68 (m, 2H), 3.55–3.50 (m, 4H), 3.29 (t, J = 5.1 Hz, 2H), 1.41 (s, 9H). 13C NMR (126 MHz, CDCl3) δ 156.3, 79.5, 72.4, 70.4, 61.8, 40.6, 28.5 (Fig. S16†). HRMS: [M + Na]+calcd for [C9H19NO4Na+]m/z 228.1212, foundm/z228.1211.
2-(2-((tert-Butoxycarbonyl)amino)ethoxy)ethyl 4-methyl- benzenesulfonate (3).A solution of2(2.05 g; 10 mmol) and tri- ethylamine (4.9 mL; 35 mmol) in CH2Cl2(25 mL) was cooled to 0 °C.p-Toluenesulfonyl chloride (5.72 g; 30 mmol) dissolved in CH2Cl2 (10 mL) was added and the reaction mixture was allowed to warm to room temperature and stirred for 18 hours.
Solids were filtered out and the filtrate was washed with 10%
citric acid (3 × 100 mL) and brine (1 × 100 mL) and dried over MgSO4. After filtration the solvent was removedin vacuoand the crude product was purified by silica gel column chromato- graphy (hexane/ethyl acetate = 3/1) to yield 6.13 g (68%) of a colorless oil. Rf = 0.54 (hexane/ethyl acetate = 1/1). 1H NMR (500 MHz, CDCl3)δ7.79 (d,J= 8.2 Hz, 2H), 7.34 (d,J= 8.0 Hz, 2H), 4.78 (s, 1H), 4.16–4.13 (m, 2H), 3.63–3.60 (m, 2H), 3.43 (t, J = 5.1 Hz, 2H), 3.22 (t,J = 4.8 Hz, 2H), 2.43 (s, 3H), 1.43 (s, 9H). 13C NMR (126 MHz, CDCl3)δ 156.0, 145.0, 133.2, 129.9, 128.1, 79.5, 70.5, 69.2, 68.5, 40.4, 28.5, 21.7 (Fig. S17†). HRMS:
[M + Na]+calcd for [C16H25NO6SNa]+m/z382.1300, foundm/z 382.1296.
Synthesis of ethyl 4-(2-(2-((tert-butoxycarbonyl)-amino) ethoxy)ethoxy)benzoate (4). Ethyl 4-hydroxybenzoate (0.92 g, 5.54 mmol), compound3(2.00 g, 5.54 mmol) and dry K2CO3
(2.30 g, 16.62 mmol) were dissolved in anhydrous DMF (20 mL) under a N2atmosphere and stirred overnight at 60 °C.
After cooling down the reaction mixture was diluted with 80 mL CH2Cl2and washed with 3 × 80 mL water, 80 mL brine and dried over MgSO4. After evaporation of the solvent the crude product was purified by silica gel column chromato- graphy with hexane/ethyl acetate = 10/1–1/1 to yield 1.94 g (99%) product as white crystals.Rf= 0.67 (hexane/ethyl acetate
= 1/1). Mp = 48–52 °C.1H NMR (500 MHz, CD3OD):δ8.03 (d, J= 8.9 Hz, 2H), 7.09 (d,J= 8.9 Hz, 2H), 4.40 (q,J= 7.1 Hz, 2H), 4.29–4.26 (m, 2H), 3.92–3.89 (m, 2H), 3.65 (t,J = 5.7 Hz, 2H), 3.32 (t,J= 5.6 Hz, 2H), 1.50 (s, 9H), 1.44 (t,J= 7.1 Hz, 3H).13C NMR (126 MHz, CDCl3) δ 166.5, 162.5, 133.0, 131.7, 123.4, 114.3, 110.2, 70.7, 69.4, 67.6, 60.8, 57.8, 28.6, 14.5 (Fig. S18†).
HRMS: [M + Na]+ calcd for [C18H27NO6Na]+ m/z 376.1736, foundm/z376.1735.
Synthesis oftert-butyl (2-(2-(4-(hydrazinecarbonyl)phenoxy)- ethoxy)ethyl)carbamate (5). In a round-bottomed flask 4 (1.92 g; 5.44 mmol) and hydrazine monohydrate (792 µL;
16.32 mmol) were heated under reflux for 30 min. Then ethanol was added (1.3 mL) and the mixture was stirred at the reflux temperature for 6 hours. After evaporation of the solvent the residue was purified by silica gel column chromatography (ethyl acetate/MeOH = 20/1) to give5as a colorless oil (1.83 g, 99%). Rf = 0.31 (ethyl acetate/MeOH = 20/1). 1H NMR (500 MHz, DMSO-d6):δ7.82 (d,J= 8.6 Hz, 2H), 7.14 (d,J= 8.8 Hz, 2H), 6.75 (t,J= 5.3 Hz, 1H), 4.21–4.17 (m, 2H), 3.77–3.73 (m, 2H), 3.46 (t,J= 6.0 Hz, 2H), 3.09 (q,J= 6.0 Hz, 2H), 1.37 (s, 9H). 13C NMR (126 MHz, CDCl3)δ 168.2, 161.7, 156.1, 128.9, Open Access Article. Published on 19 June 2018. Downloaded on 1/17/2019 11:50:24 AM. This article is licensed under a Creative Commons Attribution-NonCommercial 3.0 Unported Licence.
125.2, 114.6, 70.6, 69.3, 67.6, 50.7, 40.4, 28.5 (Fig. S19†).
HRMS: [M + H]+ calcd for [C16H26N3O5]+m/z340.1872, found m/z340.1863.
Synthesis oftert-butyl (2-(2-(4-(5-mercapto-1,3,4-oxadiazol-2- yl)phenoxy)ethoxy)ethyl)carbamate (6). To a solution of 5 (2.00 g, 5.88 mmol) in ethanol (14 mL) carbon disulfide (2.34 mL, 38.81 mmol) and KOH (330 mg, 5.88 mmol) were added and the solution was stirred at 85 °C overnight. After cooling to room temperature, the mixture was diluted with ethyl acetate (100 mL) and washed with 1 M HCl (2 × 80 mL) and brine (100 mL) and dried over MgSO4. The crude product was purified by silica gel column chromatography (hexane/
ethyl acetate = 2/1–1/9) to yield 1.95 g (87%) of a white solid.
Rf= 0.57 (hexane/ethyl acetate = 1/9). Mp = 76–82 °C.1H NMR (500 MHz, CDCl3):δ12.51 (s, 1H), 7.75 (d,J= 8.1 Hz, 2H), 6.95 (d,J= 8.6 Hz, 2H), 5.21 (s, 1H), 4.23–4.14 (m, 2H), 3.87 (d,J= 4.0 Hz, 2H), 3.66 (t,J= 5.0 Hz, 2H), 3.39 (s, 2H), 1.45 (s, 9H).
13C NMR (126 MHz, CDCl3)δ177.8, 161.8, 156.5, 128.9, 128.2, 116.3, 115.1, 70.4, 69.2, 67.5, 40.3, 28.4, 11.4 (Fig. S20†).
HRMS: [M + Na]+ calcd for [C17H23N3O5SNa]+ m/z 404.1256, foundm/z404.1263.
Synthesis of tert-butyl (2-(2-(4-(5-(methylthio)-1,3,4-oxadi- azol-2-yl)phenoxy)ethoxy)ethyl)carbamate (7). Compound 6 (3.03 g, 7.93 mmol) was dissolved in THF (50 mL) and cooled to 0 °C. Then CH3I (592 µL, 9.52 mmol) and Et3N (1.33 mL, 9.52 mmol) were added and the mixture was stirred for 2 h at room temperature. After evaporation of the solvent ethyl acetate was added (200 mL) and the mixture was extracted with water (3 × 100 mL). The water phase was washed with ethyl acetate (2 × 100 mL). The combined organic phase was washed with brine (200 mL) and dried over MgSO4. The crude product was dissolved in Et2O (10 mL), and hexane was added drop- wise. The solvents were removed using a pipette from the pale yellow oil formed and it was washed again. After evaporation to dryness the product appeared as a white solid (3.14 g; 90%).
Rf = 0.76 (ethyl acetate/methanol = 9/1); 0.25 (hexane/ethyl acetate = 1/1). Mp = 42–44 °C.1H NMR (500 MHz, CDCl3): δ 7.91 (d,J = 8.9 Hz, 2H), 7.00 (d,J = 8.9 Hz, 2H), 4.96 (s, 1H), 4.18–4.14 (m, 2H), 3.85–3.81 (m, 2H), 3.60 (t,J = 5.1 Hz, 2H), 3.33 (d, J = 4.8 Hz, 2H), 2.74 (s, 3H), 1.42 (s, 9H). 13C NMR (126 MHz, CDCl3): δ 165.8, 164.4, 161.5, 156.1, 128.5, 116.6, 115.2, 79.4, 70.6, 69.4, 67.7, 40.4, 28.5, 14.8 (Fig. S21†). HRMS:
[M + H]+ calcd for [C18H26N3O5S+] m/z 396.1583, found m/z 396.1593.
Synthesis of tert-butyl (2-(2-(4-(5-(methylsulfonyl)-1,3,4-oxa- diazol-2-yl)phenoxy)ethoxy)ethyl)carbamate (8). Compound 7 (1.98 mg, 5.0 mmol) was dissolved in CH2Cl2 (40 mL), and cooled to 0 °C.mCPBA (70 wt%; 3.19 g; 18.5 mmol) was added and the mixture was stirred at room temperature overnight.
After filtration of the insoluble material the solvent was evap- orated, and the residue was purified by silica gel column chromatography (hexane/ethyl acetate = 2/1–ethyl acetate/
MeOH = 9/1) which gave the title compound8(1.77 g, 84%) as a white solid. Rf = 0.25 (hexane/ethyl acetate = 1/1). Mp = 118–120 °C. 1H NMR (500 MHz, DMSO-d6):δ 8.03 (d,J = 8.8 Hz, 2H), 7.21 (d, J= 8.8 Hz, 2H), 6.76 (s, 1H), 4.26–4.19 (m,
2H), 3.79–3.74 (m, 2H), 3.69 (s, 3H), 3.47 (t,J = 6.0 Hz, 2H), 3.10 (q, J = 5.8 Hz, 2H), 1.37 (s, 9H). 13C NMR (126 MHz, DMSO-d6): δ 165.7, 162.2, 161.6, 155.6, 142.0, 129.4, 115.5, 114.2, 77.5, 69.3, 68.4, 67.6, 42.9, 28.2 (Fig. S22†). HRMS:
[M + Na]+calcd for [C18H25N3O7SNa]+m/z450.1311, foundm/z 450.1315.
Synthesis of 2-(2-(4-(5-(methylsulfonyl)-1,3,4-oxadiazol-2-yl) phenoxy)ethoxy)ethan-1-aminium 2,2,2-trifluoroacetate (9).To a solution of compound 8 (269 mg, 0.63 mmol) in CH2Cl2
(5 mL), H2O (20 µL) and TFA (1 mL) were added and the mixture was stirred for 1 h at room temperature. After com- pletion of the reaction (checked by TLC) the solvents were evaporated using N2and the crude product was washed with Et2O (3 × 3 mL). The product precipitates as off-white crystals (240 mg, 80%). Mp = 146–148 °C.1H NMR (500 MHz, CD3OD):
δ8.09 (d,J= 8.8 Hz, 2H), 7.19 (d,J= 8.8 Hz, 2H), 4.35–4.29 (m, 2H), 3.99–3.96 (m, 2H), 3.86–3.83 (m, 2H), 3.59 (s, 3H), 3.35 (s, 1H), 3.21 (t, J = 4.8 Hz, 2H). 13C NMR (126 MHz, CD3OD)δ 168.0, 164.2, 163.5, 130.7, 116.5, 116.0, 70.6, 69.0, 68.1, 43.3, 40.7 (Fig. S23†). HRMS: [M]+ calcd for [C13H18N3O5S]+ m/z 328.0967, foundm/z328.0962.
Synthesis of bicyclo[6.1.0]non-4-yn-9-ylmethyl (2-(2-(4-(5- (methylsulfonyl)-1,3,4-oxadiazol-2-yl)phenoxy)ethoxy)ethyl)- carbamate (10).Compound 9(30 mg; 0.07 mmol) and EDIPA (35 μL; 0.20 mmol) were dissolved in CH2Cl2 (4 mL) and cooled to 0 °C. BCN–succinimidyl carbonate (24 mg;
0.08 mmol) was added and stirred for 3 h at room tempera- ture. After evaporation of the solvent the residue was purified by flash chromatography using CH2Cl2/MeOH = 100/1–30/1 to yield the product (13 mg; 37%) as a colorless oil. Rf = 0.35 (CH2Cl2/MeOH = 30/1). 1H NMR (500 MHz, CDCl3) δ8.06 (d, J= 8.9 Hz, 2H), 7.06 (d,J= 8.9 Hz, 2H), 5.06 (s, 1H), 4.22–4.19 (m, 2H), 4.14 (d,J= 8.0 Hz, 2H), 3.87–3.83 (m, 2H), 3.64 (t,J= 5.1 Hz, 2H), 3.50 (s, 3H), 3.40 (dd, J = 10.5, 5.2 Hz, 2H), 2.34–2.12 (m, 6H), 1.59–1.51 (m, 2H), 1.40–1.30 (m, 1H), 0.93 (t,J= 9.7 Hz, 2H).13C NMR (126 MHz, CDCl3)δ162.9, 161.8, 156.9, 129.8, 128.9, 115.6, 114.8, 98.9, 70.6, 69.4, 67.9, 63.0, 53.9, 43.1, 29.2, 21.6, 20.3, 17.9 (Fig. S24†). HRMS: [M + H]+ calcd for [C24H30N3O7S]+m/z504.1804, foundm/z504.1797.
Peptide synthesis and protein expression and purification PepMK2. The peptide was synthesized using a standard Fmoc-SPPS protocol. It was synthesized on Rink Amid MBHA resin (Protein Technologies, Inc.) using a peptide synthesizer (PS3, Protein Technologies, Inc.). Coupling reactions used Fmoc-L-amino acid/HBTU/NMM (5/4/10 eq.) in DMF ( peptide synthesis grade). A cleaving solution of 5 mL of TFA/H2O/TIS (95/2.5/2.5% v/v) was added to the resin, and mixed for 2 h.
The crude peptide was purified using semi-preparative HPLC (Jupiter 10 µm C18 300 Å, LC Column 250 × 10 mm;
Phenomenex, Torrance, CA, USA).
MK2 protein. The cDNA of the MK2 human protein DNA construct containing residues between 41 and 400 was cloned into a modified pET expression vector. cDNA encoding the MK2 construct was produced from HEK293 derived mRNA.
The MK2 construct was expressed in Escherichia coli Rosetta
Organic & Biomolecular Chemistry Paper
Open Access Article. Published on 19 June 2018. Downloaded on 1/17/2019 11:50:24 AM. This article is licensed under a Creative Commons Attribution-NonCommercial 3.0 Unported Licence.
View Article Online
(DE3) pLysS (Novagen) cells. The expressed MK2 construct con- tained an N-terminal cleavable GST-tag and a C-terminal uncleavable hexahistidine-tag. Protein purification involved two steps: Ni- and then GST-affinity chromatography. The GST tag was removed by tobacco etch virus protease. Finally, the MK2 protein was purified again by Ni-affinity chromatography to remove the cleaved GST.
p38C162S protein. The protein expression was carried out according to our previously reported procedure.23
Conjugation processes
Conjugation of model proteins and fluorescent linkers. In the case of p38C162S, 60 µM protein and 120 µM linker10were mixed and incubated for 10 minutes at room temperature in the dark in PBS buffer ( pH 7.4). In the second step, an appro- priate dye (11–15) was added in 240 µM concentration for 10 min, too. The excess reagents were removed by using a SpinPrep column (Sigma, St Louis, MO, USA) filled with Sephadex G-25 “Fine” desalting gel (Pharmacia Fine Chemicals, Sweden). In the case of MK2, 60 µM protein and 120 µM linker10were mixed and incubated for 10 minutes at room temperature in the dark in PBS buffer ( pH 7.4) com- pleted with additional 160 mM NaCl, 0.1% IGEPAL and 400 µM TCEP. In the second step dye12was added. The excess reagents were removed by using a SpinPrep column filled with Sephadex G-25“Fine”desalting gel.
Fluorescent conjugation of pepMK2.500 µM peptide, 1 mM TCEP and 3 mM of compound [10 + 12] were mixed and incu- bated for 1 hour at room temperature in the dark in 50 mM HEPES buffer ( pH 8.0). It was purified by HPLC (Phenomenex Jupiter 10 µm Proteo C18 90 Å, LC Column 250 × 10 mm) using H2O + 0.1% TFA as eluent A and CH3CN + 0.1% TFA as eluent B and the product was lyophilized.
SDS polyacrylamide gel electrophoresis. The samples were diluted with a sample buffer (250 mM Tris-HCl ( pH 6.8) + 10%
SDS + 40% glycerol + 0.02% bromophenol blue + 400 mM DTT) in a 3 : 1 ratio. The size of the polyacrylamide gels was 8.5 cm × 7.5 cm × 0.1 cm. They were the combination of 4%
concentration and 10% separation PAGE gels (acrylamide/
bisacrylamide ratio was 29/1; and concentration gel buffer was 125 mM Tris-HCl + 0.1% SDS ( pH 6.8) and the separation gel buffer was 375 mM Tris-HCl + 0.1% SDS ( pH 8.8)). 7.5 µg of protein was loaded per lane. A Prestained PAGERuler Plus (Thermo Fisher Scientific) was applied as the molecular weight standard. Separations were carried out in a Mini-Protean Tetra Cell (Bio-Rad, Hercules, CA, USA) using 25 mM Tris/192 mM glycine + 0.1% SDS ( pH 8.3) as the running buffer and 180 V voltage for 40 min at 25 °C. The gels were documented by using a Typhoon Trio Imaging System (GE Healthcare, Uppsala, Sweden). Furthermore, the gels were stained for pro- teins with Coomassie Brilliant-Blue.
FRET measurements
The labeled p38C162Ssamples were prepared in 1.0 µM concen- tration in PBS ( pH 7.4) buffer. The labeled MK2 peptide and protein samples were prepared in 16, 8, 4, 2, 1, 0.5, 0.25, 0.125,
0.0625, and 0.03125 µM concentrations for the titration. From the appropriate solutions 10 + 10 µL were transferred into the wells. The FRET interactions between the two labeled partners were monitored based on the generation of the fluorescence signal (λex: 420 nm;λem: 450–700 nm) by using a PerkinElmer Enspire Multimode Reader (PerkinElmer Inc.; Waltham, MA, USA) in a 384-well round bottom black plate (Corning, Corning, NY, USA) at room temperature with 100 flashes per point. Data were acquired and handled by Corning Enspire Manager 4.10 software.
Con fl icts of interest
There are no conflicts to declare.
Acknowledgements
The help of Gábor Glatz with SDS-PAGE gel imaging is greatly acknowledged. The present work was supported by the Hungarian Scientific Research Fund (OTKA-NN-116265), the
“Lendület”Programme of the Hungarian Academy of Sciences (LP2013-55/2013) and the National Research, Development and Innovation Office, Hungary (VEKOP-2.3.3.-15-20016- 00011).
References
1 T. Berggård, S. Linse and P. James, Proteomics, 2007, 7, 2833–2842.
2 Y. Yang, H. Liu and X. Yao, Mol. BioSyst., 2012, 8, 2106–2118.
3 Y. Song, V. G. J. Rodgers, J. S. Schultz and J. Liao, Biotechnol. Bioeng., 2012,109, 2875–2883.
4 E. M. Phizicky and S. Fields,Microbiol. Rev., 1995,59, 94– 123.
5 T. K. Kerppola,Annu. Rev. Biophys., 2008,37, 465–487.
6 K. E. Miller, Y. Kim, W. Huh and H. Park, J. Mol. Biol., 2015,427, 2039–2055.
7 S. Xing, N. Wallmeroth, K. W. Berendzen and C. Grefen, Plant Physiol., 2016,171, 727–758.
8 D. W. Piston and G. J. Kremers,Trends Biochem. Sci., 2007, 32, 407–414.
9 H. Sahoo,J. Photochem. Photobiol., C, 2011,12, 20–30.
10 G. Zhang, S. Zheng, H. Liuc and P. R. Chen, Chem. Soc.
Rev., 2015,44, 3405–3417.
11 N. Krall, F. P. da Cruz, O. Boutureira and G. J. Bernardes, Nat. Chem., 2016,8, 103–113.
12 X. Chen and Y.-W. Wu, Org. Biomol. Chem., 2016, 14, 5417–5439.
13 S. B. Gunnoo and A. Madder, ChemBioChem, 2016, 17, 529–553.
14 J. M. Chalker, G. J. L. Bernardes, Y. A. Lin and B. G. Davis, Chem.–Asian J., 2009,4, 630–640.
Open Access Article. Published on 19 June 2018. Downloaded on 1/17/2019 11:50:24 AM. This article is licensed under a Creative Commons Attribution-NonCommercial 3.0 Unported Licence.
15 A. D. Baldwin and K. L. Kiick,Bioconjugate Chem., 2011,22, 1946–1953.
16 G. B. Cserép, Zs. Baranyai, D. Komáromy, K. Horváti, Sz. Bősze and P. Kele,Tetrahedron, 2014,70, 5961–5965.
17 C. E. Hoyle and C. N. Bowman, Angew. Chem., Int. Ed., 2010,49, 1540–1573.
18 S. van Kasteren,Biochem. Soc. Trans., 2012,40, 929–944.
19 A. M. Spokoyny, Y. Zou, J. J. Ling, H. Yu, Y.-S. Lin and B. L. Pentelute,J. Am. Chem. Soc., 2013,135, 5946–5949.
20 A. Abbas, B. Xing and T. P. Loh, Angew. Chem., Int. Ed., 2014,53, 74914–77494.
21 J. M. Chalker, G. J. L. Bernardes and B. G. Davis,Acc. Chem.
Res., 2011,44, 730–741.
22 S. P. S. Koo, M. M. Stamenovic, R. A. Prasath, A. J. Inglis, F. E. Du Prez, C. Barner-Kowollik, W. van Camp and T. Junkers, J. Polym. Sci., Part A: Polym. Chem., 2010, 48, 1699–1713.
23 J. Morales-Sanfrutos, J. Lopez-Jaramillo, M. Ortega-Muñoz, A. Megia-Fernandez, F. Perez-Balderas, F. Hernandez-Mateo and F. Santoyo-Gonzalez, Org. Biomol. Chem., 2010, 8, 667–675.
24 N. Toda, S. Asano and C. F. Barbas III,Angew. Chem., Int.
Ed., 2013,52, 12592–12596.
25 Á. Garai, A. Zeke, G. Gógl, I. Törő, F. Fördős, H. Blankenburg, T. Bárkai, J. Varga, A. Alexa, D. Emig, M. Albrecht and A. Reményi,Sci. Signaling, 2012,5, ra74.
26 B. Söveges, T. Imre, T. Szende, Á. L. Póti, G. B. Cserép, T. Hegedűs, P. Kele and K. Németh, Org. Biomol. Chem., 2016,14, 6071–6078.
27 R. Petrovics, B. Söveges, A. Egyed, G. Knorr, A. Kormos, T. Imre, Gy. Török, A. Zeke, É. Kocsmár, G. Lotz, P. Kele and K. Németh,Org. Biomol. Chem., 2018,16, 2997– 3005.
28 G. Knorr, E. Kozma, J. M. Schaart, K. Németh, G. Török and P. Kele,Bioconjugate Chem., 2018,29, 1312–1318.
29 P. Kele, X. Li, M. Link, K. Nagy, A. Herner, K. Lőrincz, Sz. Béni and O. S. Wolfbeis,Org. Biomol. Chem., 2009, 7, 3486–3490.
30 K. Nagy, E. Orbán, Sz. Bősze and P. Kele, Chem.–Asian J., 2010,5, 773–777.
31 A. White, C. A. Pargellis, J. M. Studts, B. G. Werneburg and B. T. Farmer II, Proc. Natl. Acad. Sci. U. S. A., 2007,104, 6353–6358.
32 S. M. Lukas, R. R. Kroe, J. Wildeson, G. W. Peet, L. Frego, W. Davidson, R. H. Ingraham, C. A. Pargellis, M. E. Labadia and B. G. Werneburg,Biochemistry, 2004,43, 9950–9960.
Organic & Biomolecular Chemistry Paper
Open Access Article. Published on 19 June 2018. Downloaded on 1/17/2019 11:50:24 AM. This article is licensed under a Creative Commons Attribution-NonCommercial 3.0 Unported Licence.
View Article Online