Contents lists available atScienceDirect
Neurobiology of Disease
journal homepage:www.elsevier.com/locate/ynbdi
Proteomic signatures of brain regions affected by tau pathology in early and late stages of Alzheimer's disease
Clarissa Ferolla Mendonça
a,b, Magdalena Kuras
c, Fábio César Sousa Nogueira
a,d, Indira Plá
c, Tibor Hortobágyi
e,f,g, László Csiba
e,h, Miklós Palkovits
i, Éva Renner
i, Péter Döme
j,k,
György Marko-Varga
c, Gilberto B. Domont
a,⁎, Melinda Rezeli
c,⁎aProteomics Unit, Department of Biochemistry, Federal University of Rio de Janeiro, Rio de Janeiro, Brazil
bGladstone Institute of Neurological Disease, San Francisco, USA
cDivision of Clinical Protein Science & Imaging, Department of Clinical Sciences (Lund) and Department of Biomedical Engineering, Lund University, Lund, Sweden
dLaboratory of Proteomics, LADETEC, Institute of Chemistry, Federal University of Rio de Janeiro, Rio de Janeiro, Brazil
eMTA-DE Cerebrovascular and Neurodegenerative Research Group, University of Debrecen, Debrecen, Hungary
fInstitute of Pathology, Faculty of Medicine, University of Szeged, Szeged, Hungary
gCentre for Age-Related Medicine, SESAM, Stavanger University Hospital, Stavanger, Norway
hDepartment of Neurology, Faculty of Medicine, University of Debrecen, Debrecen, Hungary
iSE-NAP – Human Brain Tissue Bank Microdissection Laboratory, Semmelweis University, Budapest, Hungary
jDepartment of Psychiatry and Psychotherapy, Semmelweis University, Budapest, Hungary
kNational Institute of Psychiatry and Addictions, Nyírő Gyula Hospital, Budapest, Hungary
A R T I C L E I N F O Keywords:
Alzheimer's disease Proteomics
Brain region vulnerability Medial temporal lobe Neocortex Braak/Braak staging
A B S T R A C T
Background:Alzheimer's disease (AD) is the most common neurodegenerative disorder. Depositions of amyloid β peptide (Aβ) and tau protein are among the major pathological hallmarks of AD. Aβ and tau burden follows predictable spatial patterns during the progression of AD. Nevertheless, it remains obscure why certain brain regions are more vulnerable than others; to investigate this and dysregulated pathways during AD progression, a mass spectrometry-based proteomics study was performed.
Methods:In total 103 tissue samples from regions early (entorhinal and parahippocampal cortices - medial temporal lobe (MTL)) and late affected (temporal and frontal cortices - neocortex) by tau pathology were subjected to label-free quantitative proteomics analysis.
Results:Considering dysregulated proteins during AD progression, the majority (625 out of 737 proteins) was region specific, while some proteins were shared between regions (101 proteins altered in two areas and 11 proteins altered in three areas). Analogously, many dysregulated pathways during disease progression were exclusive to certain regions, but a few pathways altered in two or more areas. Changes in protein expression indicate that synapse loss occurred in all analyzed regions, while translation dysregulation was preponderant in entorhinal, parahippocampal and frontal cortices. Oxidative phosphorylation impairment was prominent in MTL. Differential proteomic analysis of brain areas in health state (controls) showed higher metabolism and increased expression of AD-related proteins in the MTL compared to the neocortex. In addition, several proteins that differentiate brain regions in control tissue were dysregulated in AD.
Conclusions:This work provides the comparison of proteomic changes in brain regions affected by tau pathology at different stages of AD. Although we identified commonly regulated proteins and pathways during disease advancement, we found that the dysregulated processes are predominantly region specific. In addition, a distinct proteomic signature was found between MTL and neocortex in healthy subjects that might be related to AD
https://doi.org/10.1016/j.nbd.2019.104509
Received 27 December 2018; Received in revised form 17 May 2019
Abbreviations:AD, Alzheimer's disease; EC, Entorhinal cortex; PHC, Parahippocampal cortex; TC, Temporal cortex; FC, Frontal cortex; MTL, Medial temporal lobe;
NFT, Neurofibrillary tangles; Aβ, Amyloid β peptide; CBD, Corticobasal degeneration; PSP, Progressive supranuclear palsy; DEP, Differentially expressed protein;
AMBIC, Ammonium-bicarbonate; DTT, Dithiothreitol; IAA, Iodoacetamide; TFA, Trifluoroacetic acid
⁎Corresponding authors at: Gilberto B. Domont, Proteomics Unit, Department of Biochemistry, Federal University of Rio de Janeiro, Rio de Janeiro, Brazil; Melinda Rezeli, Division of Clinical Protein Science & Imaging, Department of Clinical Sciences (Lund) and Department of Biomedical Engineering, Lund University, Lund, Sweden.
E-mail addresses:gilbertodomont@gmail.com(G.B. Domont),melinda.rezeli@bme.lth.se(M. Rezeli).
Available online 15 June 2019
0969-9961/ © 2019 Elsevier Inc. All rights reserved.
T
vulnerability. These findings highlight the need for investigating AD's cascade of events throughout the whole brain and studies spanning more brain areas are required to better understand AD etiology and region vulner- ability to disease.
1. Introduction
Alzheimer's disease (AD) is the most prevalent neurodegenerative disorder and also the major cause of dementia (60–80% cases) (Alzheimer's Association, A. S, 2017). Major hallmarks of AD are loss of synapses, neuronal death and deposition of extracellular amyloid β peptide (Aβ) and intracellular hyperphosphorylated tau protein (Masters et al., 2015). During AD progression Aβ and tau aggregates spread through the brain, following predictable patterns (Braak and Braak, 1991;Thal et al., 2002). Tau deposition was classified into six neuropathological stages designated as Braak/Braak (B/B) stages (Braak and Braak, 1991). During B/B I-II, tau inclusions are restricted to the transentorhinal and entorhinal cortices. They disseminate into the limbic system during B/B III-IV with the mild engagement of the hip- pocampus (CA1–4), parts of the frontal and temporal neocortices and the amygdala. The final stages, B/B V-VI, are distinguished by the de- struction of the neocortex by protein inclusions (Hyman et al., 2012).
There is a correlation between cognitive impairment and the number of neuritic plaques (Aβ plaques) in the neocortex, but cortical tau neuro- fibrillary tangles (NFT) burden correlates better with cognitive decline (Nelson et al., 2007).
Since AD progressively affects distinct brain regions, many studies compared the changes that occur in different regions, trying to eluci- date which processes make an area more vulnerable than another one (Martin et al., 2008;Schonberger et al., 2001;Xu et al., 2019;Zahid et al., 2014). Other authors focused on the temporal advancement of AD by investigating changes that occur in one brain area at different dis- ease stages (Bossers et al., 2010;Hondius et al., 2016;Kim et al., 2018;
Lachén-Montes et al., 2017; Lau et al., 2013; Sultana et al., 2010;
Triplett et al., 2016; Zelaya et al., 2015). Both strategies were also merged through transcriptomic/proteomic investigation of brain areas considering distinct disease stages (Matarin et al., 2015; McKetney et al., 2019;Miyashita et al., 2014;Savas et al., 2017;Seyfried et al., 2017).
Although many works have profiled molecular alterations in the AD brain, a large human study investigating proteomic changes at different B/B stages in brain areas vulnerable and resilient to tau pathology is still lacking. With the aim to map proteome dysregulation during AD progression in brain regions with distinct susceptibility to neurode- generation and to investigate which processes make some brain areas more vulnerable to AD, we performed quantitative proteome profiling of 103 human brain samples from regions affected by tau pathology already in the early (medial temporal lobe (MTL)) or only the late stages of AD (neocortex).
2. Methods 2.1. Patient cohort
A total of 103 postmortem human brain samples from 4 distinct brain regions (entorhinal cortex (Brodmann areas 28 and 34), para- hippocampal cortex (posterior two thirds of the parahippocampal gyrus), temporal cortex (Brodmann area 21) and frontal cortex (Brodmann area 10)) were acquired from the Human Brain Tissue Bank (Semmelweis University, Budapest, Hungary). All brains were diag- nosed by a neuropathologist according to the standard diagnostic cri- teria as described previously (Skogseth et al., 2017). In brief, the neu- ropathological diagnosis of AD was established when AD-type tau pathology was present in forms of neurofibrillary tangles, neuropil threads and Alzheimer's type (neuritic) plaques with coexisting
characteristic amyloid beta pathology. The probability of AD is based on tau Braak & Braak (B/B) stage. Pure AD cases have been selected, i.e.
brains without significant coexisting non-AD pathologies such as FTLD- tau, PSP, CBD. Cases were classified according to tau pathology (B/B stages) into controls (negative or minimal age-related tau pathology) and B/B stages (I, II, III, IV, V and VI) (Table S1). The work has been carried out in accordance with the Declaration of Helsinki. Brains were donated under informed written consent.
2.2. Microdissection procedure
After dissecting the whole brain from the skull, the leptomeninges were first removed from the surface of the brain. Subsequently, the cortex with the diencephalon was separated from the lower brainstem/
cerebellum by a knife cut through the midbrain. Then, the cortex was sliced at the coronal level from the frontal pole with 1.5–2.0 cm thick sections. Each section (generally 11–12 from the whole brain) was immediately frozen individually on dry ice powder, covered in alu- minum foil and stored at −70 °C. During the microdissection of the cortical samples, each frozen coronal section was further cut into 1–2 mm thin sections and the cortical areas were dissected out by the
“micropunch technique” (Palkovits, 1973) using special micropunch needles with various (0.5–3.0 mm) inside diameters according to the size of the cortical areas or regions to be dissected. The microdissected tissue pellets were collected in 1.5 ml Eppendorf tubes and kept until use at −70 °C. During each step of the microdissection procedure, the brain slices and samples were kept frozen. For the present study, sam- ples were taken from the entorhinal and parahippocampal cortex, the temporal cortex represented by micropunches from the middle tem- poral gyrus, and the frontal cortex by samples from the superior frontal gyrus.
2.3. Reagents
All reagents used were acquired from Sigma-Aldrich unless speci- fied. Organic solvents and water with LC-MS quality were bought from Merck.
2.4. Protein extraction and digestion
The microdissected frozen tissue samples were sectioned at −20 °C using a cryostat to obtain 10 μm slices (20–60 slices per sample) and samples were stored at −80 °C until further usage. 200 μL of lysis buffer (7 M urea, 2 M thiourea, 50 mM Tris pH 7.4, MS-SAFE protease in- hibitor) was added to each microcentrifuge tube containing the tissue slices. Samples were vortexed and then sonicated on ice (Digital Branson Sonicator SFX 150): 20% amplitude, pulsed mode (9 pulses with 10 s each and intervals of 10 s between each pulse). Lysates were centrifuged at 21,000 xgat 4 °C for 30 min (Eppendorf Nordic A/S) and the supernatant was transferred to a new tube to avoid cell debris. Prior to digestion, protein quantification was done using the Bradford 96 well plate assay, according to the manufacturer instructions.
Protein digestion was carried out using a modified Filter Aided Sample Preparation (FASP) protocol (Wisniewski et al., 2009). 100 μg protein was used for digestion. Reduction of disulfide bonds was per- formed by the addition of 50 mM dithiothreitol (DTT) to the lysates that were then incubated for 1 h at 30 °C. The samples were then transferred to 30 kDa Microcon filters (Merck Millipore) connected to collection tubes. 200 μL of U/Tris buffer (8 M Urea in 0.1 M Tris-HCl pH 8.5) was added and the filter units were centrifuged at 12,000 xgfor 15 min at
room temperature. For alkylation of the cysteine residues, 50 μL of 50 mM iodoacetamide (IAA) in U/Tris buffer was added to the samples and the reaction was incubated in dark for 20 min at room temperature.
IAA was then removed from the samples by filtration at 12,000 x g for 15 min. After that, 100 μL of U/Tris buffer was added to the filters and another centrifugation step with the same conditions was carried out.
Prior to digestion U/Tris buffer was replaced to ammonium bicarbonate buffer (AMBIC) by the addition of 100 μL of 50 mM AMBIC, followed by centrifugation 12,000 xgfor 15 min. This step was repeated 4 times.
Filters containing the proteins were transferred to new collection tubes and 50 μL of 0.04 μg/uL sequencing grade modified trypsin (1:50 en- zyme: protein ratio, Promega Biotech AB, Madison, WI) in AMBIC was added to each sample. Following overnight digestion at 37 °C, the peptides were collected by centrifugation at 12,000 xgfor 15 min. Two elution steps were carried out by the addition of 100 uL of AMBIC, followed by centrifugation. Formic acid was added to a final con- centration of 0.5%. Peptides were dried with speed vacuum cen- trifugation, then resuspended in 100 μL of 0.1% trifluoroacetic acid (TFA) and finally desalted by reversed phase chromatography using C18 spin columns (MacroSpin Columns®, The Nest Group Inc.). After desalting, tryptic peptides were dried and resuspended in 50 μL of 0.1%
formic acid. Prior to injection onto the mass spectrometer, peptides were quantified using the Pierce Quantitative Colorimetric Peptide Assay (Thermo Fisher Scientific, Rockford, lL).
2.5. Liquid chromatography coupled to tandem mass spectrometry (LC-MS/
MS)
1 μg of the tryptic peptides was injected for each analysis spiked with the Pierce retention time calibration mixture (PRTC) (Thermo Fisher Scientific, Rockford, lL) (25 fmol/injection). For LC-MS/MS analysis, we used a Thermo Q Exactive mass spectrometer (Thermo Scientific, Waltham, MA) equipped with a Dream ionization source (AMR Inc., Tokyo) and connected to an Easy n-LC 1000 liquid chro- matography system (Thermo Scientific, Waltham, MA). Peptides were injected on an Acclaim PepMap 100 pre-column (100 μm × 2 cm, Thermo Fisher Scientific) and separated on a Zaplous α Pep-C18 ana- lytical column (0.1 mm × 20 cm, AMR Inc., Tokyo) at a flow rate of 500 nL/min and a column temperature at 24 °C. A non-linear gradient was established using solvents A (0.1% formic acid in water) and B (0.1% formic acid in acetonitrile) to elute the peptides. The gradient started with 5% solvent B and increased to 22% during 100 min. In the next 14 min, solvent B increased to 32% and finally, it augmented to 95% in 12 min and it was kept at 95% for 14 min. Samples were ana- lyzed using a top 15 data-dependent acquisition (DDA) method. MS1 scan was acquired in the Orbitrap analyzer with a 400–1600m/z in- terval, 70,000 (@ 200 m/z) resolution, target AGC value of 1e6 and maximum injection time of 100 ms. The 15 most intense peaks (charge
≥2) were selected and fragmented in a Higher Energy Collisional Dissociation (HCD) cell with a normalized collision energy of 30%. MS2 spectra were acquired with a 17,500 (@ 200 m/z) resolution, target AGC value of 2e5 and maximum injection time of 120 ms. The ion se- lection threshold was set to 8.3e3 and dynamic exclusion was set to 20 s. Samples were randomly analyzed and each run was followed by a blank injection (0.1% formic acid in MilliQ water) with a short gradient of 35 min to avoid any residues from the previous sample. A quality control sample (QC) was prepared from a pool of 4 brain digests spiked with PRTC. 1 μg of QC sample together with 25 fmoles of PRTC peptides was injected after every 15 samples in order to evaluate system stabi- lity.
2.6. Protein inference and relative quantification
Raw data generated on the mass spectrometer was analyzed using the software Proteome Discoverer (PD) version 2.1 (Thermo Scientific, Waltham, MA). Peptide identification was done with the SEQUEST HT
algorithm using the UniProt human database as reference (version from 07/09/2016, canonical sequences only). The following search para- meters were employed: cysteine carbamidomethylation as static mod- ification, methionine oxidation as dynamic modification, 10 ppm tol- erance for precursor ions and 0.02 Da for fragment ions. A maximum of 2 missed cleavages was allowed. Protein quantification was done using the Precursor Ions Area Detector node, where the average of the 3 most intense peptides was used for protein quantification, being considered only unique peptides. The mass spectrometry proteomics data have been deposited to the ProteomeXchange Consortium via the PRIDE (Vizcaíno et al., 2015) partner repository with the dataset identifier PXD010138.
2.7. Targeted MS/MS analysis by parallel reaction monitoring (PRM) Parallel reaction monitoring (PRM) was employed to verify a set of differentially expressed proteins. One to five unique peptides for each protein of interest were selected, and in the final assay, 75 peptides corresponding to 21 proteins (including apolipoprotein E2, E3, and E4 and a peptide associated with Aβ) were monitored (Table S2). The protein digests were spiked with a mixture of stable isotope standard peptides (SIS) correspond to apolipoprotein E (4 isoform-specific pep- tides and one peptide that is common in all isoforms). 1 μg of the tryptic peptides was injected for each analysis spiked with SIS peptides (20 fmoles/injection). For the PRM analysis, a Thermo Q Exactive HF-X mass spectrometer was used equipped with an Easy-spray source and connected to an UltiMate 3000 RSLCnano system (Thermo Scientific, Waltham, MA). Peptides were injected on an Acclaim PepMap 100 pre- column (75 μm × 2 cm, C18, 3 mm, 100 Å Thermo Scientific) and se- parated on an EASY-Spray column (75 μm × 25 cm, PepMap RSLC C18, 2 mm, 100 Å) at a flow rate of 300 nL/min and a column temperature at 45 °C. A non-linear gradient was established using solvents A (0.1%
formic acid in water) and B (0.1% formic acid in 80% acetonitrile) to elute the peptides. The gradient started with 4% solvent B and in- creased to 30% in 30 min. In the next 5 min, solvent B increased to 45%
and finally increased to 98% in 1 min and it was kept at 98% for 5 min.
Targeted MS2 mode was operated with the time-scheduled acqui- sition of the selected precursors with 3 min retention time windows.
MS2 scans were acquired using 30,000 (@ 200m/z) resolution, the AGC target value was set to 2e5 and 100 ms maximum injection time was used. Fragmentation was performed with a normalized collision energy of 27. Samples were randomly analyzed, and each run was followed by a blank injection to avoid any residues from the previous sample.
2.8. Bioinformatics and statistical analysis
Proteins identified from database search that fulfilled the following requirements were subjected to further analysis: master protein, 1%
FDR, and identified with at least 2 peptides. Statistical analysis was carried out in Perseus v 1.6.0.7 and R. Protein area values were con- verted to log2 scale and normalized by subtracting the median of the sample distribution. Proteins with < 50% valid values in each group (controls, early and late B/B) were removed from the analysis. The remaining proteins were subjected to missing value imputation using the default parameters (width 0.3, down shift 1.8) of the Perseus im- putation tool. Sex, age and post mortem intervals were compared be- tween the three groups (control, early and late B/B stages) in each re- gion using Chi-square test (for binary data) and linear regression (for continuous numerical values) to determine whether these variables differ between groups. These tests showed that the disease groups were unbalanced with respect to age (p-value < 0.0338) and sex (p- value < 0.1551) in the four brain regions (Fig. S1). Accordingly, all proteins significantly associated with age or sex (linear regression analysis, p-value < 0.05) were removed from the list of differentially expressed proteins. In order to evaluate differentially expressed pro- teins (DEPs) during disease progression, Student'st-test was applied to 3
compare early B/B (I-III) and late B/B (IV-VI) stages with the control group (p-value < 0.05, fold change ≤0.66 or ≥ 1.5) in each brain re- gion. Analysis of DEPs between the 4 brain regions in health state was performed using one-way ANOVA with post-hoc Tukey's honestly sig- nificant difference (HSD) test. The following requirements were used to determine significance: adjusted p-value < 0.05 and fold change ≤0.66 or ≥ 1.5. Heat maps were generated from hierarchical clustering based on average Euclidean distance and complete linkage, using R.
Venn diagrams were generated with an online tool from Ghent University (http://bioinformatics.psb.ugent.be/webtools/Venn/).
Protein-protein interaction networks were built with String version 10.5 (https://string-db.org/) using 0.7 as the minimum required in- teraction score (high confidence). Gene ontology enrichment analysis was carried out on String version 10.5 and DAVID version 6.8 (https://
david.ncifcrf.gov/).
Verification of DEPs identified in the present work was performed by comparison with two other AD proteomic studies (Hondius et al., 2016; Seyfried et al., 2017), and only proteins reported to be sig- nificantly altered were used in the comparison. From the study reported inSeyfried et al., 2017, the results from dorsolateral prefrontal cortex were selected for verification, and proteins fulfilling the following cri- teria were considered as DEPs: ANOVA with post-hoc Tukey's HSD test p-value < 0.05. For the comparison, the highest log2 fold change values were used in case of all DEPs.
3. Results
3.1. Human brain proteome profiling
We employed a mass spectrometry-based approach to interrogate the human brain proteome during AD progression (B/B stages) in four distinct brain regions: entorhinal cortex (EC), parahippocampal cortex (PHC), temporal cortex (TC) and frontal cortex (FC). Importantly, we wanted to evaluate brain areas that are affected by tau pathology at different disease stages, in order to gain insights if there are common mechanisms or patterns shared between different brain regions during disease progression. Among the investigated regions EC and PHC that belong to the medial temporal lobe are affected already at the early, while the neocortical regions (TC, FC) are affected by tau pathology only at the late stages of AD (Braak and Braak, 1991). A total of 103 samples were analyzed individually, furthermore, digestion replicates were generated for each brain region in order to evaluate the re- producibility of sample preparation. As expected, the correlation was higher between digestion replicates than biological replicates from the same disease group (Fig. S2). In total 3809, 3815, 3610 and 3720 protein groups with at least 2 peptides were identified in EC, PHC, TC, and FC, respectively. There was a large overlap (> 85%) between the identified protein groups from different disease stages in each brain region as it is indicated in Fig. S3. Gene ontology enrichment for cel- lular components (GOCC) revealed similar categories for the four brain regions (Fig. S4).
Comparative proteome profiling during disease progression
Comparative proteome profiling of the different brain regions
Control Early AD stages (B/B I - III)
Late AD stages (B/B IV - VI) Frontal CTX
Temporal CTX
Parahippocampal CTX
Entorhinal CTX
Compparative proteome profiling during diseasse progressioon
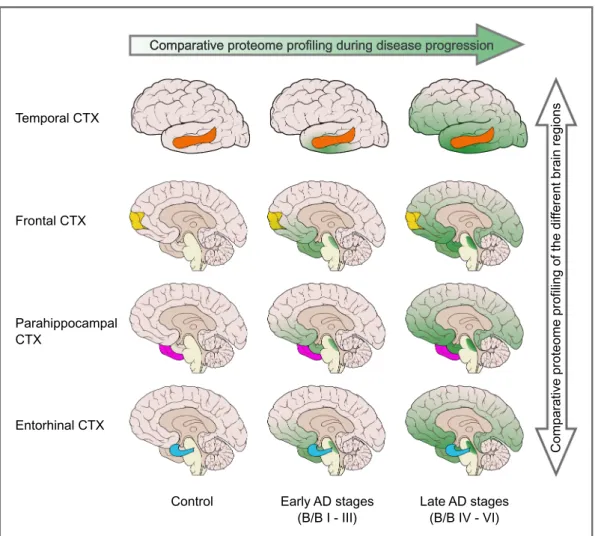
Fig. 1.Graphical illustration of the study design.
Two approaches were employed in the study: 1) comparative proteome profiling during disease progression to unravel altered proteins/pathways in different brain regions and 2) comparative proteome profiling of different brain regions in healthy subjects to investigate brain region vulnerability to AD.
GRIN2B
PIK3R1
PTK2B GNA11
GSK3B
SST MT-ND4
APP
MT-ND1
MT-CYB
SERPINA1 A2M
S100B MT-ATP8
CD44 ACAN
Late-FCLate-TCLate-PHCLate-EC
Early-FCEarly-TC
Early-PHC
Early-EC
(C)-FC(C)-TC(C)-PHC(C)-EC
BCL2L13 NUMBL STRN4 CEP170B RFTN1 AUH SH3GL1 CTNND1 FLNA RNPEP GFAP
1.0 0.5 0.0 -0.5 -1.0
Intensity (z-score)
187
28
9 11
4
1 0
0 1
4 0 0 0 0 0
3 194
106
118 391
22
15 3 5
0 1 4
6
5 1 9
EC
PHC
TC
FC AD
risk ge nes GNA11 VSNL1 EPHA4 MT-ND1 MT-ND4
MT-CYB S100B PRUNE2 PARP1 MAGI2 MT-ND4 EXOC2 TARDBP PIK3R1 APP CD44
PTK2B A2M SERPINA1 CADPS2 DLST TFAM CD44 GRIN2B
MT-ATP8 SST ACAN GSK3B COMT EXOC2 TARDBP PIK3R1 APP GRIN2B
B A
C
(caption on next page)
5
3.2. Proteins differentially expressed during AD progression
In this work, we employed two approaches to analyze differences in proteome profiles of brain areas affected by tau in early (EC, PHC) and late disease stages (TC, FC) (Fig. 1). Firstly, in order to understand how the brain proteome is altered during AD progression, we investigated which proteins are differentially expressed when comparing early (B/B I-III) and late disease stages (B/B IV-VI) to control individuals in each brain region. Secondly, to investigate physiological proteomic sig- natures that might contribute to brain area susceptibility to AD, we compared the proteomic profiles of the four brain regions in healthy subjects (controls).
Regarding the first approach (investigation of changes in the pro- teome of each region during AD progression), a total of 248, 278, 163 and 171 proteins were significantly different in EC, PHC, TC, and FC, respectively, totalizing 737 proteins (Table S3). Interestingly, the highest numbers of DEPs were observed in the regions affected early by tau pathology. Early changes in protein levels were observed in each region but the number of altered proteins increased when the late disease stage was compared with controls (Fig. S5). The comparison of DEPs from various brain regions revealed that there is only a small overlap between regions, especially during the early stages, although there is an increase in the number of shared proteins during the late stages. The comparison of differentially expressed proteins found in each region indicated that in total 101 proteins are shared between two, and only 11 proteins are shared between three brain regions (Table 1, Fig. S6). Out of these 112 proteins, 99 showed similar expression level changes across brain regions (up- or down-regulated in all comparisons) and only 13 changed in opposite directions across comparisons (up- regulated in one and down-regulated in another brain region). Some of the aforementioned 11 proteins are involved in metabolic processes (CTNND1, FLNA, AUH, RNPEP, and NUMBL) and related to cell-ad- hesion: CTNND1, FLNA and NUMBL play a role in adherens junction organization; and CTNND1, FLNA and SH3GL1 are expressed in the cell junction. Hierarchical clustering of the 11 proteins altered in three brain regions was performed and a heat map was generated considering their expression during disease progression in all brain areas (Fig. 2A).
Two main protein clusters were detached with opposite expression profiles during disease progression, in addition to Bcl-2-like protein 13 (BCL2L13) that was down-regulated in MTL but slightly up-regulated in the neocortex. The cluster with augmented expression levels in late disease stages consists of 3 proteins including two well-known AD players: filamin A (FLNA) and glial fibrillary acidic protein (GFAP), a marker of astrocytes, while the other cluster of 7 proteins shows re- duced levels in AD compared to controls.
We wondered if some proteins that were found to be altered during disease progression have already been associated with genetic risk for AD. A comparison was done between all 737 differentially expressed proteins and a list of AD risk genes published recently (Hu et al., 2017).
We found that 27 proteins have already been described as AD risk loci (Fig. 2B). With the aim to better clarify the relationship between these proteins, an interactome showing protein-protein interactions was built with String (Fig. 2C). The majority of proteins are connected, and APP appears as a central node with the highest number of interactions.
Functional enrichment analysis revealed that synaptic proteins and proteins involved in oxidative phosphorylation are overrepresented.
Additionally, some of these proteins are involved in pathways related to neurodegenerative disorders, such as Alzheimer's disease (APP, GRIN2B, GSK3β, MT-ATP8, MT-CYB), Parkinson's disease (MT-ATP8,
MT-CYB, MT-ND1, MT-ND4) and Huntington's disease (GRIN2B, MT- ATP8, MT-CYB, TFAM).
3.3. Altered pathways during AD progression
In order to evaluate segregation of disease stages and to observe expression profiles, hierarchical clustering of DEPs from the four brain regions (EC, PHC, TC, and FC) was performed. Four major protein clusters were found, which represent distinct expression patterns (early- up, early-down, late-up and late-down) during disease progression. The majority of altered proteins were found down-regulated in AD con- sidering all regions (> 70% in MTL and > 60% in the neocortex) (Figs. 3 and 4). With the aim to clarify which pathways and processes are altered during disease progression, each cluster was further sub- jected to enrichment analysis.
Regarding EC, pathway analysis revealed that the mitochondrial respiratory chain complex I assembly is significantly enriched in the early-down cluster that consists of 14 proteins, indicating an impair- ment in oxidative phosphorylation. The late-down cluster incorporates 189 proteins, among which proteins involved in vesicle-mediated and protein transport, translation including ribosome subunits, as well as synaptic proteins are highly enriched. A greater impairment in oxida- tive phosphorylation was also observed in this cluster. On the other hand, the early-up cluster presents 24 proteins, some of which are as- sociated with cell-cell adhesion. 21 proteins belong to the late-up cluster, where cell adhesion and astrocyte development were found as enriched processes (Fig. 3and Table S4).
Considering PHC, 104 proteins are present in the early-down cluster, and as it was seen in EC oxidative phosphorylation is sig- nificantly enriched. Actin filament and synapse-based processes are also present in this cluster. PHC late-down cluster is composed of 95 pro- teins, which are related to oxidative phosphorylation, translation, and synapse. Interestingly, these processes were also found in EC late-down cluster. PHC early-up cluster harbors 26 proteins, which are related to platelet aggregation and the regulation of cell shape. The late-up cluster has 39 proteins that are associated with extracellular matrix organiza- tion, cell adhesion and UDP-N-acetylglucosamine biosynthetic process (Fig. 3and Table S4). Remarkably, proteins involved in cell adhesion were also present in EC early-up and late-up clusters.
Considering TC, the early-down cluster has 48 proteins that are mainly involved in synaptic processes and oxidative phosphorylation (respiratory electron transport chain). The late-down cluster presents 48 proteins that are related to cell adhesion and to the regulation of cytoskeleton organization. The early-up cluster consists of 62 proteins that are associated with the oxidation-reduction process, cholesterol metabolic processes and lipid transport. Only 5 proteins compose TC late-up cluster, where extracellular matrix organization is one of the few processes found enriched (Fig. 4and Table S5).
Concerning FC, the early-down cluster contains 31 proteins, which are mainly synaptic proteins. In total, 61 proteins form the late-down cluster of FC, where synapse and protein translation were found en- riched. FC early-up cluster presents 33 proteins, which are related to acute phase response and platelet activation. Finally, FC late-up cluster includes 26 proteins that are involved in extracellular matrix organi- zation (Fig. 4and Table S5).
Up and down-regulated proteins in each brain region were sub- mitted to enrichment analysis for cellular component categories (GOCC) to unravel key cellular parts/organelles affected by the disease.
This analysis revealed a remarkable down-regulation of the Fig. 2.Proteins differentially expressed during AD progression.
A) Hierarchical clustering of 11 proteins that are altered in 3 brain regions. Cluster in red: up-regulated proteins during AD course; Cluster in green: down-regulated proteins during AD course. B) Venn diagram showing the overlap of AD risk loci with DEPs found in each brain region. C) Protein interactome of DEPs described as AD risk genes. Line color indicates the type of interaction evidence (yellow: textmining, purple: experiments, light blue: databases, black: co-expression, blue: co- occurrence). (For interpretation of the references to color in this figure legend, the reader is referred to the web version of this article.)
Table 1
Differentially expressed protein (DEPs) during AD progression that are shared between brain regions represented by their log2 fold changes. Red color indicates up-regulated, blue color indicates down- regulated proteins in AD.
Gene name Early B/B stages Late B/B stages EC PHC TC FC EC PHC TC FC GFAP 0.771 0.893 1.212 0.914 0.884 FLNA 1.286 0.911 1.369 0.949 1.008
AUH -0.834 -0.717 -0.684
CEP170B -1.123 -0.679 -0.636 CTNND1 -0.858 -1.568 -1.144 BCL2L13 1.393 -2.675 -1.461 1.267
RNPEP 1.153 0.845 0.837 RFTN1 0.652 -1.019 -0.842 SH3GL1 -0.836 -0.845 -0.840 STRN4 -0.879 -0.901 -0.665 NUMBL -0.754 -1.446 -0.810 -0.991
CAPS 2.360 3.166 3.171
ANXA1 1.475 1.801 1.964
PLIN3 1.462 1.093
BDH2 0.954 0.771
RAB33B -1.018 -0.606 -0.917
MT-ND4 -0.632 -0.834
RAP2A -0.786 -0.647
THY1 -0.681 -0.723
RAB3GAP1 -0.683 -1.360
GAP43 -0.751 -0.642
FXYD7 -0.772 -1.828
PCCB -0.805 -0.700
SYT7 -0.866 -0.868
DIRAS2 -0.606 -0.886 -0.868
HPCA -0.901 -1.009
PLXNA1 -1.301 -0.908 -1.369
RPTOR -1.864 -0.949
ESYT1 -0.972 0.675
MARK2 -0.911 -0.995 -0.830
GMPS -1.021 -1.262
LRRC57 -0.638 -1.058 -0.708
RPS13 -1.135 -1.341
SRC -1.167 -1.192
SCN2A -1.210 -0.590
EMC1 -0.879 -1.238 -0.812
FGF12 -0.927 -1.249 -0.614
ATPAF1 -1.188 -1.281 -1.472
UQCR10 -1.326 -0.607
DIRAS1 -1.372 1.171
VAMP2 -1.377 -0.684
C2CD4C -1.412 -1.571
GGA3 -1.412 1.016
SLC25A46 -1.414 -2.197
AP3M2 -1.590 -1.647
RAB10 -1.141 -1.684
CA4 -0.755 -1.770 -1.141
IGSF21 -1.781 -0.812
SCYL1 -2.280 -2.437
KYAT3 1.405 0.862
RPA3 1.370 -0.858
GNG5 1.103 2.394
CLIC1 0.948 1.083
CAPG 0.826 0.761
GYG1 0.685 0.628
(continued on next page) 7
Table 1(continued)
DYNLL2 -0.630 -0.688 -1.149
SDHC -0.711 -1.596
TRIM3 -1.060 -0.652
CHN1 -1.301 -0.794
EXOC7 -1.905 -2.113 -2.009
DLGAP1 -1.136 -0.705
ERC2 -1.588 -1.146
PFDN6 -1.484 -1.377
VGF -1.890 -2.014
EXOC3 -0.778 -1.339
PFKFB2 0.991 1.122
ORM1 1.286 0.883 1.590
ALB 0.709 0.604
APP 1.447 0.843
CD63 -1.245 -0.683 -0.608
MAP2 -0.926 -0.799 -0.586
VCAN 0.847 0.805
ACYP2 -0.727 -0.795
COX6B1 -1.084 -0.808
GABRA1 -0.907 0.980
CD44 2.354 1.362
RAB3B -0.888 -1.126
GART 0.619 1.012
FDXR 1.477 -1.182
PIK3R1 -0.932 -0.775
CORO1A -0.614 -0.666
SPR 0.687 0.984
KRT2 2.237 -2.021
AGFG1 -0.743 -0.630
SUB1 -1.585 -1.767
RPL23A -1.088 -0.867
RPL23 -0.952 1.094
FKBP1A -0.859 -0.890
GRIN1 -1.196 -1.017
TARDBP -0.582 0.818
GRIN2B -1.443 -0.708
SCARB2 1.447 1.128 1.473
CTTN -0.858 -1.159
CAMK4 -0.587 -0.625
KIAA1217 -1.347 -1.567
SLC27A4 -0.761 -0.946
SH2D5 -1.312 -1.177 -1.097
RIMS1 -0.738 -0.842 -0.863
HOMER1 -0.852 -0.668
DMXL2 -0.856 -0.693
SCFD1 -0.621 -0.905 0.711
NRGN -1.056 -0.820 -1.152
ACSF2 -1.048 -1.014
EXOC2 -0.599 0.846
SYNGAP1 -0.642 -0.618
SGIP1 -1.015 -0.628
RAB11FIP5 -1.105 -1.037 -1.640
PHACTR1 -0.969 -0.956
HAPLN2 0.754 1.112
TANC2 -0.626 -0.888
BSN -0.669 -0.814
PCLO -1.604 -0.788
mitochondrial and ribosomal proteins in MTL regions. In addition, a global down-regulation of synaptic, dendritic and axonal proteins oc- curred in all 4 regions (Fig. 5A). Mitochondrial oxidative phosphor- ylation impairment and translation dysregulation were evident pri- marily in the two MTL regions, however, a few related proteins were found altered in the neocortex as well (Table S4 and Table S5). Proteins associated with oxidative phosphorylation and translation pre- dominantly show a decreasing expression profile in MTL during disease progression. On the contrary, in neocortex the majority of these pro- teins are unaffected, and only a few proteins were found significantly down-regulated in AD (Figs. 5B and C).
3.4. Proteome profiling of healthy subjects in different brain regions Currently, the matter of brain area vulnerability in neurodegen- erative disorders is a highly debated and unsolved question. Our goal was to identify distinctive proteomic signatures in the brain that can be associated with the susceptibility of some areas to present early de- generation in AD. The comparison of the proteome from healthy in- dividuals (controls) resulted in 648 differentially expressed proteins between the four brain areas (Table S6). Hierarchical clustering of all 648 DEPs was performed and the resulting dendrogram clearly sepa- rated MTL samples from neocortical samples (Fig. 6A). DEPs were di- vided into 2 major clusters: one group of 238 proteins with higher levels in the neocortex compared to MTL (MTL-down) and another group of 410 proteins that are more expressed in MTL (MTL-up).
In order to clarify which pathways are more active in specific brain areas, each cluster was subjected to enrichment analysis using DAVID (Table S7). It is noteworthy that several overrepresented pathways in the MTL-up cluster have already known link to AD, such as energy production (oxidative phosphorylation), protein translation, protea- some (Fig. 6B). Long-term potentiation is also significantly enriched in this cluster. A total of 16 ribosomal proteins (RPL17, RPL27A, RPL36, RPL38, RPS4X, RPS16, RPL23, RPL9, RPS14, RPS12, RPL10, RPL5, RPS10, RPS20, RPS11, RPL4) and 10 proteins from proteasome-com- plex (PSMA2, PSMD12, PSMC4, PSME1, PSMC2, PSMB3, PSMC1, PSMB2, PSMD7, PSMD8) were found among the proteins significantly upregulated in MTL. Additionally, a greater number of mitochondrial proteins was recognized in cluster MTL-up (79 proteins, 19.27%) compared to cluster MTL-down (24 proteins, 10.08%).
Regarding the cluster of proteins significantly up-regulated in the neocortex, some proteins involved in proteasome regulation (negative regulation of proteasomal ubiquitin-dependent protein catabolic pro- cess (GO:0032435)), e.g. UBXN1, BAG6 and CCAR2 are enriched in this cluster, but none of them belongs to the proteasome complex. Proteins involved in mRNA splicing via spliceosome (HNRNPL, SRSF1, NONO, SF3B1, SRSF7, ELAVL1, RBMX, YBX1) and in integrin-mediated sig- naling pathway (ADAM23, LAMA5, SEMA7A, ADAM22, ZYX, DST) are exclusively enriched in this cluster. Cytoskeleton and synapse-related proteins are overrepresented in both clusters (Table S7).
We further investigated whether some of these proteins that dif- ferentiate MTL and neocortex in healthy tissue were altered in AD as well. Interestingly, 226 proteins (out of 648) showed altered levels during disease progression. We found that proteins with higher ex- pression level in MTL were almost exclusively down-regulated in the same brain region during AD progression, and similar behavior was observed in the neocortex, i.e. many proteins with higher abundance in healthy neocortical tissue showed reduced expression in this brain re- gion during disease.
3.5. Comparative analysis with other proteomic studies in AD
With the aim to confirm the validity of our findings, we sought to compare our full dataset of dysregulated proteins during AD progres- sion (737 proteins in the four brain regions) with the lists of altered proteins reported by two recently published AD proteomic studies
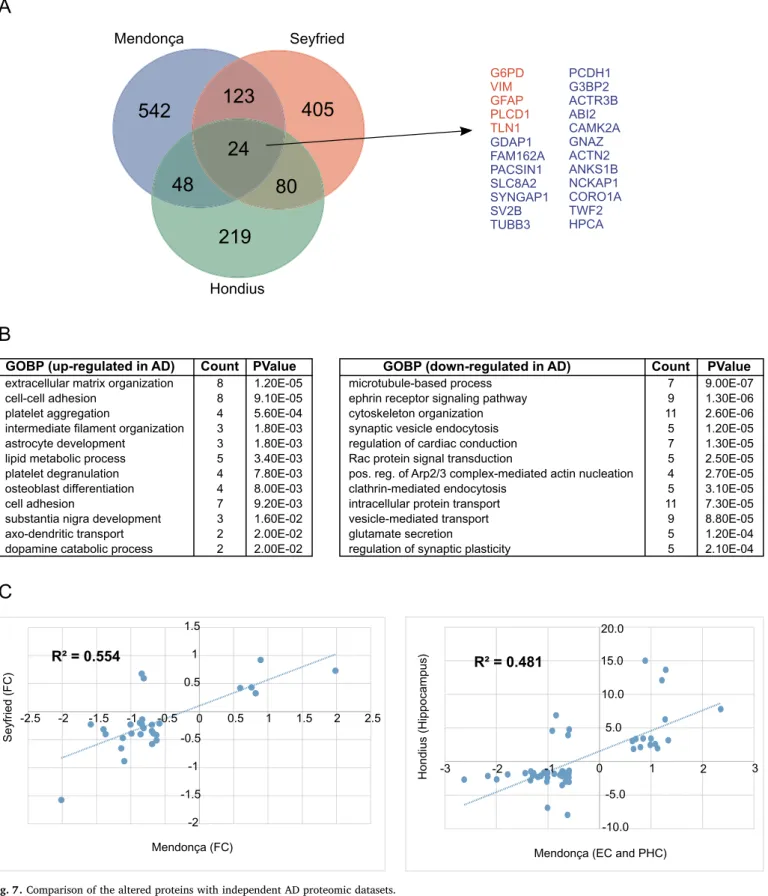
(Hondius et al., 2016;Seyfried et al., 2017). In total, 275 proteins were shared between at least two studies, and 24 proteins were dysregulated in AD in all three studies (Fig. 7A; Table S8). The common proteins showed similar behavior in all proteomic studies, 19 proteins (G3BP2, ABI2, ACTR3B, TWF2, SV2B, SYNGAP1, ANKS1B, CORO1A, HPCA, PCDH1, CAMK2A, ACTN2, TUBB3, PACSIN1, NCKAP1, SLC8A2, FAM162A, GNAZ, GDAP1) were found down-regulated, while 5 (TLN1, VIM, G6PD, GFAP, PLCD1) were up-regulated in AD. (Table S8, high- lighted). This is especially interesting since the previous works focused on different brain regions, e.G.hippocampus(Hondius et al., 2016) and dorsolateral prefrontal cortex (Seyfried et al., 2017).
To unravel the role of the conserved proteins, functional enrichment analysis was carried out using proteins shared between at least two studies. Only concordant proteins (changes in their expression levels show the same direction in all studies) were evaluated in this analysis.
Among up-regulated proteins, the most significant biological process categories were extracellular matrix organization, cell adhesion, lipid metabolic processes, platelet degranulation and astrocyte development (Fig. 7B). On the other hand, down-regulated proteins are mainly in- volved in microtubule-based processes, vesicle-mediated transport, and synaptic vesicle endocytosis, ephrin receptor signaling, and cytoske- leton organization (Fig. 7B).
Remarkably, 195 proteins that showed alteration during AD in the present study have already been described previously. Additionally, the majority of these proteins (166) shows similar expression level changes to what previously reported (Table S8). With the aim to better assess the similarity between our results and other proteomic studies, we compared the log2 fold changes of overlapping altered proteins (Fig. 7C). Moderate correlation (R2) was found between our results and the datasets from Hondius et al. and Seyfried et al. that comprised brain regions similar to those investigated in the current study. It is important to note that, although there are differences between the log2 fold changes of various proteins, which has an impact on the correlation, the great majority of common proteins show accordant changes across the studies. Overall, these results reinforce the validity of our proteomic findings.
3.6. Verification of a set of differentially expressed proteins by targeted MS/
MS
To confirm the validity of our label-free quantification approach a set of differentially expressed proteins from the discovery phase were selected for PRM analysis. 75 peptides corresponding to 21 proteins were included and successfully detected in the final PRM assay panel.
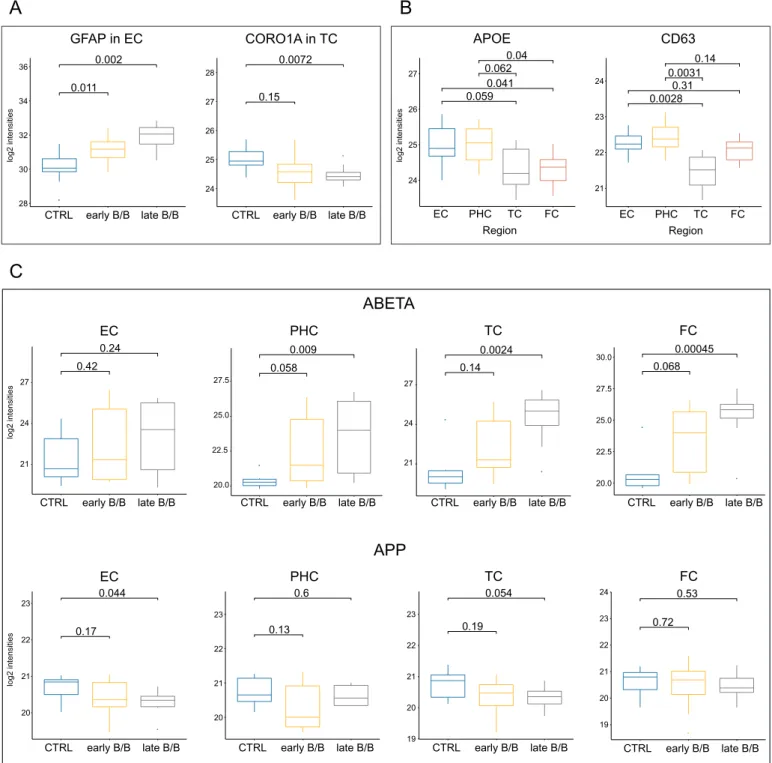
By comparing controls with the AD groups 16 proteins out of the 17 DEPs showed significant differences in at least one brain region, fur- thermore, expression level alterations between the MTL and neocortical regions were confirmed for 5 proteins including APOE (Table S9, Fig. 8A and B). In addition to determining APOE level with the help of the isoform-specific SIS peptides we were able to identify APOE phe- notypes as well, as we described it in our previous publication (Rezeli et al., 2015). We found all six different phenotypes among the samples, but we couldn't make a systematic quantitative comparison between phenotypes since > 70% of the samples wereε3 homozygotes (Table S1).In contrast to the discovery phase during PRM analysis Aβ level was measured separately from APP by using a peptide (LVFFAEDVGSNK), corresponding to residues 17–28 of Aβ. Although this peptide is not suitable for differentiating between the holoprotein and its fragment, the different behavior of the Aβ peptide and the other APP peptides indicates that it is appropriate for measuring Aβ levels. Significant in- crease in the Aβ level was observed in each region during AD pro- gression, while APP was constant or slightly decreased (Fig. 8C).
9
Early B/B Late B/B (C)
Late-up cluster
Early B/B Late B/B
(C)
Early-up cluster
Early B/B Late B/B
(C)
Late-down cluster
Early B/B Late B/B
(C)
Early-down cluster
late down cluster
early down early up
late up
(C) Early B/B Late B/B (C) Early B/B Late B/B
lipid homeostasis
mitochondrial respiratory chain complex I assembly glutamate secretion
pos.reg. of prot. insertion into mitochondrial membrane calcium ion-regulated exocytosis of neurotransmitter actin cytoskeleton reorganization
vesicle fusion EC
EC PHC PHC PHC PHC PHC
2.98E-02 4.77E-02 5.19E-04 6.38E-04 1.38E-03 2.38E-03 4.54E-03
GOBP Term P-Value
a e r A
vesicle-mediated transport intracellular protein transport
nuclear-transcribed mRNA catabolic process protein localization to plasma membrane translational initiation
SRP-dependent cotranslational membrane targeting oxidative phosphorylation
nuclear-transcribed mRNA catabolic process mitochondrial respiratory chain complex I assembly translational initiation
EC EC EC EC EC PHC PHC PHC PHC PHC
4.38E-06 3.80E-05 2.49E-04 5.01E-04 5.85E-04 1.26E-03 1.86E-03 2.99E-03 3.86E-03 4.94E-03
GOBP Term P-Value
a e r A
reg. of cellular response to heat cell-cell adhesion
autophagosome maturation platelet aggregation reg. of cell shape
3'-UTR-mediated mRNA stabilization EC
EC EC PHC PHC PHC
4.29E-03 5.10E-03 3.23E-02 2.31E-05 8.89E-04 2.30E-02
GOBP Term P-Value
a e r A
pos.reg. of vesicle fusion Bergmann glial cell differentiation intermediate filament organization astrocyte development cell-cell adhesion
UDP-N-acetylglucosamine biosynthetic process extracellular matrix organization
N-acetylneuraminate catabolic process cell-cell adhesion
carbohydrate phosphorylation EC
EC EC EC EC PHC PHC PHC PHC PHC
7.90E-03 1.01E-02 1.80E-02 1.80E-02 3.70E-02 2.43E-04 7.92E-04 1.28E-02 2.01E-02 4.82E-02
GOBP Term P-Value
a e r A
C H P C
E
2 1 0 -1 -2
Intensity (z-score)
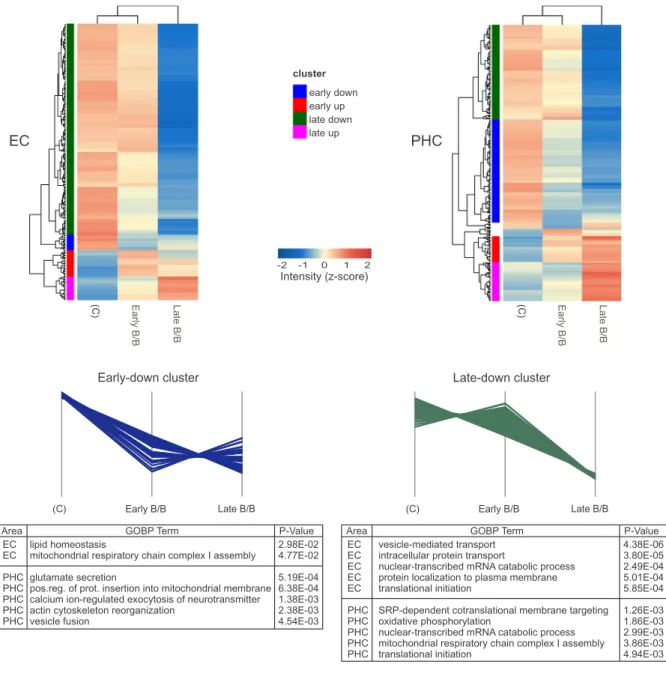
Fig. 3.Hierarchical clustering and functional enrichment analysis of DEPs in the MTL during AD progression.
Heat maps built with DEPs found in EC and PHC. Clusters representing the four typical expression profiles are colored accordingly to the heat maps. The 5 most significant biological processes (GOBP) are listed for each expression profile.
MAPK cascade synapse assembly
chemical synaptic transmission dendritic spine morphogenesis respiratory electron transport chain synaptic vesicle exocytosis neurotransmitter secretion chemical synaptic transmission cell migration
Wnt signaling pathway TC
TC TC TC TC FC FC FC FC FC
4.07E-03 1.02E-02 2.20E-02 2.96E-02 4.89E-02 6.07E-04 3.25E-03 7.26E-03 3.31E-02 3.86E-02
GOBP Term P-Value
a e r A
cell-cell adhesion
intracellular signal transduction adherens junction organization actin cytoskeleton reorganization movement of cell or subcellular component SRP-dependent cotranslational membrane targeting long-term memory
nuclear-transcribed mRNA catabolic process chemical synaptic transmission
translational initiation TC
TC TC TC TC FC FC FC FC FC
7.05E-05 3.91E-03 4.22E-03 6.73E-03 2.13E-02 3.08E-03 3.38E-03 5.96E-03 6.44E-03 8.77E-03
GOBP Term P-Value
a e r A
oxidation-reduction process intracellular sequestering of iron ion cholesterol metabolic process methylation
lipid transport
blood coagulation, fibrin clot formation platelet degranulation
pos.reg. of adhesion-dependent cell spreading acute-phase response
platelet aggregation TC
TC TC TC TC FC FC FC FC FC
1.16E-03 2.13E-02 2.46E-02 2.81E-02 3.02E-02 2.51E-08 3.66E-08 3.00E-05 5.48E-05 6.38E-05
GOBP Term P-Value
a e r A
extracellular matrix organization bicarbonate transport neurofilament bundle assembly axon development
extracellular matrix organization
cellular response to fibroblast growth factor stimulus TC
FC FC FC FC FC
4.59E-02 1.64E-03 4.10E-03 1.36E-02 2.92E-02 4.03E-02
GOBP Term P-Value
a e r A
Early B/B Late B/B
(C)
Late-down cluster
Early B/B Late B/B
(C)
Early-down cluster
Early B/B Late B/B
(C)
Early-up cluster
Early B/B Late B/B
(C)
Late-up cluster
(C) Early B/B Late B/B (C) Early B/B Late B/B
C F C
T
late downcluster early down early up
late up
2 1 0 -1 -2
Intensity (z-score)
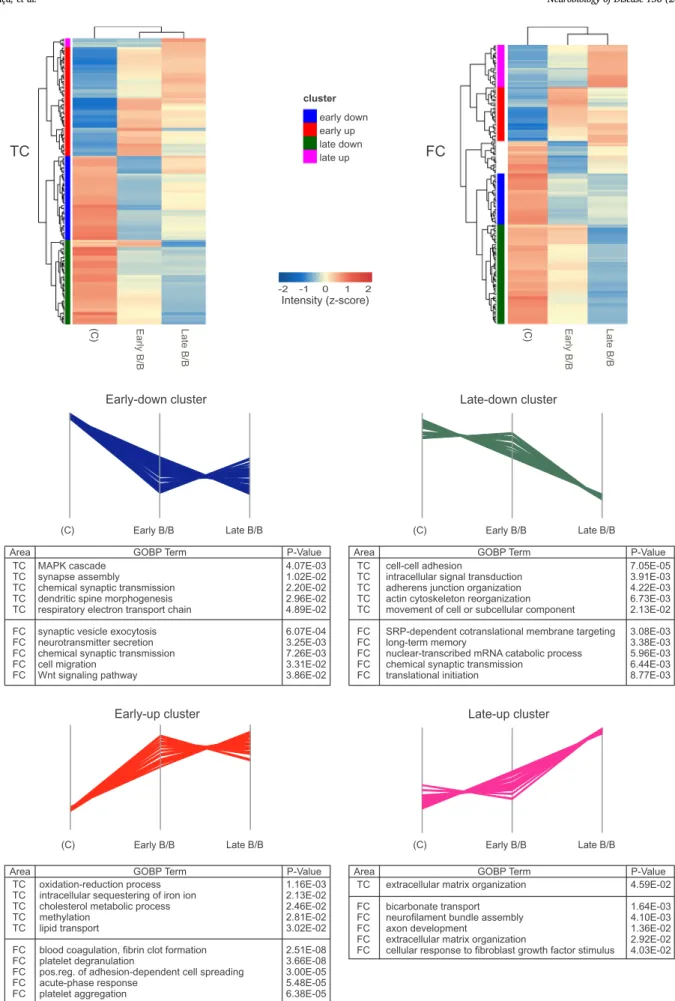
Fig. 4.Hierarchical clustering and functional enrichment analysis of DEPs in the neocortex during AD progression.
Heat maps built with DEPs found in TC and FC. Clusters representing the four typical expression profiles are colored accordingly to the heat maps. The 5 most significant biological processes (GOBP) are listed for each expression profile.
11
Fig. 5.Key cellular parts/organelles and pathways affected by AD.
A) Representative cellular component categories (GOCC) in down-regulated protein clusters. B) Expression profiles of proteins related to oxidative phosphorylation.
C) Expression profiles of proteins involved in translation.
Region Sex Age (year)
Post mortem (h) Post mortem (h) 10
2
Age (year) 80
50
Sex male female
Region PHC EC TC FC
-2 -1 0 1 2
Intensity (z-score)
A
B
Oxidative phosphoryl ation
Alzheimer's diseaseLong-term
potentiationProteasome Parkinson's
disease Ribosome
cGMP-PKG signali ng pathw
ay
Valine, leucine and
isol eucine
degradation
Adrenerg ic signaling in
cardiomyocyt es
Synaptic vesicle cycleHuntington's diseaseMetabolic pathways
Dopaminergic synap
se
Amphetamine addicti
on
Non-alcoholic fatty liver
disease (NAFLD 0 )
10 20 30 40 50 60 70
0 0.0002 0.0004 0.0006 0.0008 0.0010 0.0012 0.0014 0.0016 0.0018
Count PValue
no of proteins P value
Fig. 6.Hierarchical clustering and KEGG pathway analysis of DEPs between brain regions in healthy subjects.
A) Heat map built with DEPs between brain regions. B) Top 15 KEGG pathways enriched for proteins up-regulated in MTL.
13
extracellular matrix organization cell-cell adhesion
platelet aggregation
intermediate filament organization astrocyte development
lipid metabolic process platelet degranulation osteoblast differentiation cell adhesion
substantia nigra development axo-dendritic transport dopamine catabolic process
8 8 4 3 3 5 4 4 7 3 2 2
1.20E-05 9.10E-05 5.60E-04 1.80E-03 1.80E-03 3.40E-03 7.80E-03 8.00E-03 9.20E-03 1.60E-02 2.00E-02 2.00E-02 GOBP (up-regulated in AD) Count PValue
microtubule-based process ephrin receptor signaling pathway cytoskeleton organization synaptic vesicle endocytosis regulation of cardiac conduction Rac protein signal transduction
pos. reg. of Arp2/3 complex-mediated actin nucleation clathrin-mediated endocytosis
intracellular protein transport vesicle-mediated transport glutamate secretion
regulation of synaptic plasticity
7 9 11 5 7 5 4 5 11 9 5 5
9.00E-07 1.30E-06 2.60E-06 1.20E-05 1.30E-05 2.50E-05 2.70E-05 3.10E-05 7.30E-05 8.80E-05 1.20E-04 2.10E-04 GOBP (down-regulated in AD) Count PValue
-2.5 -2 -1.5 -1 -0.5 0 0.5 1 1.5 2 2.5
-2 -1.5
-1 -0.5
0.5 1 1.5
R² = 0.554
Mendonça (FC)
Seyfried (FC)
-3 -2 -1 0 1 2 3
-10.0 -5.0 5.0 10.0 15.0 20.0
R² = 0.481
Mendonça (EC and PHC)
Hondius (Hippocampus)
542
219 123 405
48 80
24
Mendonça Seyfried
Hondius
PCDH1 G3BP2 ACTR3B ABI2 CAMK2A GNAZ ACTN2 ANKS1B NCKAP1 CORO1A TWF2 HPCA G6PD
VIM GFAP PLCD1 TLN1 GDAP1 FAM162A PACSIN1 SLC8A2 SYNGAP1 SV2B TUBB3
A
B
C
Fig. 7.Comparison of the altered proteins with independent AD proteomic datasets.
A) Venn diagram showing the overlap of DEPs between the present work and two other proteomic studies. B) Gene ontology (GOBP) enrichment analysis for overlapping proteins between at least two proteomic datasets (n = 275). C) Log2 fold changes of shared proteins between the current work and two other proteomic studies; the general correlation is shown (R2).
4. Discussion
4.1. Proteomic changes during AD progression show a complex scenario with a few shared but mostly specific processes in the different brain regions
We observed 112 dysregulated proteins and a few pathways during AD course that are shared between 2 or more brain regions, possibly indicating their importance in the pathogenesis of the disease.
Strikingly, the great majority of these proteins shows concordant changes in their expression levels in AD, further reinforcing the ex- istence of common key processes in distinct brain regions (Table 1).
Many proteins, however, were exclusively dysregulated in specific brain areas and the majority of altered pathways during the disease course was specific to certain brain regions. Regarding the progress of the disease, the similarities and differences found between the in- dividual brain regions are most likely linked to the high degree of specialization of the brain. In accordance with the endogenous speci- ficities of various brain areas, we hypothesize that genetic and en- vironmental triggers of AD affect individual brain regions differentially, and this is reflected in the found diversity of dysregulated protein ex- pression. In other words, we assume that the regionally different re- sponses to early AD triggers are the consequences of the different
log2 intensities
FC
0.068 0.00045
20.0 22.5 25.0 27.5 30.0
CTRL early B/B late B/B
TC
0.14 0.0024
21 24 27
CTRL early B/B late B/B
PHC
0.058 0.009
20.0 22.5 25.0 27.5
CTRL early B/B late B/B
EC
0.42 0.24
21 24 27
CTRL early B/B late B/B
ABETA
0.72 0.53
19 20 21 22 23 24
CTRL early B/B late B/B
FC
0.19 0.054
19 20 21 22 23
CTRL early B/B late B/B
TC
0.13 0.6
20 21 22 23
CTRL early B/B late B/B
PHC
0.17 0.044
20 21 22 23
CTRL early B/B late B/B
EC
log2 intensities
APP
0.011 0.002
28 30 32 34 36
CTRL early B/B late B/B
GFAP in EC CORO1A in TC
0.15 0.0072
24 25 26 27 28
CTRL early B/B late B/B
log2 intensities
0.059 0.041 0.062
0.04
24 25 26 27
EC PHC TC FC
Region
APOE CD63
0.0028 0.31 0.0031
0.14
21 22 23 24
EC PHC TC FC
Region
log2 intensities
B A
C
Fig. 8.Verification of a set of differentially expressed proteins by PRM.
A) Box-plot representing GFAP and CORO1A expression levels in EC and TC, respectively. B) Box-plot representing total APOE and CD63 expression levels of control subjects in 4 different brain regions. C) Box-plot representing ABETA and APP expressions in 4 different brain regions during AD progression.
15
proteomic background of each region. In some regions, proteomic changes may already be observed independent of the presence of classic pathological features of AD (e.g. tau protein aggregation). For instance, changes of the proteome in neocortical areas were observed in early B/
B stages, suggesting that these regions have already responded to AD triggers regardless of tau seeding. According to our proteomic data synapse loss occurred in all analyzed regions, indicating that this pro- cess is ubiquitous in AD.
4.2. Synapse loss, translation dysregulation, and oxidative phosphorylation impairment during AD progression and their implications to disease
Processes associated with synapse were found down-regulated in AD in all four brain areas (Fig. 5A). Synapse loss is a pathological hallmark of AD and it is an early event in disease, occurring before neuron death (Scheff et al., 2006). Synaptic degeneration presents the best correla- tion with cognitive impairment, even higher than NFT or Aβ plaques deposition (Terry et al., 1991). The alteration of synaptic proteins was observed in both neocortical regions during early B/B stages (Table S5), which suggests that earlier events, occurring before the accumulation of insoluble tau tangles, trigger neuron dysfunction. This is supported by previous studies, which reported that synapse loss occurs before tangles formation in a tauopathy mouse model (Yoshiyama et al., 2007) and soluble tau causes synaptic dysfunction in an early AD model (Polydoro et al., 2013). Additionally, Aβ peptide has also been shown to cause synaptic degeneration (Walsh et al., 2002).
Several proteins involved in translation were found down-regulated in AD, mostly in 3 regions (EC, PHC, and FC). In total, 18 ribosomal subunits and 4 translation initiation factors showed reduced levels in these regions, however, in TC, only 3 proteins associated with trans- lation were altered (1 down- and 2 up-regulated in AD) (Table S10).
Some of the translation regulators were altered already in early B/B stages in neocortical regions, indicating dysregulated pathways before insoluble tau deposition. In line with our findings, several studies re- ported altered protein synthesis and ribosomal protein expression in various brain regions from AD patients (Ding, 2005;Garcia-Esparcia et al., 2017;Hernández-Ortega et al., 2015). Previous research identi- fied a high number of translation machinery members among Aβ oli- gomers interacting partners (Virok et al., 2011), and it was found that tau interactome is enriched for proteins involved in translation and RNA processing (Gunawardana et al., 2015). Furthermore, it was re- ported that tau isolated from AD patients binds to more ribosomal proteins than tau from control subjects, and tau oligomers inhibit translation process (Meier et al., 2016). Table S10 summarizes the 24 dysregulated translation proteins in our AD cohort, associating our findings with literature data.
Reduced levels of proteins associated to oxidative phosphorylation were observed during early B/B stages in both MTL regions, with a higher number of proteins being affected during late stages (Fig. 5B, Table S4). In both EC and PHC, subunits of all electron transport chain complexes (I-V) were down-regulated. Additionally, several mitochon- drial proteins were down-regulated in the two MTL regions (Fig. 5A). In contrast, in neocortical regions, only 4 proteins linked to oxidative phosphorylation were down-regulated (NDUFS6, COX6B1, and MT- ATP8 in TC, and NDUFA6 in FC). Hypometabolism is a known feature of AD brains, occurring years before the onset of symptoms in AD- vulnerable regions (de Leon et al., 2001;Mosconi et al., 2008). Previous studies with human tissue and animal models showed that proteins involved in energy generation in mitochondria, including mitochon- drial electron transport chain subunits, are dysregulated in AD (Liang et al., 2008;Shevchenko et al., 2012). Finally, a complex regulatory mechanism underlies metabolism control, Aβ, and tau. Aβ and tau have been implicated in the impairment of oxidative phosphorylation (Rhein et al., 2009) and it was reported that APP is able to inhibit oxidative phosphorylation independently of Aβ peptide (Lopez Sanchez et al., 2017). Animal studies have demonstrated that tau has a new
physiological function in insulin signaling regulation (Marciniak et al., 2017) and that energy deprivation increases the translation of BACE1, resulting in higher Aβ levels (O'Connor et al., 2008). Furthermore that glucose deficit induces tau phosphorylation and aggregation in a tauopathy mouse model (Lauretti et al., 2017).
4.3. Relationships of AD-related differentially expressed proteins to other diseases
Because it is rather difficult to find non-demented elderly controls without tau pathology, our groups were not fully balanced with respect to age. To overcome this issue, we removed all proteins significantly associated with age from the list of differentially expressed proteins.
Investigating the set of age-associated proteins we found that our findings were consistent with a previous report (McKetney et al., 2019), as a little overlap was presented between regions, and a large propor- tion of these age-related proteins was associated with extracellular exosome (p-value = 6.2e-86) and membrane (p-value = 8.9e-29).
Furthermore, in order to examine what diseases could be related to the proteins differentially expressed between AD and controls (DEPs), Ingenuity analysis was performed. It allowed elucidating disease an- notations significantly overrepresented among the DEP sets (Fig. S7).
Interestingly, in very few cases the same disease annotations were overrepresented among DEPs for different brain regions (e.g. Seizures).
Notably, for late disease stages and the FC region, overrepresented diseases included cancer, cardiovascular disease, and neurological dis- orders (e.g. epilepsy, brain neurodegeneration). For late B/B stages and the PHC region, most of the overrepresented disease annotations re- lated to neuropsychiatric disorders (e.g. epilepsy, neuromuscular dis- ease, schizophrenia), while in the TC region, inflammatory diseases were noteworthy. The sets of DEPs for early B/B stages were much smaller than those for late stages, consequently, fewer disease annota- tions were overrepresented (Table S11). Among these, pervasive de- velopmental disorder (EC region) stood out.
The complex relationship between AD and other diseases is far from being fully understood as can be exemplified by the 86 differentially expressed proteins related also to melanoma according to the Ingenuity database (Fig. S8). This protein set includes both down- and upregu- lated proteins from various subcellular compartments, among them regulators such as CUL1 and CD44.
4.4. The vulnerability of brain areas to AD
An intriguing question in AD and other neurodegenerative disorders is why do some brain regions accumulate toxic protein aggregates and degenerate first. To gain potential insights into this, we analyzed pro- teomic differences between EC, PHC, TC, and FC in healthy control subjects.
Hierarchical clustering resulted in clear segregation of MTL and neocortical samples (Fig. 6A) that is consistent with the anatomical and functional differences of these regions. The MTL is involved primarily in memory functions (Squire et al., 2004), while the neocortex is rather related to cognitive processes (Rakic, 2009). MTL has high energy de- mands due to increased synaptic plasticity (memory formation and storage) and the presence of large neurons (Mosconi, 2013), which is in line with our results that metabolism-related pathways (metabolic pathways, oxidative phosphorylation, insulin signaling) and mi- tochondrial proteins were highly overrepresented in the cluster of proteins with augmented levels in MTL. Translation and proteasome pathways were also significantly enriched in MTL, indicating an ac- celerated proteostasis; as well as long-term potentiation that is con- sistent with EC and PHC involvement in memory formation (Fig. 6B).
Interestingly, Alzheimer's disease KEGG pathway was also found en- riched in the cluster of proteins overexpressed in MTL (22 proteins, p- value = 1.61e-7).
Remarkably, one of these AD proteins was APOE, the major genetic