1288
Expression Quantitative Trait Locus Analysis in Systemic Sclerosis Identifies New Candidate Genes Associated With Multiple Aspects of Disease Pathology
Martin Kerick,1 David González- Serna,1 Elena Carnero- Montoro,2 Maria Teruel,2 Marialbert Acosta- Herrera,1 Zuzanna Makowska,3 Anne Buttgereit,3 Sepideh Babaei,3 Guillermo Barturen,2 Elena López- Isac,1
PRECISESADS Clinical Consortium, Ralf Lesche,3 Lorenzo Beretta,4 Marta E. Alarcon- Riquelme,2 and Javier Martin1
Objective. To identify the genetic variants that affect gene expression (expression quantitative trait loci [eQTLs])
in systemic sclerosis (SSc) and to investigate their role in the pathogenesis of the disease.
Methods. We performed an eQTL analysis using whole- blood sequencing data from 333 SSc patients and 524
controls and integrated them with SSc genome- wide association study (GWAS) data. We integrated our findings from expression modeling, differential expression analysis, and transcription factor binding site enrichment with key clinical features of SSc.
Results. We detected 49,123 validated cis- eQTLs from 4,539 SSc- associated single- nucleotide polymorphisms
(SNPs) (P
GWAS< 10
−5). A total of 1,436 genes were within 1 Mb of the 4,539 SSc-associated SNPs. Of those 1,436 genes, 565 were detected as having ≥1 eQTL with an SSc-associated SNP. We developed a strategy to prioritize disease- associated genes based on their expression variance explained by SSc eQTLs (r
2> 0.05). As a result, 233 candidates were identified, 134 (58%) of them associated with hallmarks of SSc and 105 (45%) of them differentially expressed in the blood cells, skin, or lung tissue of SSc patients. Transcription factor binding site analysis revealed enriched motifs of 24 transcription factors (5%) among SSc eQTLs, 5 of which were found to be differentially regulated in the blood cells (ELF1 and MGA), skin (KLF4 and ID4), and lungs (TBX4) of SSc patients. Ten candidate genes (4%) can be targeted by approved medications for immune- mediated diseases, of which only 3 have been tested in clinical trials in patients with SSc.
Conclusion. The findings of the present study indicate a new layer to the molecular complexity of SSc, contributing
to a better understanding of the pathogenesis of the disease.
INTRODUCTION
Systemic sclerosis (SSc) is a chronic rheumatic autoimmune disease with a high degree of clinical heterogeneity that affects the
connective tissue (1), and with one of the highest mortality rates among rheumatic diseases (2). The pathogenesis of SSc is often characterized by a triad of hallmarks: immune dysfunction, fibro- sis, and vasculopathy. Immune dysfunction involves autoimmune
Presented by Mr. González- Serna in partial fulfillment of the requirements for a PhD degree, Institute of Parasitology and Biomedicine López- Neyra, CSIC, Granada, Spain.
Supported by the Innovative Medicines Initiative Joint Undertaking PRECISE Systemic Autoimmune Diseases Project (grant 115565), the Span- ish Ministry of Science and Innovation (grants RTI2018101332- B- 100 and SAF2015- 66761- P), and the Red de Investigación en Inflamación y Enfermedades Reumáticas through the Instituto de Salud Carlos III (grant RD16/0012/0013). The Genotype- Tissue Expression Project was supported by the National Cancer Institute, National Human Genome Research Institute, National Heart, Lung, and Blood Institute, National Institute on Drug Abuse, National Institute of Mental Health, and National Institute of Neurological Disorders and Stroke, NIH and by the NIH Common Fund. Mr. González- Serna’s work was supported by the Spanish Ministry of Economy and Competitiveness FPI Program (grant SAF2015- 66761- P). Dr. Acosta- Herrera’s work was supported by the Spanish Ministry of Science and Innovation Juan de la Cierva Incorporación Program (grant IJC2018- 035131- I).
1Martin Kerick, PhD, David González- Serna, MSc, Marialbert Acosta- Herrera, PhD, Elena López- Isac, PhD, Javier Martin, MD, PhD: Institute of
Parasitology and Biomedicine López- Neyra, CSIC, Granada, Spain; 2Elena Carnero- Montoro, PhD, Maria Teruel, PhD, Guillermo Barturen, PhD, Marta E. Alarcon- Riquelme, MD, PhD: Pfizer– University of Granada– Junta de Andalucía Centre for Genomics and Oncological Research, Granada, Spain; 3Zuzanna Makowska, PhD, Anne Buttgereit, PhD, Sepideh Babaei, PhD, Ralf Lesche, PhD: Bayer, Berlin, Germany; 4Lorenzo Beretta, MD:
Referral Center for Systemic Autoimmune Diseases, Fondazione IRCCS Ca’
Granda Ospedale Maggiore Policlinico di Milano, Milan, Italy.
Dr. Kerick and Mr. González- Serna contributed equally to this work. Drs.
Alarcon- Riquelme and Martin contributed equally to this work.
Drs. Makowska, Buttgereit, Babaei, and Lesche own stock or stock options in Bayer. No other disclosures relevant to this article were reported.
Address correspondence to Javier Martin, MD, PhD, Bases genéticas de las enfermedades autoinmunes, Instituto de Parasitología y Biomedicina, Parque Tecnológico de Ciencias de la Salud, Avenida del Conocimiento s/n 18016, Granada, Spain. Email: javiermartin@ipb.csic.es.
Submitted for publication June 19, 2020; accepted in revised form January 12, 2021.
processes and inflammation as a result of an imbalance in T cell, B cell, and macrophage activation (1). Fibrosis occurs as a result of the activation of fibroblasts, epithelial– mesenchymal transition, and excessive extracellular matrix deposition (3). Vasculopathy typically consists of a loss of small vessels followed by impaired compensatory vasculogenesis and angiogenesis (4). The relation- ship between immune dysfunction, vascular damage, and fibrosis remains fairly unknown.
Like most autoimmune diseases, SSc has a complex etiol- ogy and a poorly understood genetic component. In this regard, substantial efforts have been made to identify genetic features that contribute to disease susceptibility. To date, large- scale genetic studies have identified up to 27 loci associated with SSc at the genome- wide level of significance (P < 5.0 × 10⁻⁸) (5– 7), including the HLA region (8). Those studies provide invaluable information on disease etiopathogenesis, contributing to drug discovery and repurposing (9,10). Nevertheless, most of the single- nucleotide polymorphisms (SNPs) associated with SSc map to noncoding regions of the genome.
A number of SSc- associated loci could be involved in the regulation of gene expression, acting as expression quantita- tive trait loci (eQTLs), which have a widespread presence in the genome (11). Analysis of eQTLs can provide a mechanical link between a variant and its effect on gene expression, and mul- tiple eQTLs can be used to explain or model gene expression variance. In this regard, eQTL analyses have been successfully conducted in other autoimmune diseases such as systemic lupus erythematosus (SLE) and rheumatoid arthritis (RA), among oth- ers (12,13). Interestingly, variants mapped to noncoding enhancer regions across 6 autoimmune diseases led to the development of a multiple- enhancer variant hypothesis. According to this theory, the contribution of several SNPs in linkage disequilibrium at the same loci can influence multiple enhancers and be assigned to common pathways (12). Furthermore, eQTLs have been identi- fied in specific cell subsets (14) and have been applied to autoim- mune disease prognostics (15), which illustrates the relevance of these analyses in understanding the pathogenesis of the autoim- mune process. In this study, we aimed to explore the cis- genetic effects of SSc- associated risk loci on expression and performed an eQTL analysis using whole- blood RNA sequencing data from 857 samples.
PATIENTS AND METHODS
Patients and controls. For additional details regarding all methods, see the Supplementary Methods, available on the Arthritis & Rheumatology website at http://onlin elibr ary.wiley.
com/doi/10.1002/art.41657/ abstract. This study included 333 patients of European descent who were diagnosed as hav- ing SSc according to the American College of Rheumatology (ACR)/European Alliance of Associations for Rheumatology (EULAR) 2013 criteria (16) and were participants in the PRECISE
Systemic Autoimmune Diseases (PRECISEADS) project (https://
clini caltr ials.gov/ct2/show/NCT02 890134). See Appendix A for members of the PRECISESADS Clinical Consortium. A total of 524 age- and sex- matched controls without known autoimmune disease were selected. Patients and controls were randomly grouped into equal size discovery and validation sets, matched for age, sex, and medication use. Supplementary Table 1, availa- ble on the Arthritis & Rheumatology website at http://onlin elibr ary.
wiley.com/doi/10.1002/art.41657/ abstract, describes the charac- teristics of the 2 patient sets. All patients and controls gave written informed consent, which was approved by local ethics committees.
For additional details on ethics approvals, see the Supplementary Methods, available on the Arthritis & Rheumatology website at http://onlin elibr ary.wiley.com/doi/10.1002/art.41657/ abstract.
RNA sequencing and genotyping. RNA sequencing data were obtained and processed as described by Beretta et al (17).
Genetic data were obtained using the Illumina SNP chip genome- wide association study (GWAS) platforms HumanCore- 12- v1, Infinium CoreExome- 24v1- 2, and Infinium CoreExome- 24v1- 3.
Only SNPs typed on all 3 platforms were used for imputation and analysis. Samples were subjected to strict quality filtering ana- lyzed for ancestry and identity. Imputation was performed on the Michigan Imputation Server and filtered for quality, minor allele fre- quency (MAF) > 0.05, and Hardy- Weinberg equilibrium. Raw data are the property of the PRECISESADS Consortium. Metadata and aggregated data are available upon request from the correspond- ing author.
Detection of eQTLs. RNA- Seq and genetic data were checked to exclude mismatched samples using sex prediction and genotype mismatches using an in- house pipeline. Our anal- ysis was limited to 4,539 candidate SNPs that showed at least a suggestive level of association with SSc (PGWAS < 1 × 10⁻⁵ in the study by López- Isac et al [5]). SNPs with high linkage disequilib- rium (≥0.8) were added to the candidate SNPs, totaling 13,253 SNPs. We used the Matrix eQTL R package (18) and fit a lin- ear regression model that tests the influence of the number of risk alleles on gene expression residuals obtained by correcting for potential confounders (i.e., population substructure) using the strategy described by Westra et al (12) based on principal com- ponents. For SNPs with a MAF of <0.1, we additionally calculated a dominant model to keep in check excessive influence of low numbers of homozygotes of the minor allele. The eQTLs of SNPs with a MAF of <0.1 were discarded if they were not significant at a false discovery rate (FDR) of <0.05 in both the linear and dom- inant models.
Our analyses were focused on cis- eQTLs in a window of 1 mil- lion bp around the transcription start site of a gene, which implies 1,436 genes, given the 13,253 candidate SNPs. The eQTLs were identified for the SSc and control groups separately to avoid inter- action effects, and we split the groups equally into discovery and
replication sets. An FDR of <0.05 defined significant genetic effects on gene expression. The eQTLs were considered validated if they were found in 2 sets, using a stringent cutoff (FDR <0.05) in one set and a nominal P value cutoff (P < 0.05) in the other. To expand on sensitivity and to aid finding SSc- specific eQTLs we created a “val- idated across groups” set of eQTLs, using the strategy described above, but this time validating eQTLs obtained from all SSc sam- ples with eQTLs obtained from all control samples and vice versa.
In the first run, eQTLs and genes whose expression was associ- ated with ≥1 eQTL (eGenes) were detected for SNPs associated with SSc. In the second run, we detected eQTLs for all SNPs within a distance of 1 Mb of an eGene detected in the first run, including SNPs unrelated to SSc.
SSc eQTLs were identified as “SSc- specific” if the eQTL was validated using the 2 SSc subsets and was not found in any of the control data sets or the validated- across- groups data set at a nominal cutoff level of 0.1. Candidate SSc- specific eQTLs were compared to public databases of blood eQTLs from healthy sub- jects (Genotype- Tissue Expression [GTEx] Project V7) (11,12);
27% of these eQTLs had proxy SNPs, which were found with their respective gene in one of these databases and were no longer considered SSc- specific. We repeated eQTL detection for the subset of SSc patients who had received no known medication, following the discovery and replication strategy described above to find additional SSc- specific eQTLs.
Stepwise linear regression (forward selection). Inde- pendent eQTL signals that influence the expression of a gene were determined following a stepwise linear regression procedure.
Forward selection was repeated until no additional signal was detected at a nominal P level of P < 0.05. This was done for SNP–
eGene combinations obtained from the analysis described above.
Differential expression analysis. The edgeR package in R was used to calculate differential expression in the 7 most abundant cell types using cellular composition of whole blood as a covariate, as estimated from expression profiles using CIBER- SORT (19). Additional covariates were disease, sex, age, medica- tion, and age– cell, medication– cell, disease– sex, and disease– age interactions. For additional details, see the Supplementary Meth- ods, available on the Arthritis & Rheumatology website at http://
onlin elibr ary.wiley.com/doi/10.1002/art.41657/ abstract. Differen- tial expression data for skin and lung tissues were obtained either from published tables (20,21) or by using the default analysis in GEO (GEO2R) with the GSE58095 data set comparing all cases against all controls.
Transcription factor binding site analysis. Only the SSc- associated SNPs (PGWAS < 10−5) that were part of the best expression models obtained by stepwise linear regression analy- sis (forward selection) were analyzed. Using the R package TFB- STools (22), we obtained all potential transcription factor binding
sites and scored the effect of each SNP on transcription factor binding. If enrichment was significant (FDR <0.1) for ≥3 scores, the overall enrichment of the particular transcription factor bind- ing site was considered significant. To calculate enrichment, Fish- er’s exact test was performed with a random selection of 50,000 eQTLs from the GTEx database V7 (matched for MAF and dis- tance to transcription start site) as background.
Drug target analysis. We retrieved 2,384 different drugs and their 1,138 target genes from the Open Targets database in October 2019. Medications used for rheumatic and skin- related diseases were extracted from the same database, yielding 542 drugs currently used to treat these diseases.
Tissue enrichment analysis. A baseline enrichment of blood eQTLs was calculated in all tissues using the GTEx data- base V7. Using a z- test, we investigated whether the enrichment of blood eQTLs obtained in this study was even higher than the baseline enrichment of all tissues.
RESULTS
Study design, gene and eQTL numbers, and com parison to external data sets. We aimed to explore the cis- genetic effects of SSc- associated risk loci on expression in SSc and control data sets to detect potential disease- specific eQTLs and to model gene expression variation for gene prioritization. Pri- oritized genes were analyzed for SSc hallmarks and drug repur- posing, and selected eQTLs were analyzed for transcription factor binding site and tissue enrichment. Supplementary Figure 1, avail- able on the Arthritis & Rheumatology website at http://onlin e library.wiley.com/doi/10.1002/art.41657/ abstract, gives an over- view of all analyses performed.
A total of 18,507 and 38,600 replicated cis- eQTLs were identified in SSc patients and controls, respectively, affect- ing the expression of 137 and 200 genes (eGenes), respec- tively. After validating across groups of eQTLs found in all SSc patients with eQTLs found in controls, and vice versa, a total of 49,123 eQTLs were identified, influencing 236 eGenes with a median of 73 eQTLs per gene. The maximum number of eGenes detected in any of the data sets at a nominal level (P < 0.01) was 565, among them 64 long noncoding RNAs like XXbac- BPG181B23.7 (lnc- HLA– B- 2:3), TAPSAR1, or HCG11 (see Supplementary Table 2, available on the Arthri- tis & Rheumatology website at http:// onlin e libr ary.wiley.com/
doi/10.1002/art.41657/ abstract).
The eQTLs (a) of the 2 discovery sets, (b) validated across groups, and (c) at the intersection of validated control and vali- dated SSc eQTLs were compared against the GTEx database, and 66%, 15%, and 8% unknown eQTLs, respectively, were found, which depicts the different levels of stringency of our setup.
Of interest, 95% of the eQTLs in our whole- blood data set that
overlapped with the GTEx database were found in multiple tissues according to GTEx.
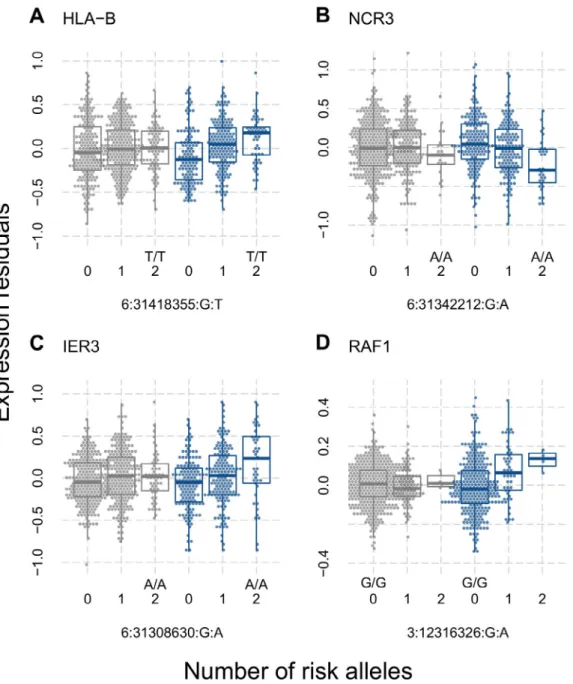
SSc- specific eQTLs. The eQTLs replicated in SSc whole blood were compared to eQTLs observed in control data sets with low stringency (nominal P < 0.1). We found 59 eQTLs from 16 genes potentially specific to SSc. Repeating our analysis in a subset of patients who did not receive immunomodulating drugs revealed 28 additional eQTLs and 6 additional genes. In- depth comparison to known blood eQTLs from heathy controls (GTEx V7) (11,12) and their proxies (r2 > 0.8) excluded 24 eQTLs
(27%) from being SSc- specific. Careful examination suggested eQTLs from HLA– B, NCR3, RAF1, NEU1, HLA– DQA1, HLA–
DOB, HID1, and IER3 to be the best candidates for SSc- specific eQTLs (Figure 1 and Supplementary Figure 2, available on the Arthritis & Rheumatology website at http://onlin elibr ary.wiley.com/
doi/10.1002/art.41657/ abstract).
Enrichment of blood eQTLs in tissues affected by dis
ease. We explored whether the validated blood eQTLs from SSc patients could be interpreted in other contexts beyond immunity.
The GTEx database provides a comprehensive overview of eQTL
Figure 1. Expression quantitative trait loci found in patients with systemic sclerosis (SSc) (blue) but not in controls (gray). Residual expression levels, determined using principal components analysis, of the genes HLA– B (A), NCR3 (B), IER3 (C), and RAF1 (D) are shown for the indicated genotypes in controls and SSc patients. The number of minor alleles, the risk genotype, and single- nucleotide polymorphisms are indicated on the x- axis. Data are shown as box plots. Each box represents the 25th to 75th percentiles. Lines inside the boxes represent the median. Lines outside the boxes represent the 10th and 90th percentiles. Circles represent individual subjects.
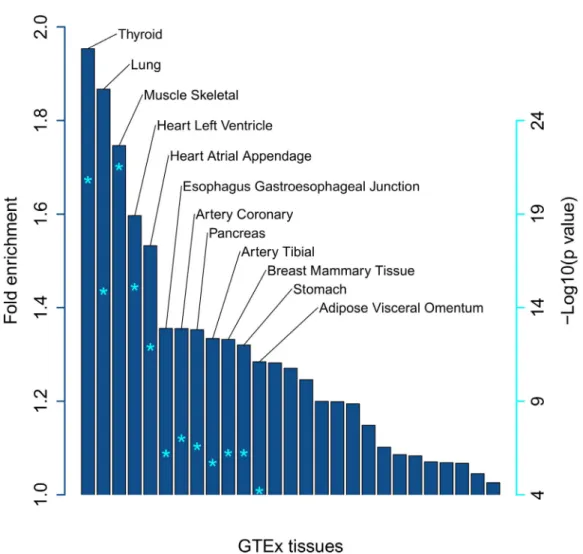
sharing among 49 different tissues. Using a meta- analysis pub- lished by GTEx V7, we found that only 6% of eQTLs are tissue- specific, 81% have been detected in ≥5 tissues, and 15% are present in >90% of tissues. This clearly shows that eQTLs detected in blood can be interpreted functionally in other tissues. Indeed, 95% of the GTEx- known eQTLs detected in this study are found in ≥10 different tissues apart from blood. We investigated whether the eQTLs identified in our study were enriched in the GTEx eQTLs of non- blood tissues to test our assumptions on interpretability beyond the context of whole blood. A significant enrichment was found in 19 tissues (Figure 2), the majority of which can readily be interpreted in the context of SSc, as the disease affects many tissues, such as the lungs, heart, and esophagus.
Expression variance explained (EVE) can be used to prioritize SSc eQTLs and SSc eGenes. While many eGenes with an SSc- specific eQTL can probably explain the pathogenesis of SSc at least partially (Supplementary Table 2, available on the Arthritis &
Rheumatology website at http://onlin elibr ary.wiley.com/doi/10.1002/
art.41657/ abstract), we decided to focus on the candidate eGenes that are most affected by SSc genetics.
To measure the influence of genetics on gene expression, we used a stepwise modeling procedure to obtain independent eQTLs per gene and calculate the EVE. Comparing the EVE using only SSc- specific eQTLs (EVESSc) against the EVE using all eQTLs (EVEall; including eQTLs unrelated to SSc) we obtained a meas- ure (ratio) of how much EVE can be attributed to SSc genetics.
Figure 3A depicts a comparison of the 2 calculated EVE values.
For 104 eGenes (18%), the EVE differed by <30%. One hundred thirty eGenes (23%) showed stronger differences in EVE, but still had an EVESSc of >0.05 (r2 > 0.05). The remaining 331 eGenes had a low EVESSc (< 0.05), and the EVE differed by >30%. This comparison distinguished 3 groups with high, intermediate, and low influence of SSc genetics.
Three groups of eGenes were identified based on the impact that SSc genetics had on their expression. We analyzed these
Figure 2. Enrichment of blood expression quantitative trait loci in disease- relevant tissues in patients with systemic sclerosis. Asterisks inside the bars indicate the level of significance adjusted for multiple testing (false discovery rate), corresponding to the values shown on the right.
GTEx = Genotype- Tissue Expression.
groups for enriched pathways (FDR < 0.05) (Supplementary Tables 3 and 4, available on the Arthritis & Rheumatology website at http://
onlin elibr ary.wiley.com/doi/10.1002/art.41657/ abstract), and bio- logic processes from gene ontology, and found that 52% of eGenes in the high- or intermediate- impact group (122 of 233) were located in immune- related pathways, as compared to only 17% of eGenes in the low- impact group (Supplementary Table 2). An in- depth review of the literature and gene ontologies helped us assign 66 and 31 eGenes to SSc- related biologic processes linked to fibrosis and vas- culopathy, respectively. Many of these eGenes belong to the high- or intermediate- impact group (Figures 3B– D). The eGenes for which SSc genetics have an intermediate or high impact on expression are most likely to shed light on the complex pathology of this disease.
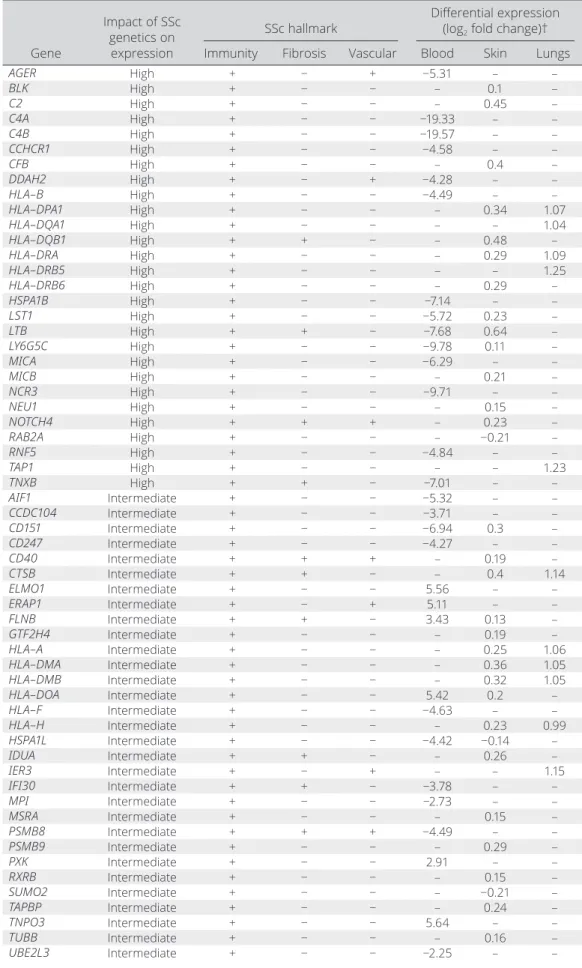
SSc eGenes grouped by the hallmarks of SSc pathogenesis. Three features of SSc pathogenesis can be attributed to 134 of the 233 eGenes (58%) for which SSc genetics had an intermediate- to- high impact on expression, namely: alter- ation of immune response, fibrosis, and vasculopathy (Table 1 and Supplementary Table 2). The genes implicated in innate and adap- tive immune cell processes represent the largest subgroup, with 122 eGenes. Interestingly, 27 HLA eGenes and 8 eGenes related to interferon (IFN) pathways were identified, including important SSc- associated susceptibility loci dysregulated in SSc (9,23,24).
Furthermore, there were 27 SSc eGenes associated with biologic processes related to fibrosis, and 16 eGenes related to vascu- lopathy or angiogenesis. These pathways are considered to be Figure 3. Gene expression variance explained by expression quantitative trait loci (eQTLs) can distinguish levels of influence of systemic sclerosis (SSc) genetics on expression and prioritize genes affected by eQTLs. The expression variance explained (r2) by eQTLs associated with SSc in a recent genome- wide association study (using single- nucleotide polymorphisms [SNPs] with association P < 10−5) (5) was plotted against the expression variance explained by all eQTLs found within 1 Mb of a gene, whether or not they were associated with SSc. A, Groups of eGenes showing strong (red), intermediate (yellow), or weak (blue) influence of SSc genetics. B– D, Same eGenes as shown in A. Highlighted are eGenes related to B, fibrosis (yellow), C, vascular processes (red), and D, immunity (blue). The eGenes not related to any of these hallmarks are depicted in black.
Table 1. Differentially expressed eGenes associated with hallmarks of SSc*
Gene
Impact of SSc genetics on
expression
SSc hallmark Differential expression (log2 fold change)†
Immunity Fibrosis Vascular Blood Skin Lungs
AGER High + − + −5.31 – –
BLK High + − − – 0.1 –
C2 High + − − – 0.45 –
C4A High + − − −19.33 – –
C4B High + − − −19.57 – –
CCHCR1 High + − − −4.58 – –
CFB High + − − – 0.4 –
DDAH2 High + − + −4.28 – –
HLA– B High + − − −4.49 – –
HLA– DPA1 High + − − – 0.34 1.07
HLA– DQA1 High + − − – – 1.04
HLA– DQB1 High + + − – 0.48 –
HLA– DRA High + − − – 0.29 1.09
HLA– DRB5 High + − − – – 1.25
HLA– DRB6 High + − − – 0.29 –
HSPA1B High + − − −7.14 – –
LST1 High + − − −5.72 0.23 –
LTB High + + − −7.68 0.64 –
LY6G5C High + − − −9.78 0.11 –
MICA High + − − −6.29 – –
MICB High + − − – 0.21 –
NCR3 High + − − −9.71 – –
NEU1 High + − − – 0.15 –
NOTCH4 High + + + – 0.23 –
RAB2A High + − − – −0.21 –
RNF5 High + − − −4.84 – –
TAP1 High + − − – – 1.23
TNXB High + + − −7.01 – –
AIF1 Intermediate + − − −5.32 – –
CCDC104 Intermediate + − − −3.71 – –
CD151 Intermediate + − − −6.94 0.3 –
CD247 Intermediate + − − −4.27 – –
CD40 Intermediate + + + – 0.19 –
CTSB Intermediate + + − – 0.4 1.14
ELMO1 Intermediate + − − 5.56 – –
ERAP1 Intermediate + − + 5.11 – –
FLNB Intermediate + + − 3.43 0.13 –
GTF2H4 Intermediate + − − – 0.19 –
HLA– A Intermediate + − − – 0.25 1.06
HLA– DMA Intermediate + − − – 0.36 1.05
HLA– DMB Intermediate + − − – 0.32 1.05
HLA– DOA Intermediate + − − 5.42 0.2 –
HLA– F Intermediate + − − −4.63 – –
HLA– H Intermediate + − − – 0.23 0.99
HSPA1L Intermediate + − − −4.42 −0.14 –
IDUA Intermediate + + − – 0.26 –
IER3 Intermediate + − + – – 1.15
IFI30 Intermediate + + − −3.78 – –
MPI Intermediate + − − −2.73 – –
MSRA Intermediate + − − – 0.15 –
PSMB8 Intermediate + + + −4.49 – –
PSMB9 Intermediate + − − – 0.29 –
PXK Intermediate + − − 2.91 – –
RXRB Intermediate + − − – 0.15 –
SUMO2 Intermediate + − − – −0.21 –
TAPBP Intermediate + − − – 0.24 –
TNPO3 Intermediate + − − 5.64 – –
TUBB Intermediate + − − – 0.16 –
UBE2L3 Intermediate + − − −2.25 – –
(Continued)
potential targets of future disease- modifying therapies for SSc (25). Of interest, we also found 25 eGenes related to apoptotic processes, which support the hypothesis of a relevant role of apoptosis in SSc (26).
Differential expression of SSc eGenes in disease- affected tissues. Given that the SSc- specific eQTLs detected in whole blood were observed to be enriched in other tissues affected by the disease, we decided to analyze the expression of the prioritized 233 SSc eGenes in the skin, lungs, and 7 blood cell types using public data sets (20,21) (GSE58095) and our whole- blood data set, with deconvolution of blood cell compo- sitions. The data are presented in Table 1 and Supplementary Table 2.
One hundred five SSc eGenes (45%) were found to be dif- ferentially regulated in one of the tissues investigated. A total of 57 SSc eGenes (24%) were down- regulated in 1 of the 3 tissues investigated, whereas 55 SSc eGenes (24%) were up- regulated.
In addition, 40 SSc eGenes (17%) were differentially expressed in the skin of SSc patients. A total of 11 eGenes (5%) were found to be differentially regulated in the lung samples and lung fibroblast cultures from SSc patients. Differential expression analysis of 7 blood cell types in SSc revealed 72 SSc eGenes (31%), most of which (99%) showed a consistent direction of regulation (up or down) in ≥5 cell types.
Results of transcription factor binding site analysis.
We investigated transcription factor binding site enrichment in SSc eQTLs. Only the independent eQTLs included in the models that best predicted eGene expression, as determined by stepwise linear regression, were included. Then, transcription factor bind- ing site enrichment was estimated, as compared to genome- wide eQTLs from the GTEx database, to control for the fact that all transcription factor binding site motifs are highly enriched in eQTL sites in general.
Of the 537 transcription factor binding site profiles assessed (JASPAR database 2018), 24 (5%) were stably enriched (see Patients and Methods) in best- model SSc eQTLs (Supplementary
Table 5, available on the Arthritis & Rheumatology website at http://onlin elibr ary.wiley.com/doi/10.1002/art.41657/ abstract).
The transcription factors were of different classes, with 5 home- odomain transcription factors, 4 transcription factors of the T- box type, 4 C2H2 transcription factors, and 2 GATA transcription fac- tors, to name only those with multiple members of the same class.
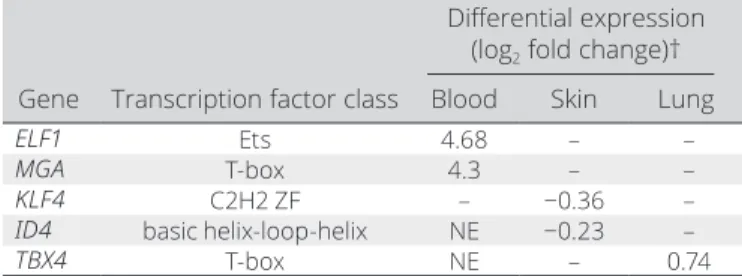
Of the 24 transcription factors, we found 10 and 16 transcription factors expressed in whole blood and skin, respectively, of which 5 transcription factors were differentially regulated (FDR < 0.1) in the skin, lungs, or blood cells from SSc patients (Table 2). KLF4 and ID4 were down- regulated in the skin, TBX4 was up- regulated in the lungs, and ELF and MGA were up- regulated in almost all of the 7 blood cell types assessed (Figure 4 and Supplementary Table 5 and Supplementary Figure 3, available on the Arthritis & Rheu- matology website at http://onlin elibr ary.wiley.com/doi/10.1002/
art.41657/ abstract).
Drug repurposing. We explored whether any of the 233 eGenes prioritized in the present study encode target proteins of drugs being tested in ongoing clinical trials, as reported on the Open Targets platform (27). We observed that 15 of the 233 eGenes (6.4%) overlapped with pharmacologic targets of which TNF, BLK, and TUBB have been tested in clinical trials in SSc patients.
Gene
Impact of SSc genetics on expression
SSc hallmark Differential expression (log2 fold change)†
Immunity Fibrosis Vascular Blood Skin Lungs
UNC119B Intermediate + + − 2.33 – –
CLIC1 Intermediate − + − −2.9 – –
FLOT1 Intermediate − + − −4.9 0.28 –
PHF1 Intermediate − + − −3.38 – –
RPS18 Intermediate − + − −9.34 – –
SYNGAP1 Intermediate − + − 3.5 – –
UQCC2 Intermediate − + − −5.03 – –
* eGenes = genes whose expression was associated with ≥1 expression quantitative trait loci; SSc = systemic sclerosis.
† Adjusted P < 0.1 for all values shown.
Table 1. (Cont’d)
Table 2. Differentially expressed transcription factors with enriched binding sites in SSc- associated eQTLs in expression models*
Differential expression (log2 fold change)†
Gene Transcription factor class Blood Skin Lung
ELF1 Ets 4.68 – –
MGA T- box 4.3 – –
KLF4 C2H2 ZF – −0.36 –
ID4 basic helix- loop- helix NE −0.23 –
TBX4 T- box NE – 0.74
* SSc = systemic sclerosis; eQTLs = expression quantitative trait loci;
NE = not expressed (source: European Bioinformatics Institute Gene Expression Atlas).
† Adjusted P < 0.1 for all values shown.
Next, we tested whether medications used for other immune- mediated diseases (105 antibody- targeted, 48 kinase inhibitor–
targeted, and 195 receptor- targeted drugs; see Patients and Methods) addressed the proteins coded by the SSc eGenes, and we found 5 additional SSc eGenes: LTA, LTB, IL12A, CD40, and RXRB. Further investigation identified ERAP1 and ERAP2, which can be addressed by aminopeptidase inhibitors.
Expression analysis in whole blood, skin, and lung tissues revealed that 6 of the 10 drug- target SSc- specific eGenes are dif- ferentially regulated in the blood cells and/or skin of SSc patients (Supplementary Table 6 and Supplementary Figure 4, available on the Arthritis & Rheumatology website at http://onlin elibr ary.
wiley.com/doi/10.1002/art.41657/ abstract). In the blood cells of SSc patients, ERAP1 was up- regulated, whereas LTB was
down- regulated. LTB, CD40, RXRB, BLK, and TUBB were up- regulated in the skin of SSc patients. In summary, 7 genes that have been considered for the treatment of conditions similar to SSc are potential candidates for study in clinical trials for SSc.
DISCUSSION
In this study, the integrated analysis of expression and genetic data in a large SSc cohort identified novel eQTLs in the whole blood of SSc patients, which are enriched in disease- relevant tissues. We found 64 eQTLs potentially specific to SSc, which were not found in either our cohort of healthy controls or any of the public blood eQTL databases (GTEx V7) (11,12). This find- ing suggests that additional mechanisms exist that render these Figure 4. Differential expression of the transcription factors ELF1, MGA, KLF4, and ID4 in patients with systemic sclerosis (SSc) compared to controls. A and B, Residual expression of ELF1 in neutrophils (A) and MGA in monocytes (B) from controls and SSc patients. Values on the x- axis are the percentage of cells investigated per patient as obtained from the Cell- type Identification by Estimating Relative Subsets of Known RNA Transcripts (CIBERSORT) algorithm. ELF1 and MGA were up- regulated in SSc patient tissues. C and D, Log2 expression of KLF4 (C) and ID4 (D) in skin from controls and SSc patients. KLF4 and ID4 were down- regulated in SSc patient tissues. Data are shown as box plots. Each box represents the 25th to 75th percentiles. Lines inside the boxes represent the median. Lines outside the boxes represent the 10th and 90th percentiles. Circles represent individual subjects.
eQTLs active in disease and neutral in healthy subjects. The most likely explanation is the differential expression of transcription fac- tors associated with a disease, as has been suggested previously (28,29). Indeed, we showed that of 24 transcription factors asso- ciated with SSc by our analysis of transcription factor binding site enrichment, ≥5 were differentially expressed in disease- relevant tissues. The eQTL analysis of the most likely associated SSc risk loci, prioritizing genes (eGenes) where SSc eQTLs explain >5%
of expression variance, led to a strong enrichment of immunity- related genes, vasculopathy, and fibrosis. Finally, the findings were integrated with current knowledge of SSc pathology, thereby identifying useful candidates for drug repurposing.
One of the main findings of the present study is that we could assign more than half of the eGenes (n = 134) to hallmarks of SSc pathogenesis. Interesting candidates were related to immune system processes, fibrosis, and vascular pathologies. Immune system processes highlighted eGenes like CD247 or BLK, both of them previously associated with SSc and several autoimmune diseases such as RA or SLE (7,30,31). Regarding IFN- associated eGenes, we identified IRF5 and the 2 IL12 receptors, IL12RA and IL12RB, which are well- established SSc risk loci, and are also associated with other autoimmune diseases such as RA, SLE, and myositis (6,32,33). With regard to fibrosis, TNXB is implicated in the regulation of the production and assembly of certain types of collagen (34). TNXB is also the main causative gene in Ehlers- Danlos syndrome, which is characterized by altered skin elastic- ity, among other symptoms (35). The eGenes associated with vasculopathy or angiogenesis included NOTCH4, a non- classic HLA gene in the class II region that regulates NOTCH1 and has previously been associated with SSc (36,37), and CD151, which is linked to vascular stability and neo- angiogenesis (38). Finally, regarding inflammatory processes, C4A and C4B are part of the complement system affected by active disease in a number of autoimmune diseases (39). Interestingly, a recent study demon- strated the relevance of the copy number and resulting expression levels of C4A and C4B, as well as their contribution to sex- biased vulnerability in autoimmunity (40). In this regard, the eQTLs described in our study could be acting either as a proxy to C4A- C4B copy numbers or as an additional mechanism regulating the complex variation of complement genes.
Interestingly, we found 25 eGenes related to apoptosis pro- cesses. Previous genetic studies have indicated that apoptosis is an important mechanism of the disease, revealing the association of some genes, such as DNASE1L3 or TNFAIP3, with a higher risk of SSc (6,41). We confirm here DNASE1L3, which plays an important role in DNA fragmentation during apoptosis (42), as an interesting candidate. Another eGene observed with a particu- lar role in apoptosis was BAK1, which encodes for Bcl- 2 antag- onist or killer (BAK), one of the principal proapoptotic proteins of the mitochondrial pathway (43). Interestingly, a recent study showed that dermal fibroblasts derived from patients with SSc become particularly susceptible to apoptosis induced by mimetic
drugs of proapoptotic protein Bcl- 2 homology 3, a direct activator of BAK, reducing the fibrotic process (44). Thus, even though the specific pathogenic process of apoptosis in SSc is still unknown, our results support its role in SSc, which could be key to revers- ing fibrosis as part of the tissue regeneration process.
It is noteworthy that 50% of the SSc eGenes associated with SSc hallmarks overlap with >1 group (Supplementary Table 2).
This is not surprising, given that, for example, fibrosis, angiogen- esis, and inflammation are closely linked, which demonstrates the complexity of the pathogenesis of SSc. Alternatively, there was significant enrichment of eQTLs in 19 tissues, most of them inter- pretable in the context of SSc, which affects tissues such as the lungs, cardiac tissue, and esophagus (1).
A total of 24 transcription factor binding sites were stably enriched in best- model SSc- specific eQTLs. In this regard, the tran- scription factor ELF1 (E74- like ETS transcription factor 1) deserves special mention, as it was also found to be differentially up- regulated in almost all 7 blood cell types assessed. ELF1 belongs to the ETS family of transcription factors that regulate the expression of a wide range of genes and play an important role in immune cell devel- opment and function and in angiogenesis (45,46). This transcrip- tion factor activates the expression of several T cell genes. One of them is the gene encoding the ζ chain of the T cell receptor (TCR), a molecule with a primary function in the transduction of intracellular signals that influence positive and negative selection of T cells upon TCR ligation (47). On the other hand, ELF1 also plays an important role in B cells by cooperating with members of the activator protein 1 family of transcription factors to activate the 3′ immunoglobulin heavy- chain enhancer upon IgM stimulation, which could contrib- ute to class- switch recombination (48). Of note, our enrichment analysis of transcription factor binding sites has to be interpreted with caution as the independence assumption of Fisher’s exact test might not be fully met, since stepwise modeling does not nec- essarily generate independent loci for enrichment analysis.
Candidate eGenes identified here overlap with eQTL anal- yses performed in other autoimmune diseases, further support- ing our results and manifesting the shared genetic component of autoimmune diseases. Some eGenes, such as BLK, GSDMB, and ORMDL3 which have been described to be involved in RA (49), KRT8P46, GSDMB, and ORMDL3 in multiple sclerosis (MS) (50), ANO9 and BLK in SLE (51), and GSMDA, GSDMB, and ORMDL3 in type 1 diabetes mellitus (52), were also significantly associated in our study.
Given the surprisingly high amount of candidate genes that warrant further studies, it is important to address the limits of this study. First, this study focused on bulk RNA- Seq and identified eQTLs present in the most abundant blood cell types. Although tools like CIBERSORT can successfully estimate the abundance of various cell types present, the number of samples needed to identify cell- specific eQTLs even in the most abundant cell types using bulk RNA- Seq are still prohibitive (12). Second, although we highlight genes for which interpretation in the context of the
disease is best understood in tissues other than blood, single- cell studies in SSc- affected tissues are needed to confirm and expand our findings. Last, we did not distinguish between the most com- mon forms of SSc (limited cutaneous and diffuse cutaneous), nor did we analyze data on autoantibodies, as data were only avail- able for a subset of the samples and would have severely dimin- ished the sensitivity of our analysis.
The validation of the eQTLs identified from peripheral blood mononuclear cells (PBMCs) in other tissues as presented in the GTEx database opens the way to cautiously use blood eQTLs as a proxy to detect eQTLs that most likely exert their main effect in tissues other than blood. Interestingly, Beretta et al recently observed a strong enrichment of several IFN- related pathways in the first whole- blood transcriptome profiling performed in a large cohort of SSc patients (17). Furthermore, a recent analysis of whole transcriptome expression in the skin of patients with early diffuse SSc revealed a high prevalence of both innate and adap- tive immune cell activity (53). These results are concordant with the clear enrichment of immunity- related eGenes observed in our study and represent a support of the use of PBMC expression data as surrogate markers of organ disease.
To sum up, this is the first eQTL analysis performed in PBMCs of SSc patients, revealing that more than half of the eGenes detected were associated with the most important SSc hallmarks and highlighting the apoptotic process. Furthermore, we identi- fied enriched motifs for transcription factors in SSc eQTLs that are differentially regulated in blood, skin, or the lungs. Our results highlight the role of the clinical features and tissues involved in SSc, adding a new layer of complexity and contributing to a better understanding of SSc pathogenesis.
ACKNOWLEDGMENTS
We greatly acknowledge the expert technical assistance of Gemma Robledo Pérez (Institute of Parasitology and Biomedicine López- Neyra [IPBLN]– CSIC), Sofía Vargas Roldán (IPBLN- CSIC), Sonia Molinero García (IPBLN- CSIC), Belén Martínez García (Pfizer– University of Granada– Junta de Andalucía Centre for Genomics and Oncological Research [GENYO]), the staff of the genomics unit (GENYO), and Martina Runge (Bayer).
AUTHOR CONTRIBUTIONS
All authors were involved in drafting the article or revising it critically for important intellectual content, and all authors approved the final version to be published. Dr. Martin had full access to all of the data in the study and takes responsibility for the integrity of the data and the accuracy of the data analysis.
Study conception and design. Kerick, González- Serna, Acosta- Herrera, López- Isac, Alarcon- Riquelme, Martin.
Acquisition of data. Makowska, Buttgereit, Babaei, Lesche, Alarcon- Riquelme, Martin.
Analysis and interpretation of data. Kerick, González- Serna, Carnero- Montoro, Teruel, Barturen, Beretta, Alarcon- Riquelme, Martin.
ADDITIONAL DISCLOSURES
Authors Makowska, Buttgereit, Babaei, and Lesche are employees of Bayer.
REFERENCES
1. Denton CP, Khanna D. Systemic sclerosis. Lancet 2017;390:1685– 99.
2. Barnes J, Mayes MD. Epidemiology of systemic sclerosis: incidence, prevalence, survival, risk factors, malignancy, and environmental trig- gers. Curr Opin Rheumatol 2012;24:165– 70.
3. Bhattacharyya S, Wei J, Varga J. Understanding fibrosis in systemic sclerosis: shifting paradigms, emerging opportunities [review]. Nat Rev Rheumatol 2012;8:42– 54.
4. Allanore Y, Distler O, Matucci- Cerinic M, Denton CP. Defining a unified vascular phenotype in systemic sclerosis [review]. Arthritis Rheumatol 2018;70:162– 70.
5. López- Isac E, Acosta- Herrera M, Kerick M, Assassi S, Satpathy AT, Granja J, et al. GWAS for systemic sclerosis identifies multiple risk loci and highlights fibrotic and vasculopathy pathways. Nat Commun 2019;10:1– 14.
6. Mayes MD, Bossini- Castillo L, Gorlova O, Martin JE, Zhou X, Chen WV, et al. Immunochip analysis identifies multiple susceptibility loci for systemic sclerosis. Am J Hum Genet 2014;94:47– 61.
7. Radstake TR, Gorlova O, Rueda B, Martin JE, Alizadeh BZ, Palomino- Morales R, et al. Genome- wide association study of sys- temic sclerosis identifies CD247 as a new susceptibility locus [letter].
Nat Genet 2010;42:426– 9.
8. Gourh P, Safran SA, Alexander T, Boyden SE, Morgan ND, Shah AA, et al. HLA and autoantibodies define scleroderma subtypes and risk in African and European Americans and suggest a role for molecular mimicry. Proc Natl Acad Sci U S A 2020;117:552– 62.
9. Acosta- Herrera M, López- Isac E, Martín J. Towards a better classi- fication and novel therapies based on the genetics of systemic scle- rosis [review]. Curr Rheumatol Rep 2019;21:1– 7.
10. Casares- Marfil D, Martín J, Acosta- Herrera M. Genomic opportu- nities for drug repositioning in systemic seropositive rheumatic dis- eases [review]. Expert Rev Clin Immunol 2020;16:343– 6.
11. Lappalainen T, Sammeth M, Friedländer MR, ’T Hoen PA, Monlong J, Rivas MA, et al. Transcriptome and genome sequencing uncovers functional variation in humans. Nature 2013;501:506– 11.
12. Westra HJ, Peters MJ, Esko T, Yaghootkar H, Schurmann C, Kettunen J, et al. Systematic identification of trans eQTLs as putative drivers of known disease associations. Nat Genet 2013;
45:1238– 43.
13. Odhams CA, Graham DS, Vyse TJ. Profiling RNA- Seq at multiple resolutions markedly increases the number of causal eQTLs in auto- immune disease. PLoS Genetics 2017;17:1– 31.
14. Schmiedel BJ, Singh D, Madrigal A, Valdovino- Gonzalez AG, White BM, Zapardiel- Gonzalo J, et al. Impact of genetic poly- morphisms on human immune cell gene expression. Cell 2018;
175:1701– 15.
15. Lee JC, Espéli M, Anderson CA, Linterman MA, Pocock JM, Williams NJ, et al. Human SNP links differential outcomes in inflam- matory and infectious disease to a FOXO3- regulated pathway. Cell 2013;155:57– 69.
16. Van den Hoogen F, Khanna D, Fransen J, Johnson SR, Baron M, Tyndall A, et al. 2013 classification criteria for systemic sclerosis: an American College of Rheumatology/European League Against Rheu - matism collaborative initiative. Arthritis Rheum 2013;65:2737– 47.
17. Beretta L, Barturen G, Vigone B, Bellocchi C, Hunzelmann N, De Langhe E, et al. Genome- wide whole- blood transcriptome profiling in a large European cohort of systemic sclerosis patients. Ann Rheum Dis 2020;79:1218– 26.
18. Shabalin AA. Matrix eQTL: ultra fast eQTL analysis via large matrix operations. Bioinformatics 2012;28:1353– 8.
19. Newman AM, Liu CL, Green MR, Gentles AJ, Feng W, Xu Y, et al.
Robust enumeration of cell subsets from tissue expression profiles.
Nat Methods 2015;12:453– 7.
20. Hsu E, Shi H, Jordan RM, Lyons- Weiler J, Pilewski JM, Feghali- Bostwick CA. Lung tissues in patients with systemic sclerosis have gene expression patterns unique to pulmonary fibrosis and pulmo- nary hypertension. Arthritis Rheum 2011;63:783– 94.
21. Assassi S, Swindell WR, Wu M, Tan FD, Khanna D, Furst DE, et al.
Dissecting the heterogeneity of skin gene expression patterns in sys- temic sclerosis. Arthritis Rheumatol 2015;67:3016– 26.
22. Tan G, Lenhard B. TFBSTools: an R/bioconductor package for transcription factor binding site analysis. Bioinformatics 2016;32:
1555– 6.
23. Mahoney JM, Taroni J, Martyanov V, Wood TA, Greene CS, Pioli PA, et al. Systems level analysis of systemic sclerosis shows a network of immune and profibrotic pathways connected with genetic poly- morphisms. PLoS Comput Biol 2015;11:e1004005.
24. Skaug B, Assassi S. Type I interferon dysregulation in systemic scle- rosis. Cytokine 2019;132:154635.
25. Volkmann ER, Varga J. Emerging targets of disease- modifying therapy for systemic sclerosis [review]. Nat Rev Rheumatol 2019;
15:208– 24.
26. Hinz B, Lagares D. Evasion of apoptosis by myofibroblasts: a hallmark of fibrotic diseases [review]. Nat Rev Rheumatol 2020;16:11– 31.
27. Carvalho- Silva D, Pierleoni A, Pignatelli M, Ong CK, Fumis L, Karamanis N, et al. Open Targets Platform: new developments and updates two years on. Nucleic Acids Res 2019;47:D1056– 65.
28. Zhernakova DV, Deelen P, Vermaat M, van Iterson M, van Galen M, Arindrarto W, et al. Identification of context- dependent expression quantitative trait loci in whole blood. Nat Genet 2017;49:139– 45.
29. Jonkers IH, Wijmenga C. Context- specific effects of genetic vari- ants associated with autoimmune disease. Hum Mol Genet 2017;
26:R185– 92.
30. Gourh P, Agarwal SK, Martin E, Divecha D, Rueda B, Bunting H, et al. Association of the C8orf13- BLK region with systemic scle- rosis in North- American and European populations. J Autoimmun 2010;34:155– 62.
31. Bossini- Castillo L, López- Isac E, Martín J. Immunogenetics of sys- temic sclerosis: defining heritability, functional variants and shared- autoimmunity pathways. J Autoimmun 2015;64:53– 65.
32. Sharif R, Mayes MD, Tan FK, Gorlova OY, Hummers LK, Shah AA, et al. IRF5 polymorphism predicts prognosis in patients with sys- temic sclerosis. Ann Rheum Dis 2012;71:1197– 202.
33. López- Isac E, Bossini- Castillo L, Guerra SG, Denton C, Fonseca C, Assassi S, et al. Identification of IL12RB1 as a novel systemic sclerosis susceptibility locus. Arthritis Rheumatol 2014;66:3521– 3.
34. Zweers MC, Hakim AJ, Grahame R, Schalkwijk J. Joint hypermobil- ity syndromes: the pathophysiologic role of tenascin- X gene defects [review]. Arthritis Rheum 2004;50:2742– 9.
35. Malfait F, Francomano C, Byers P, Belmont J, Berglund B, Black J, et al. The 2017 international classification of the Ehlers- Danlos syndromes. Am J Med Genet Part C Semin Med Genet 2017;175:8– 26.
36. Gorlova O, Martin JE, Rueda B, Koeleman BP, Ying J, Teruel M, et al.
Identification of novel genetic markers associated with clinical phe- notypes of systemic sclerosis through a genome- wide association strategy. PLoS Genet 2011;7:e1002178.
37. Zhou X, Li H, Guo S, Wang J, Shi C, Espitia M, et al. Associations of multiple NOTCH4 exonic variants with systemic sclerosis.
J Rheumatol 2019;46:184– 9.
38. Zhang F, Michaelson JE, Moshiach S. Tetraspanin CD151 main- tains vascular stability by balancing the forces of cell adhesion and cytoskeletal tension. Blood 2014;123:3843.
39. Chen M, Daha MR, Kallenberg CG. The complement system in sys- temic autoimmune disease. J Autoimmun 2010;34:276– 86.
40. Kamitaki N, Sekar A, Handsaker RE, de Rivera H, Tooley K, Morris DL, et al. Complement genes contribute sex- biased vulnerability in diverse disorders. Nature 2020;582:577– 81.
41. Catrysse L, Vereecke L, Beyaert R, van Loo G. A20 in inflammation and autoimmunity. Trends Immunol 2014;35:22– 31.
42. Shi G, Abbott KN, Wu W, Salter RD, Keyel PA. Dnase1L3 regu- lates inflammasome- dependent cytokine secretion. Front Immunol 2017;8:1– 16.
43. Peña- Blanco A, García- Sáez AJ. Bax, Bak and beyond: mitochon- drial performance in apoptosis. FEBS J 2018;285:416– 31.
44. Lagares D, Santos A, Grasberger PE, Liu F, Probst CK, Rahimi RA.
Targeted apoptosis of myofibroblasts with the BH3 mimetic ABT- 263 reverses established fibrosis. Sci Trans Med 2017;9:eeal3765.
45. Gallant S, Gilkeson G. ETS transcription factors and regulation of immunity. Arch Immunol Ther Exp 2006;54:149– 63.
46. Wang CY, Petryniak B, Thompson CB, Kaelin WG, Leiden JM.
Regulation of the Ets- related transcription factor Elf- 1 by binding to the retinoblastoma protein. Science 1993;260:1330– 5.
47. Shores EW, Love PE. TCR ζ chain in T cell development and selec- tion. Curr Opin Immunol 1997;9:380– 9.
48. Grant PA, Thompson CB, Pettersson S. IgM receptor- mediated transactivation of the IgH 3′ enhancer couples a novel Elf- 1- AP- 1 protein complex to the developmental control of enhancer function.
EMBO J 1995;14:4501– 13.
49. Thalayasingam N, Nair N, Skelton AJ, Massey J, Anderson AE, Clark AD, et al. CD4+ and B lymphocyte expression quantitative traits at rheumatoid arthritis risk loci in patients with untreated early arthri- tis: implications for causal gene identification. Arthritis Rheumatol 2018;70:361– 70.
50. James T, Lindén M, Morikawa H, Fernandes SJ, Ruhrmann S, Huss M, et al. Impact of genetic risk loci for multiple sclerosis on expres- sion of proximal genes in patients. Hum Mol Genet 2018;27:912– 28.
51. Odhams CA, Cortini A, Chen L, Roberts AL, Viñuela A, Buil A, et al.
Mapping eQTLs with RNA- seq reveals novel susceptibility genes, non- coding RNAs and alternative- splicing events in systemic lupus erythematosus. Hum Mol Genet 2017;26:1003– 17.
52. Newman JR, Conesa A, Mika M, New FN, Onengut- Gumuscu S, Atkinson MA, et al. Disease- specific biases in alternative splicing and tissue- specific dysregulation revealed by multitissue profiling of lymphocyte gene expression in type 1 diabetes. Genome Res 2017;27:1807– 15.
53. Skaug B, Khanna D, Swindell WR, Hinchcliff ME, Frech TM, Steen VD, et al. Global skin gene expression analysis of early diffuse cuta- neous systemic sclerosis shows a prominent innate and adaptive inflammatory profile. Ann Rheum Dis 2020;79:379– 86.
APPENDIX A: THE PRECISESADS Clinical Consortium Members of the PRECISESADS Clinical Consortium are as follows:
Lorenzo Beretta, Barbara Vigone (Referral Center for Systemic Autoimmune Diseases, Fondazione IRCCS Ca’ Granda Ospedale Maggiore Policlinico di Milano, Italy); Jacques- Olivier Pers, Alain Saraux, Valérie Devauchelle- Pensec, Divi Cornec, Sandrine Jousse- Joulin (Cen- tre Hospitalier Universitaire de Brest, Hospital de la Cavale Blanche, Brest, France); Bernard Lauwerys, Julie Ducreux, Anne- Lise Maudoux (Pôle de pathologies rhumatismales systémiques et inflammatoires, Institut de Recherche Expérimentale et Clinique, Université catholique de Louvain, Brussels, Belgium); Carlos Vasconcelos, Ana Tavares, Esmeralda Neves, Raquel Faria, Mariana Brandão, Ana Campar, António Marinho, Fátima Farinha, Isabel Almeida (Centro Hospitalar do Porto, Portugal); Miguel Angel Gonzalez- Gay Mantecón, Ricardo Blanco Alonso, Alfonso Corrales Martínez (Servicio Cantabro de Salud, Hospital Universitario Marqués de Valdecilla, Santander, Spain); Ricard Cervera, Ignasi Rodríguez- Pintó, Gerard Espinosa (Hospital Clinic I Provicia, Institut d’Investigacions
Biomèdiques August Pi i Sunyer, Barcelona, Spain); Rik Lories, Ellen De Langhe (Katholieke Universiteit Leuven, Belgium); Nicolas Hunzelmann, Doreen Belz (Klinikum der Universitaet zu Koeln, Cologne, Germany);
Torsten Witte, Niklas Baerlecken (Medizinische Hochschule Hannover, Germany); Georg Stummvoll, Michael Zauner, Michaela Lehner (Medical University Vienna, Vienna, Austria); Eduardo Collantes, Rafaela Ortega- Castro, Mª Angeles Aguirre- Zamorano, Alejandro Escudero- Contreras, Mª Carmen Castro- Villegas (Servicio Andaluz de Salud, Hospital Uni- versitario Reina Sofía Córdoba, Spain); Norberto Ortego, María Con- cepción Fernández Roldán (Servicio Andaluz de Salud, Complejo hos- pitalario Universitario de Granada [Hospital Universitario San Cecilio], Spain); Enrique Raya, Inmaculada Jiménez Moleón (Servicio Andaluz de
Salud, Complejo hospitalario Universitario de Granada [Hospital Virgen de las Nieves], Spain); Enrique de Ramon, Isabel Díaz Quintero (Servicio Andaluz de Salud, Hospital Regional Universitario de Málaga, Spain);
Pier Luigi Meroni, Maria Gerosa, Tommaso Schioppo, Carolina Artusi (Università degli studi di Milano, Milan, Italy); Carlo Chizzolini, Aleksandra Zuber, Donatienne Wynar (Hospitaux Universitaires de Genève, Swit- zerland); Laszló Kovács, Attila Balog, Magdolna Deák, Márta Bocskai, Sonja Dulic, Gabriella Kádár (University of Szeged, Szeged, Hungary);
Falk Hiepe, Velia Gerl, Silvia Thiel (Charite, Berlin, Germany); Manuel Rodriguez Maresca, Antonio López- Berrio, Rocío Aguilar- Quesada, and Héctor Navarro- Linares (Andalusian Public Health System Biobank, Gra- nada, Spain).