Examination of the neuronal network regulating satiety using refeeding as a satiety model
Ph.D. Thesis
Györgyi Zséli
Semmelweis University
János Szentágothai Ph.D. School of Neuroscience
Institute of Experimental Medicine of the Hungarian Academy of Sciences
Supervisor: Csaba Fekete MD, DSc Official reviewers: Zita Puskár PhD
Balázs Gaszner MD, PhD
Head of the Final Examination Committee: Miklós Tóth MD, DSc
Members of the Final Examination Committee: Katalin Halasy PhD, DSc Zsuzsanna Várnainé Tóth PhD
Budapest
2017
2
1. TABLE OF CONTENTS
1. TABLE OF CONTENTS ... 2
2. LIST OF ABBREVIATIONS ... 5
3. INTRODUCTION ... 10
Energy homeostasis-related circulating factors ... 12
The hypothalamic arcuate nucleus as the primary sensor of the circulating energy homeostasis-related signals ... 15
Peripheral nerves transmitting peripheral metabolic signals to the central nervous system ... 19
The nucleus tractus solitarii as central hub of energy homeostasis-related afferents ... 21
Involvement of the parabrachial nucleus in the regulation of food intake ... 22
The central amygdala and the regulation of feeding ... 24
Fasting and refeeding as a satiety model in rodents ... 25
4. AIMS ... 27
5. METHODS ... 28
Animals ... 28
Anesthesia ... 28
Transcardial perfusion with fixative and tissue preparation ... 28
Section pretreatment for immunohistochemistry ... 28
Preparation of experimental animals for mapping the refeeding-activated brain areas ... 29
5.5.1.Animal and tissue preparation ... 29
5.5.2.Immunohistochemical detection of c-Fos-immunoreactivity ... 29
5.5.3.Mapping the refeeding-activated brain areas ... 29
Examination of the involvement of the vagus nerve and/or the ascending brainstem pathways in the refeeding-induced activation of POMC neurons in the arcuate nucleus ... 30
5.6.1. Surgical procedure of vagotomy ... 30
5.6.2. Surgical procedure of unilateral brainstem transection and tissue preparation ... 31
5.6.3. Determination of the effectiveness of brainstem transections by double- labelling immunofluorescence for dopamine β-hydroxylase (DBH) and POMC ... 31
5.6.4. Image acquisition and analysis for determination of the effectiveness of transections ... 32 5.6.5. Determination of the refeeding-induced activation of the ARC POMC neurons using double-labeling immunofluorescence for c-Fos and POMC in
3
vagotomized animals and in rats with unilateral transection of ascending
brainstem pathways ... 32
5.6.6. Statistical analysis ... 33
Mapping the connections of parabrachial nucleus and the central nucleus of amygdala with other refeeding-activated neuronal groups. ... 33
5.7.1.Retrograde tract tracing experiments ... 33
5.7.2.Anterograde tract tracing experiments ... 34
5.7.3.Localization of the CTB injection sites ... 34
5.7.4.Immunohistochemistry for localization of the PHAL injection sites ... 35
5.7.5.Immunohistochemistry to identify of the sources of the refeeding-activated inputs of the PBN and CEA ... 36
5.7.6.Identification of the refeeding-activated targets of the PBN and CEA using triple-labeling immunofluorescence for PHAL, c-Fos and the neuronal marker HuC/HuD... 37
5.7.7.Image acquisition and analysis for the PBN and CEA tract-tracing studies ... 37
Elucidation of the role of the CEA subnuclei in the development of satiety during refeeding ... 38
5.8.1.Stereotaxic injection of hSyn-hM3D(Gq)-mCherry adeno-associated virus (AAV) ... 38
5.8.2.Examination of the effects of the chemogenetic activation of CEA ... 38
5.8.3.Statistical analysis of the food intake data ... 39
5.8.4.Localization of the virus injection sites ... 39
5.8.5.Identification of brain areas activated by the chemogenetic stimulation of CEA neurons using triple-labeling immunofluorescence for c-Fos, RFP and HuC/HuD... 39
5.8.6.Image acquisition and analysis ... 40
5.8.7.Statistical analysis of the CEA activation induced neuronal activation in refeeding-related areas ... 41
6. RESULTS ... 42
Refeeding-activated neuronal groups in the rat brain ... 42
Activation of anorexigenic pro-opiomelanocortin neurons during refeeding is independent of the inputs mediated by the vagus nerve and the ascending brainstem pathways ... 55
6.2.1.Food and water intake ... 55
6.2.2.Effect of vagotomy on refeeding-induced activation of POMC neurons in the ARC ... 55
6.2.3.Effect of transection of ascending brainstem pathways on the DBH-IR innervation of POMC neurons in the ARC... 57
6.2.4.Effect of the transection of ascending brainstem pathways on the refeeding-induced activation of POMC neurons in the ARC ... 59
4
Retrograde and anterograde connections of PBN with other refeeding-activated
neuronal groups ... 60
6.3.1.Localization of CTB/PHAL injection sites ... 60
6.3.2.Origins of the refeeding-activated neuronal inputs of the PBN ... 62
6.3.3.Identification of the direct and indirect inputs of the PBN from refeeding- activated POMC neurons ... 64
6.3.4.Identification of the refeeding-activated targets of the PBN ... 65
Connections of the central nucleus of amygdala with other refeeding-activated neuronal groups ... 67
6.4.1.Localization of the CTB/PHAL injection sites in the CEA ... 69
6.4.2.Origin of the refeeding-activated inputs of the CEA ... 71
6.4.3.Involvement of the anorexigenic arcuate nucleus POMC neurons in the innervation of the CEA and the potential role of the PSTN as a relay nucleus between the ARC and CEA ... 73
6.4.4.Innervation of refeeding-activated neuronal populations by CEA neurons ... 76
Role of the subnuclei of the central nucleus of amygdala in the development of satiety during refeeding ... 77
6.5.1.Localization of the hSyn-hM3D(Gq)-mCherry AAV injection sites ... 77
6.5.2.Effect of chemogenetic activation of CEA subnuclei on the food intake during refeeding ... 79
6.5.3.Brain areas activated by chemogenetic activation of CEA and innervated by CEA neurons ... 80
7. DISCUSSION ... 83
Refeeding-activated neuronal groups in the rat brain ... 83
Activation of ARC POMC neurons during refeeding is independent of vagal and brainstem inputs ... 85
Connections of PBN with other refeeding-activated areas ... 87
Connections of the CEA with other refeeding-activated neuronal groups ... 90
Role of CEA subnuclei in the development of satiety during refeeding ... 93
8. CONCLUSIONS ... 95
9. SUMMARY ... 96
10. ÖSSZEFOGLALÁS ... 97
11. REFERENCES ... 98
12. PUBLICATION LIST ... 110
List of publications the thesis is based on ... 110
Other publications ... 110
13. ACKNOWLEDGMENTS ... 111
5
2. LIST OF ABBREVIATIONS
3V - 3rd ventricle
AAV - adeno-associated virus ABC - avidin-biotin complex aco - anterior commissure
ACo - anterior cortical amygdaloid nucleus AgRP - agouti-related protein
AH - anterior hypothalamic area AIA - agranular insular area
α-MSH - alpha-melanocyte-stimulating hormone
AP - area postrema
AQ - aqueduct (Sylvius) ARC - arcuate nucleus
ARCdmp - arcuate hypothalamic nucleus, dorsomedial posterior part BBB - blood-brain barrier
BST - bed nucleus of the stria terminalis
BSTL - bed nucleus of the stria terminalis, lateral division
BSTLD - bed nucleus of the stria terminalis, lateral division, dorsal part BSTM - bed nucleus of the stria terminalis, medial division
BSTMA - bed nucleus of the stria terminalis, medial division, anterior part
BW - body weight
C - central canal
CART - cocaine-and amphetamine-regulated transcript CCK - cholecystokinin
CEA - central nucleus of amygdala
CEAc - central nucleus of amygdala, capsular part CEAl - central nucleus of amygdala, lateral part
CEAlc - central nucleus of amygdala, laterocapsular part CEAm - central nucleus of amygdala, medial part
CGRP - calcitonin gene-related peptide CNO - clozapine-N-oxide
CNS - central nervous system
6 cp - cerebral peduncle, basal part
CREB - cAMP response element-binding protein CRH - corticotropin-releasing hormone
cst - commissural stria terminalis CTB - cholera toxin β subunit
DAB - diaminobenzidine
DBH - dopamine-β-hydroxylase
DMN - hypothalamic dorsomedial nucleus
DREADD - Designer Receptor Exclusively Activated by Designer Drugs DTAF - dichlorotriazinylamino fluorescein
ec - external capsule
ECu - external cuneate nucleus FITC - fluorescein isothiocyanate fr - fasciculus retroflexus
fx - fornix
GABAA receptor - gamma-aminobutyric acid A-type receptor
GH - growth hormone
GHSR - growth hormone secretagogue receptor GLP-1 - glucagon-like peptide 1
HuC/HuD - human neuronal protein
Hyp - hypothalamus
ic - internal capsule
IgG - immunoglobulin g
INSR - insulin receptor
IP - interpeduncular nucleus
IR - immunoreactive
ir - immunoreactivity
IRt - intermediate reticular nucleus
KO - knockout
LEPR - leptin receptor
LH - lateral hypothalamic area LPO - lateral preoptic area
7 LSV - lateral septal nucleus ventral part MC3R, MC4R - melanocortin 3 and 4 receptors MD - mediodorsal thalamic nucleus
MeAD - medial amygdaloid nucleus anterodorsal part
ml - medial lemniscus
mlf - medial longitudinal fasciculus MO - medial orbital cortex
mtV - mesencephalic trigeminal tract
Ni-DAB - diaminobenzidine with nickel ammonium sulfate
NPY - neuropeptide Y
NTS - nucleus tractus solitarii
NTSl - nucleus of the solitary tract, lateral part NTSm - nucleus of the solitary tract, medial part opt - optic tract
ox - optic chiasm
PAG - periaqueductal gray
PAGvl - ventrolateral periaqueductal gray
PB - phosphate buffer
PBl - parabrachial nucleus, lateral part
PBlc - lateral parabrachial nucleus, central part PBld - lateral parabrachial nucleus, dorsal part PBle - lateral parabrachial nucleus, external part PBlv - lateral parabrachial nucleus, ventral part PBm - parabrachial nucleus, medial part
PBme - medial parabrachial nucleus external part PBmm - medial parabrachial nucleus medial part PBN - parabrachial nucleus
PBS - phosphate buffered saline
Pe - periventricular hypothalamic nucleus PeF - perifornical nucleus
PFA - paraformaldehyde
PHAL - Phaseolus vulgaris-leucoagglutinin
8 Pir - piriform cortex
pm - principal mammillary tract
Pn - pontine nuclei
POMC - pro-opiomelanocortin Prl - prelimbic cortex
PSTN - parasubthalamic nucleus
PVA - paraventricular thalamic nucleus anterior part PVN - hypothalamic paraventricular nucleus
PVNl - lateral parvocellular subdivision of the PVN
PVNmp - paraventricular hypothalamic nucleus, medial parvicellular part PVNpo - paraventricular hypothalamic nucleus, posterior part
PVNv - ventral parvocellular subdivision of the PVN PVT - paraventricular thalamic nucleus
py - pyramidal tract
PYY - peptide YY
Re - reuniens thalamic nucleus Rh - rhomboid thalamic nucleus RRF - retrorubral field
S1ULp - primary somatosensory cortex, upper lip region scp - superior cerebellar peduncle (brachium conjunctivum) siRNA - small interfering ribonucleic acid
SO - supraoptic nucleus sol - solitarii tract
sp5 - spinal trigeminal tract
SSs - supplementary somatosensory area STN - subthalamic nucleus
TSA - tyramide signal amplification Tu - olfactory tubercle
VL - lateral ventricle
VPM - ventral posteriomedial nucleus of the thalamus xscp - superior cerebellar peduncle decussation Y1R - neuropeptide Y1 receptor
9
ZI - zona incerta
10
3. INTRODUCTION
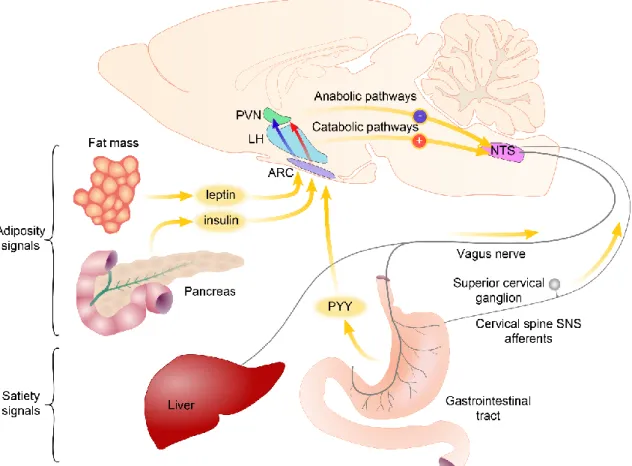
The balance between the energy intake and energy expenditure is very tightly controlled by the central nervous system (CNS) (Schwartz et al., 2000) as indicated by the relatively stable body weight of most adults despite the very high variability of the daily food intake and locomotor activity (Morton et al., 2006). For this precise regulatory process, the communication of the brain and the peripheral organs is inevitable. The brain has to sense the amount and the composition of the consumed food, the actual condition of the adipose depots and the needs of other peripheral organs. This peripheral organ- brain communication is primarily mediated via two main routes: circulating factors can reach the brain via the bloodstream, while effects of other inputs are mediated by visceral sensory nerves: the sensory fibers of the vagus nerve and the sympathetic nerves (Morton et al., 2006) (Figure 1).
The circulating blood carries both peripheral hormones and metabolites like fatty acids, amino acids and glucose. All of these substances mediate important energy homeostasis-related signals toward the brain. The white adipose tissue derived leptin informs the brain about the amount of energy stored in the white adipose tissue, insulin that is secreted in the Langerhans islets of the pancreas carries information about the blood glucose level, but also about the size of adipose tissue, while ghrelin released from the mucosa of the stomach serves as a hunger signal (Morton et al., 2006). Other gastrointestinal hormones like cholecystokinin (CCK) and peptide YY (PYY) mediates information about the food consumption (Figure 1) (Schwartz et al., 2000). The circulating metabolites can also act directly on the neurons of the CNS. For example, glucose sensing plays important role in the regulation of food intake as indicated by the obesity phenotype of the animals after gold-thioglucose induced ablation of the hypothalamic neurons (Debons et al., 1977) and the hyperphagia induced by the inhibition of glucose sensing (Debons et al., 1977).
The primary central target of these circulating signals is the hypothalamic arcuate nucleus (ARC) (Schwartz et al., 2000). Neonatal ablation of the ARC results in leptin resistance and an obesity syndrome (Dawson et al., 1997). Neurons of the ARC integrate the blood-derived information with neuronal signals and transmit this message toward the so called second-order neuronal groups.
11
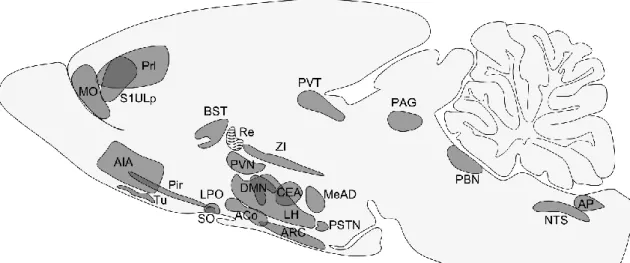
Figure 1 Schematic illustration of pathways transmitting energy homeostasis-related signals from the peripheral organs to the central nervous system. The circulating blood contains satiety-related hormones like PYY released from the gastrointestinal tract and adiposity hormones like leptin and insulin. The primary central target of these hormones is the arcuate nucleus (ARC). Neurons of the ARC sense and integrate these signals and transmit toward second order neuronal groups like the hypothalamic paraventricular nucleus (PVN) and the lateral hypothalamus (LH). The vagus nerve and the sympathetic nerves carry information about the amount and the quality of the consumed food sensed by mechano- and chemosensitive receptors and by detecting locally released hormones. Axons of these nerves terminate on the neurons of the nucleus tractus solitarii (NTS). Descending pathways from the hypothalamus influence the sensitivity of the NTS neurons to vagus derived inputs. Modified from Schwartz et al. Nature 2000.
The energy homeostasis-related signals that are conveyed by the peripheral nerves can reach the brain via the nucleus tractus solitarii (NTS). The vagus nerve mediates most of these inputs. The sensory fibers of the vagus nerve innervate the visceral organs and sense mechanical and chemical stimuli and also have receptors for some of the gastrointestinal hormones like CCK (Li, 2007; Phillips and Powley, 2000). Therefore, the vagus nerve can convey information about the consumed food to the NTS. Currently, far less information is available about the role of the sympathetic sensory fibers, but the information carried by these fibers is also relayed by the NTS (Loewy, 1990). After signal integration, the NTS relays this information toward the forebrain. The parabrachial nucleus (PBN) is a major relay nucleus in this pathway in rodents (Loewy, 1990). It
12
receives energy homeostasis-related inputs from the NTS and sends widespread inputs to the forebrain. Recent studies from Dr. Palmiter’s group (Carter et al., 2015; Carter et al., 2013; Wu et al., 2012; Wu and Palmiter, 2011) uncovered a key role of the PBN in the regulation of food intake. The PBN is also a key node, where the ascending and descending energy homeostasis-related circuits interact (Wu and Palmiter, 2011). A major anorexigenic output of the PBN projects to the central nucleus of the amygdala (CEA) (Carter et al., 2013), where the energy homeostasis-related signals are integrated with stress and emotion-related information.
Energy homeostasis-related circulating factors
During the early years of the research on the regulation of the energy homeostasis, three main hypothesis were raised about the regulation of food intake: the glucostatic, satiety and adiposity hypotheses (Woods, 2013). According to the glucostatic hypothesis, the changes of glucose levels in the circulation initiates and terminates the food intake (Mayer and Thomas, 1967). This hypothesis was supported by the hypoglycemia induced vigorous food intake and the hyperphagia provoked by administration of 2-deoxyglucose, a substance known to cause cellular hypoglycemia (Woods, 2013). The glucostatic hypothesis was, however, challenged by the fact that the circulating glucose level is higher at the initiation of most meals than the level what would induce food intake (Woods, 2013) suggesting that, though alteration of glucose levels certainly regulate feeding, glucose is not the primary factor in the regulation of food intake.
The satiety hypothesis is based on the experiments by Davis et al. (Davis et al., 1967) demonstrating that blood derived from sated rats can decrease food intake. Since in their experiment, blood from fasted rats did not increase the food intake, they hypothesized that food intake is initiated by the decrease of circulating satiation factors rather than increase of hunger factors (Davis et al., 1967). The first identified hormone that met the criteria of a satiation hormone was cholecystokinin (CCK). This hormone is secreted by the I cells of duodenum and jejunum in response to food intake (Stengel and Tache, 2011). In humans, CCK level peaks in the blood 15 min after the onset of eating (Stengel and Tache, 2011). Among nutrients, proteins and fats are the most potent stimulators of CCK release (Stengel and Tache, 2011). Administration of CCK markedly inhibits the size of the consumed meal (Gibbs et al., 1973). CCK, however, has no effect
13
on the cumulative food intake (Stengel and Tache, 2011). Thus, during eating, nutrients stimulate the release of CCK and this hormone terminate the meal, but the animals compensate with increase of the number of meals.
Subsequently, it was recognized that the regulation of food intake also depends on the size of adipose tissue suggesting that so called adiposity signals that inform the brain about the lipid stores should also be involved in the feeding regulation (Woods, 2013).
The first recognized adiposity factor was insulin. It is rapidly secreted from the β cells of the pancreatic Langerhans islands in response to the increase of blood glucose levels after carbohydrate intake (Begg and Woods, 2012), but the circulating insulin level is also proportional to the size of adipose tissue (Woods, 2013). The first identified function of insulin was its role in the regulation of blood glucose level (Begg and Woods, 2012).
Insulin facilitates the uptake of glucose by the peripheral organs including the muscle and liver where glucose is stored as glycogen. Insulin also inhibits the glucose production in the liver (Begg and Woods, 2012). Insulin, however, has far more widespread effect on the metabolism. For example, it also increases the cellular intake of amino acids and the storage of lipids in the adipose tissue (Begg and Woods, 2012).
Insulin also has been shown to regulate food intake (Figure 1). Peripheral insulin injection increases food intake due to its hypoglycemic effect, but administration of insulin into the brain inhibits food intake and causes weight loss (Woods et al., 1979).
Since the fluctuations of insulin level in the cerebrospinal fluid only slowly follows the changes observed in the circulation, the central insulin level is mainly influenced by the adiposity and not by the quick changes of glucose level (Woods et al., 1979). Thus when the size of adipose tissues is increased, the elevated central insulin level inhibits food intake.
The white adipose tissue derived hormone, leptin, is also an adiposity signal (Figure 1). It was discovered as the hormone that is missing from the highly obese ob/ob mouse (Halaas et al., 1995). Similarly to rodents, the mutation of leptin gene also causes early onset obesity in humans (Farooqi et al., 1998). The blood level of leptin and its synthesis in the white adipose tissue are increased in obese animals and are decreased by fasting (Frederich et al., 1995). Administration of leptin to non-obese animals results in marked inhibition of food intake and decrease of body weight (Halaas et al., 1995). Leptin influences almost all aspects of energy homeostasis. In addition to the regulation of food
14
intake, leptin also stimulates the energy expenditure, increases lipolysis and also regulates the development of neuronal pathways regulating energy homeostasis (Morton et al., 2006). In addition to the size of adipose tissue, the leptin level is also regulated by other hormones including insulin, glucocorticoids and neuronal signals ensuring that leptin could regulate the energy homeostasis according to the needs of the organism (Morton et al., 2006).
During the years of energy homeostasis research, the glucostatic, satiety and adiposity hypotheses of the food intake regulation replaced each other, but the current view is that satiation and adiposity signals and metabolites like glucose continuously interact with each other to defend body weight, maintain stable circulating glucose levels and provide appropriate amount of energy for all organs.
Similarly to the above mentioned circulating factors, most of the peripheral energy homeostasis-related signals have anorexic effect supporting the hypothesis of Davis (Davis et al., 1967) saying that meal is initiated by the decreased level of satiation factors in the blood and not by increase of hunger factors. However, in 1999, Kojima and his fellow workers identified a new peptide hormone, ghrelin, from the stomach that turned out later to have very potent orexigenic effect (Kojima et al., 1999; Nakazato et al., 2001).
Ghrelin was discovered as the endogenous ligand of the growth hormone secretagogue receptor (GHSR) (Kojima et al., 1999). In accordance, ghrelin stimulates the release of growth hormone (GH) from the pituitary (Kojima et al., 1999). In addition to the pituitary, GHSR, however, has a widespread distribution in the hypothalamus indicating that the regulation of GH secretion in the pituitary is not the only function of this hormone (Nakazato et al., 2001). Indeed, it was found that intracerebroventricular administration of ghrelin caused a marked increase of food intake in rats (Nakazato et al., 2001). Ghrelin is synthesized by the oxyntic glands in the fundus of stomach (Date et al., 2000). The plasma ghrelin level has both short term, circadian, regulation and it also has long term regulation that is influenced by the amount of stored energy (Iwakura et al., 2015). The ghrelin level peaks just before the time of expected meal and declines after food consumption (Iwakura et al., 2015). Therefore, ghrelin is considered as a hunger hormone, however, the meal pattern of ghrelin knock out mice is normal suggesting that ghrelin is not absolutely necessary for the initiation of food intake (Iwakura et al., 2015). The circulating ghrelin level is negatively correlated with the body mass index. Thus ghrelin
15
level is lower in obesity and higher in lean individuals (Iwakura et al., 2015). The weight loss induced increase of ghrelin levels may be an important factor that makes difficult the maintenance of the decreased body weight (Iwakura et al., 2015).
The hypothalamic arcuate nucleus as the primary sensor of the circulating energy homeostasis-related signals
The ARC is located at the base of the hypothalamus, on both sides of the third ventricle behind the optic chiasm. This nucleus is closely associated to the blood-brain barrier (BBB) free median eminence and it has been shown that even within the ARC, some of the blood vessels lack BBB markers (Norsted et al., 2008) suggesting that circulating factors can relatively easily access the neurons of the ARC. Indeed, neurons in the ARC express leptin, ghrelin and insulin receptors and can sense the changes of metabolites like glucose, amino acids and fatty acids (Morton et al., 2006) (Figure 2).
Furthermore, neonatal ablation of the ARC by peripheral monosodium glutamate administration causes obesity (Dawson et al., 1997) substantiating the role of the ARC in the regulation of energy homeostasis.
The ARC has at least two feeding-related neuronal groups, the medially located neuropeptide Y (NPY) and agouti-related protein (AgRP) expressing neurons that also utilize GABA as transmitter; and the more laterally located α-melanocyte-stimulating hormone (α-MSH) and cocaine-and amphetamine regulated transcript (CART) producing neurons (Dawson et al., 1997). These two cell populations have antagonistic effects on the regulation of energy homeostasis (Figure 2).
The peptides of the α-MSH/CART neurons have anorexigenic effects. Both α-MSH and CART exert potent inhibitory effect on the food intake and stimulate energy expenditure (Morton et al., 2006). α-MSH is derived from the proteolytic cleavage of a prohormone, the proopiomelanocortin (POMC) (Corander and Coll, 2011). In the brain, α-MSH exerts its effects primarily via two types of receptors, the melanocortin 3 and 4 receptors (MC3R and MC4R). Genetic mutation of both the POMC gene or the MC4R results in hyperphagia, increased adiposity and markedly increased body weight (Adan et al., 2006; Corander and Coll, 2011). The degree of obesity in these mouse models is similar than that observed in the leptin deficient ob/ob mice. In addition to the obesity, the POMC deficient mice also have altered pigmentation and adrenal insufficiency due
16
Figure 2 Role of the neurons of the arcuate nucleus (ARC) in the regulation of energy homeostasis. The two main feeding-related neuronal groups of the ARC, the AGRP/NPY and the POMC/CART neurons, are regulated by circulating hormones. AGRP and NPY are neuropeptides that stimulate food intake and decrease energy expenditure, whereas α-melanocyte stimulating hormone (a post-translational derivative of proopiomelanocortin, POMC) and CART are neuropeptides that inhibit food intake and increase energy expenditure. The circulating levels of insulin and leptin are proportional to the size of adipose tissue. These hormones inhibit AGRP/NPY neurons and stimulate the adjacent POMC/CART neurons. During fasting, the lower insulin and leptin levels activate the AGRP/NPY neurons and inhibit the POMC/CART neurons.
Ghrelin is a circulating peptide secreted from the stomach, directly activates the AGRP/NPY neurons, thereby, stimulates the food intake. The feeding-related neuronal groups of the ARC transmit these signals to the second order neuronal groups and regulate these cells via activation of NPY and melanocortin receptors. GHSR, growth hormone secretagogue receptor; LEPR, leptin receptor; MC3R/MC4R, melanocortin 3/4 receptor; Y1R, neuropeptide Y1 receptor. Based on work of Barsh and Schwartz, Nature Reviews 2002.
17
to the lack of peripheral melanocortin effect (Yaswen et al., 1999), these effects are independent from the function of POMC neurons in the ARC. Among the obesity syndromes, the phenotype of the MC4R knockout (KO) mice has unique features, the MC4R KO mice have increased longitudinal growth and normal lean body mass (Adan et al., 2006). In addition to the increased food intake, the MC4R KO mice also have decreased oxygen consumption and even the pairfed MC4R KO mice develop obesity suggesting that both the hyperphagia and the decreased energy expenditure contribute to this obesity syndrome (Adan et al., 2006). Mutations of the POMC and MC4R are also observed in humans resulting in very similar phenotype than that observed in mice (Farooqi and O'Rahilly, 2008). Indeed, the mutations of the MC4R are the most frequent monogenic causes of morbid obesity in humans (Farooqi and O'Rahilly, 2008).
The CART KO mice also develop obesity, but this phenotype is very mild compared to the phenotypes caused by the genetic alterations of the melanocortin system (Wierup et al., 2005). The lack of CART has no effect on the food intake and causes only 14%
increase of body weight that is apparent only after 40 weeks (Wierup et al., 2005). While CART is expressed in the anorexigenic POMC neurons in rodents, this peptide is expressed in orexigenic neurons in humans raising the possibility that CART has different function in the regulation of food intake in rodents and humans (Menyhert et al., 2007).
The receptor of CART is still unidentified making the elucidation of the function of CART even more difficult.
The role of the POMC/CART neurons in the regulation of energy homeostasis is further substantiated by the fact that ablation of POMC neurons in adult mice results in hyperphagia and increased body weight (Gropp et al., 2005).
An important signal that regulates the POMC/CART neurons is leptin that stimulates the gene expression of both of these peptides and increases the firing of these neurons (Hill et al., 2008; Morton et al., 2006). Though, the POMC neurons express leptin receptor, the POMC cell specific ablation of leptin receptor causes only mild obesity (Hill et al., 2008) that is in contrast to the morbid obesity of the POMC or MC4R KO mice.
These data suggest that the effect of leptin on the POMC neurons is at least partly indirect.
Conditional deletion of leptin receptor from GABAergic or glutamatergic neurons demonstrated that leptin responsive GABAergic neurons play critical role in the mediation of leptin effects to the POMC neurons (Vong et al., 2011). Leptin induced
18
inhibition of the GABA neurons causes disinhibition and therefore stimulation of POMC neurons (Vong et al., 2011).
The POMC neurons are also regulated by insulin and metabolites like glucose, fatty acids and amino acids (Blouet et al., 2009; Fekete et al., 2006; Schwinkendorf et al., 2011). The POMC neurons integrate these humoral and neuronal inputs and transmit these signals toward second order neuronal populations like the hypothalamic paraventricular nucleus (PVN) and hypothalamic dorsomedial nucleus (DMN).
In contrast to the POMC/CART neurons, the NPY/AgRP neurons are orexigenic (Morton et al., 2006). Central administration of both NPY and AgRP stimulates food intake and decreases energy expenditure (Morton et al., 2006). AgRP acts as an endogenous antagonist of the MC3R and MC4R (Dinulescu and Cone, 2000). This peptide is a competitive antagonist of α-MSH on these receptors, but it can also hyperpolarize the target neurons via binding to MC4R and opening a type of K+ channel (Kir 7.1 channels) (Ghamari-Langroudi et al., 2015). This action of AgRP is independent from the binding of α-MSH to the receptors and also from G proteins (Ghamari- Langroudi et al., 2015). NPY exerts its effect via three Y receptors, the Y1, Y2 and Y5 receptors (Pedragosa-Badia et al., 2013). Among these receptors, Y1 and Y5 are postsynaptic receptors and mediate the orexigenic effects of NPY (Morton et al., 2006;
Pedragosa-Badia et al., 2013). However, α-MSH and NPY act through different receptors, NPY can antagonize the action of α-MSH by inhibiting the α-MSH induced cAMP synthesis and cAMP response element-binding protein (CREB) phosphorylation (Sarkar and Lechan, 2003).
Despite the very potent orexigenic effect of these peptides, neither the AgRP nor the NPY KO mice have major phenotype (Morton et al., 2006). In contrast, however, ablation of the NPY/AgRP neurons in adult animals develop severe anorexia (Gropp et al., 2005; Luquet et al., 2005) demonstrating the importance of these neurons in the regulation of food intake. In addition, these data also indicate that transmitter(s) other than NPY or AgRP also play important role in the stimulation of food intake by these neurons. Indeed, the AgRP neuron ablation induced anorexia causes neuronal activation is several neuronal groups and administration of GABAA receptor agonist can prevent this anorexia demonstrating that GABAergic inhibition of target neurons by the NPY/AgRP neurons is critical for the regulation of food intake (Wu et al., 2009).
19
The NPY/AgRP neurons are also regulated by metabolic signals, but oppositely than the POMC/CART neurons (Morton et al., 2006). Fasting results in a 4-fold increase of the firing frequency of these neurons, what can be reversed by leptin administration and completely absent in the leptin deficient ob/ob mice (Takahashi and Cone, 2005).
Furthermore, fasting stimulates, while leptin administration inhibits the synthesis of both NPY and AgRP in these cells (Morton et al., 2006). The NPY/AgRP neurons are also inhibited by insulin and glucose and stimulated by ghrelin (Fekete et al., 2006; Nakazato et al., 2001).
The projection fields of the NPY/AgRP and POMC/CART neurons highly overlap and in most cases the two neuron populations innervate the very same second order neurons that provide the anatomical basis of the precise regulation of second order neurons by the two feeding-related neuron population of ARC (Fekete et al., 2000;
Lechan and Fekete, 2006).
Peripheral nerves transmitting peripheral metabolic signals to the central nervous system
The visceral organs are innervated by both parasympathetic and sympathetic nerves. The vagus nerve provides the parasympathetic innervation of most of the abdominal organs. Both the parasympathetic and the sympathetic nerves carry primary afferent fibers. Approximately 80% of axons in the vagus nerve are afferent fiber, while this ratio is lower, approximately 20% in the sympathetic nerves (Cervero and Foreman, 1990). The role of this dual sensory innervation of the visceral organs is currently unknown (Cervero and Foreman, 1990).
The cell bodies of the afferent fibers of the vagus nerve are located in the nodose ganglion. These neurons project peripherally to the visceral organs and centrally to the NTS (Cervero and Foreman, 1990). These sensory fibers can sense the passage of food in the gastrointestinal tract, nutrients and gastrointestinal hormones, thus can provide negative feedback signal to the CNS to terminate food intake (de Lartigue and Diepenbroek, 2016).
The presence of food in the stomach and gut is sensed by afferent fibers in the mucosa that are sensitive for mechanical touch, while the amount of food is sensed by the stretch and tension sensitive afferents in the external muscle layers (Berthoud, 2008). In
20
addition, to mechanical sensing, the sensory vagus neurons are also sensitive to nutrients, therefore can detect the components of food. Long- and medium-chain fatty acids can directly activate the vagal afferent neurons possibly via the fatty acid receptor GPR40 and the nuclear receptor LxR (de Lartigue and Diepenbroek, 2016). These neurons can also directly sense glucose, but currently there is no direct evidence that the vagal afferent neurons can sense amino acids (de Lartigue and Diepenbroek, 2016). The afferent neurons of the vagus nerve are also sensitive to gastrointestinal hormones. Leptin, CCK, and glucagon-like peptide 1 (GLP-1) activates the afferent fibers of vagus nerve, while ghrelin inhibits the firing of these axons (Berthoud, 2008). These hormones can also alter the sensitivity of vagal afferents to mechanic stimuli (de Lartigue and Diepenbroek, 2016). Since these hormones are synthesized in the wall of the stomach and gut, where their synthesis is regulated by the ingested nutrients, the interaction of these hormones can also transmit feeding-related stimuli toward the brain. The vagal fibers are also sensitive for serotonin secreted from the enterochromaffin cells of the stomach after gastric distension (Grill and Hayes, 2012). This serotoninergic signaling is also a critical satiation signal (Grill and Hayes, 2012).
Vagal sensory fibers of the liver and the hepatic portal vessels are also involved in the regulation of energy homeostasis (Warne et al., 2007).
Earlier, the primary function of the sensory fibers of the vagus nerve were thought to be to send feedback information to the brain to terminate the actual meal (de Lartigue and Diepenbroek, 2016). However, selective genetic ablation of the leptin receptor from the sensory neurons of the vagus results in hyperphagia, increased adiposity and increased body weight indicating that afferent signals of the vagus nerve also play role in the long term regulation of food intake (de Lartigue and Diepenbroek, 2016; de Lartigue et al., 2014).
However, the sympathetic afferent fibers give approximately 25% of the sensory innervation of visceral organs currently very little information is available about the role of these fibers in the nutrient sensing.
21
The nucleus tractus solitarii as central hub of energy homeostasis-related afferents
The peripheral signals carried by the afferent fibers of the vagus nerve and the sympathetic nerves are relayed through the NTS (Figure 1). The termination of the afferents have a viscerotopic organization pattern. The gastrointestinal afferents primarily terminate in the intermediate, medial and commissural subnuclei of the NTS (Loewy, 1990). The NTS also receives taste-related signals via cranial nerves (Loewy, 1990) and can sense humoral signals directly (Grill and Hayes, 2012).
Leptin receptor is expressed by neurons of the NTS (Scott et al., 2009) and intra NTS administration of leptin reduces food intake and body weight (Kanoski et al., 2012) indicating that NTS leptin signaling is involved in the regulation of energy homeostasis.
These data are further supported by the finding that siRNA mediated knock down of the leptin receptor in the medial NTS causes hyperphagia and increases body weight (Hayes et al., 2010).
Ghrelin can also act directly on the neurons of the NTS, but in contrast to leptin, ghrelin injection to the NTS increases food intake (Grill and Hayes, 2012). NTS neurons express ghrelin receptor and are directly inhibited by ghrelin (Grill and Hayes, 2012).
In addition to these peripheral inputs, the NTS also receives neuronal inputs from other parts of the CNS. It receives descending inputs from hypothalamic nuclei (Blouet et al., 2009; Singru et al., 2012). An ARC POMC neuron-PVN oxytocin neuron-NTS pathway mediates the stimulatory effect of leucine rich diet on the NTS neurons (Blouet et al., 2009), while an ARC POMC neuron-PVN glutamatergic neuron-NTS pathway mediates the excitatory effect of refeeding (Singru et al., 2012). Serotoninergic neurons also provide an excitatory input to the NTS (Wu et al., 2012).
It is not completely understood, how the NTS neurons integrate these peripheral and central signals, but it is suggested that humoral and neuronal inputs alter the sensitivity of the NTS neurons to the vagus mediated inputs (Grill and Hayes, 2012).
Indeed, direct effect of leptin on NTS neurons increases the effect of gastric distension on food intake, while NTS specific siRNA mediated knockdown of leptin receptor prevents the anorexigenic effect of CCK that is known to be mediated by the vagus nerve (Grill and Hayes, 2012). In contrast, ghrelin inhibits the activation of NTS neurons induced by stimulation of vagal afferents (Cui et al., 2011).
22
After integration of energy homeostasis-related signals, the NTS neurons transmit these signals toward other hindbrain and forebrain nuclei involved in the regulation of energy homeostasis. Since many aspects of ingestive behavior are intact in decerebrated rodents or in anencephal infants, the hindbrain seems to be the primary site of the premotor control of food ingestion (Grill and Hayes, 2012). In addition to these hindbrain nuclei, the NTS also sends feeding-related inputs to forebrain regions that are involved in the regulation of food intake. Recent genetic and optogenetic studies demonstrated that projection of glutamatergic neurons to the PBN has important role in the regulation of food intake (Wu et al., 2012). For example, activation of a NTS-PBN-CEA pathway has been shown to inhibit food intake (Carter et al., 2013; Roman et al., 2016; Wu et al., 2012).
Involvement of the parabrachial nucleus in the regulation of food intake
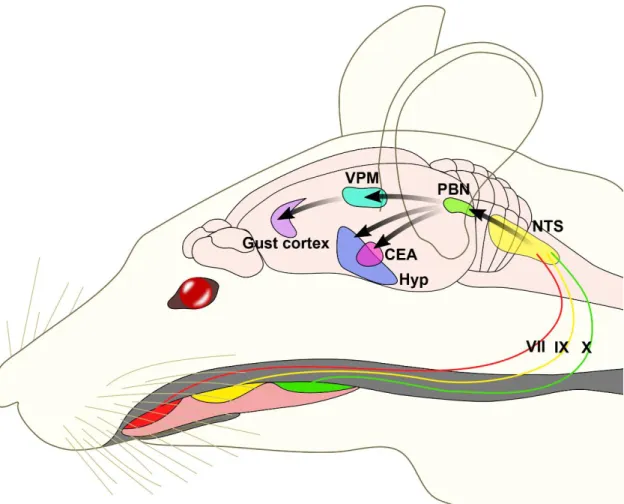
One of the major projection fields of the NTS is the PBN. The gustatory regions of the NTS project to the medial part of the PBN, while the visceroreceptive portions project to the lateral PBN (Loewy, 1990).
The involvement of the medial PBN in the taste perception was discovered in 1971 when its connections with the NTS and the thalamic taste area was described (Scott and Small, 2009). Later, series of electrophysiological studies mapped and characterized the taste sensitive neurons of the PBN (Figure 3)(Tokita and Boughter, 2016). Similarly to the NTS, the taste sensitive neurons also have topographic distribution in the PBN.
Studies focusing on the mapping of neuronal activation in the PBN after different taste stimuli demonstrated that activated neurons after taste with negative or positive hedonic value segregate within the PBN suggesting that PBN starts the hedonic processing of taste information (Yamamoto et al., 1994). In addition, lipids in the small intestine can very rapidly alter the responsiveness of PBN neurons to different taste stimuli (Hajnal et al., 1999) and nutritional status can also alter the neuronal activation pattern induced by tastes (Yamamoto et al., 2009). These data indicate that the PBN not only relay the taste stimuli toward forebrain sites, but the PBN is also involved in the processing of taste information and integrates it with the effect of other inputs.
23
Figure 3 Neuroanatomy of the rodent taste pathways. Taste buds in the mouth are innervated by the chorda tympani branch of facial nerve, greater superficial petrosal facial nerve (VII), glossopharyngeal (IX) cranial nerves and branches to epiglottis and taste buds of vagus nerve (X). Taste signals are conveyed to NTS in the medulla and from the NTS to the medial PBN in rodents. From the PBN, parallel projections reach the ventral posteriomedial nucleus of the thalamus (VPM) and forebrain limbic areas, including the amygdala and hypothalamus. Projection of VPM to the insular cortex define the gustatory aspect of the cortex. From this cortical region the taste-related information is conveyed to higher order regions, including the orbital cortex. NTS, nucleus tractus solitarii; PBN, parabrachial nucleus; VPM, ventral posterior medial thalamic nucleus; CEA, central nucleus of amygdala; Hyp, hypothalamus. Based on work of Fernstrom et al. Journal of Nutrition 2012.
An important function of taste perception is to discriminate among foods and poisonous substances. If consumption of a novel taste is followed by sickness, the animals develop avoidance behavior for foods with similar taste. This behavior is called conditioned taste aversion. In contrast, if the novel taste is followed by pleasure, seeking behavior, conditioned taste preference develops. Lesions of PBN prevents the acquisition of both the conditioned taste aversion (Trifunovic and Reilly, 2002) and preference (Reilly and Trifunovic, 2000; Yamamoto et al., 2009). PBN also mediates anorexia associated with malaise induced by intraperitoneal injection of lithium chloride or lipopolysaccharide treatment that are used to mimic the effects of toxic or rancid foods
24
and bacterial infections, respectively (Elmquist and Saper, 1996; Paues et al., 2006;
Rinaman and Dzmura, 2007; Yamamoto et al., 1992). Lithium chloride-induced anorexia results in robust c-Fos expression widely in the brain including the PBN (Andre et al., 2007; Lamprecht and Dudai, 1995; Swank and Bernstein, 1994). This neural activity is particularly observed within the PBel, the lateral external subdivision of PBN, in the calcitonin gene-related peptide expressing (CGRP) neurons. Activation of these CGRP neurons is necessary and sufficient to produce conditioned taste aversion (Carter et al., 2015).
The critical role of the PBN and its connection with the ARC in the regulation of food intake was recently demonstrated by Dr. Palmiter’s group (Wu and Palmiter, 2011).
They observed that after ablation of the ARC AgRP neurons, a population of PBN neurons are strongly activated, therefore, they hypothesized that loss of GABA release from the AgRP terminals is responsible for the activation of PBN neurons and these cells cause the anorexia of AgRP neuron ablated animals (Wu and Palmiter, 2011). Indeed, they demonstrated that administration of GABAA receptor agonist into the PBN can prevent the anorexia in these animals (Wu and Palmiter, 2011). Within the PBN, primarily the inhibition of the CGRP neurons is critical for the AgRP neuron induced hyperphagia (Campos et al., 2016). These neurons receive excitatory input from the NTS and relay the information toward the CEA (Carter et al., 2013).
The central amygdala and the regulation of feeding
Lesions of CEA results in increased food intake and promote body weight gain (Rollins and King, 2000). In contrast, optogenetic activation of the laterocapsular part of CEA (CEAlc) decreases food intake (Carter et al., 2013) demonstrating the importance of this nucleus in the regulation of feeding behavior.
The CEA plays important role in the integration of homeostatic and non- homeostatic signals involved in the regulation of food intake. It plays role in the development of stress induced anorexia, and mediates the effect of social emotions and learned cues on the regulation of food intake (Baxter and Murray, 2002; Callahan et al., 2013). Furthermore, the PBN CGRP neuron-CEAlc pathway was shown to play critical role in the development of taste aversion induced by gastrointestinal illness (Figure 4)(Carter et al., 2015).
25
Currently, however, little information is available, how the CEA is involved in the homeostatic regulation of food intake and how this nucleus is connected in the network of feeding-related neuronal groups.
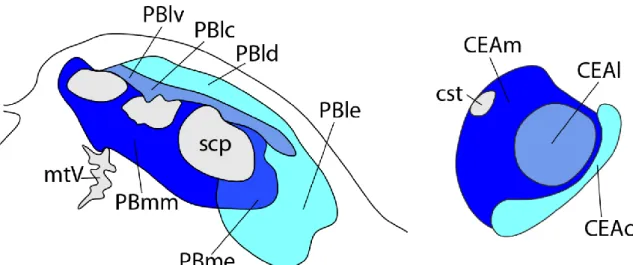
Figure 4 Schematic drawings illustrate the projection pattern from the pontine parabrachial nucleus (PBN) onto the central amygdala (CEA). There are three main pathways between the PBN and CEA. The PBm- CEAm pathway (dark blue), the PBl-CEAl pathway (bright blue) and PBl-CEAc pathway (cyan). Based on work of Bernard et al. Journal of Comparative Neurology 1993.
Fasting and refeeding as a satiety model in rodents
Energy homeostasis depends on a tightly controlled balance between food intake and energy expenditure that is regulated by a complex neuronal network in the central nervous system (Schwartz et al., 2000). Under most conditions, these two components are regulated simultaneously, but become uncoupled during refeeding after a prolonged period of fasting (Ji and Friedman, 1999; Rothwell et al., 1983).
After a long period of fasting, satiety is observed within the first 2 h of food intake, accompanied by characteristic c-Fos activation pattern in many brain regions, however, these changes are not complemented by the increase of energy expenditure (Ji and Friedman, 1999; Timofeeva et al., 2005). During refeeding, the energy expenditure is only increased 24h after the onset of food intake (Rothwell et al., 1983). It is likely that the lack of upregulation of energy expenditure during the first period of refeeding facilitates the refilling of energy stores that are depleted during fasting. Therefore, refeeding provides a unique model when neuronal pathways regulating satiety can be studied independently from the energy expenditure regulating circuits.
26
However, some of the refeeding-activated neuronal groups including the NTS, PVN, DMN, PBN and CEA, were identified by others and by our laboratory (Singru et al., 2007; Singru et al., 2012; Timofeeva et al., 2005), we hypothesized that detailed mapping of refeeding-activated neuronal groups and their connections can yield identification of novel feeding-related neuron groups and/or neuronal pathways. Similar approach by our group led to the identification of a novel neuronal pathway that mediates the effect of refeeding from the ARC to the NTS (Singru et al., 2012).
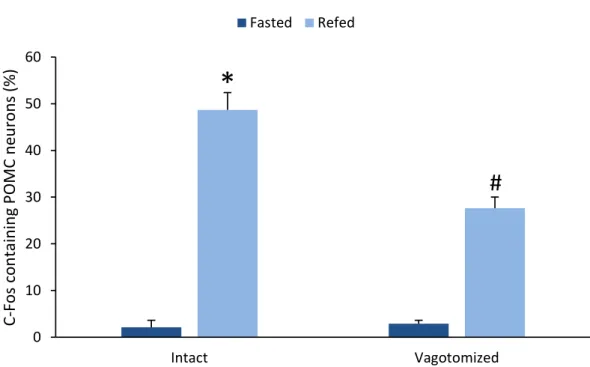
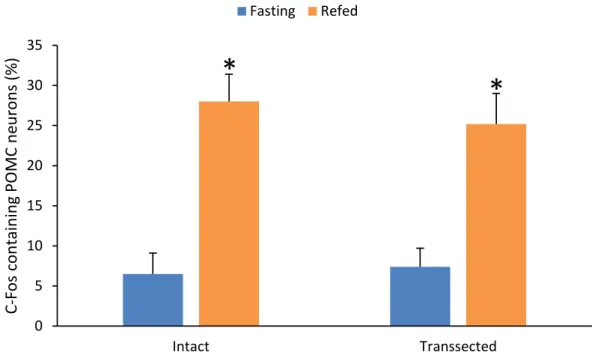
One of the neuronal groups that are activated during refeeding is the POMC neurons of the ARC (Singru et al., 2007). These neurons were primarily thought to play role in the long term regulation of food intake (Schwartz et al., 2000), however, inhibition of melanocortin signaling increases the food intake during refeeding suggesting that activation of the POMC neurons are also important for the meal size determination during refeeding (Singru et al., 2007). Since the vagus nerve and the NTS are known to play crucial role in the meal size determination, we hypothesized that the POMC neurons are activated by the vagus nerve (Singru et al., 2007)-NTS-ARC pathway during refeeding.
27
4. AIMS
Due to the very high incidence of obesity in western countries and the lack of efficient and side effect free therapy, elucidation of the neuronal circuits regulating the food intake has crucial importance. Therefore, the goal of my PhD work was to better understand the neuronal network involved in the development of satiety in refed rats. To reach this goal, our specific goals were:
1. To map the refeeding-activated neuronal groups in the rat brain.
2. To determine whether refeeding-induced activation of POMC neurons in the ARC is dependent upon the vagus nerve and/or ascending brainstem pathways.
3. To map the connections of the PBN with other refeeding-activated neuronal groups.
4. To map the connections of CEA with other refeeding-activated neuronal groups.
5. To elucidate the role of the CEA subnuclei in the development of satiety during refeeding.
28
5. METHODS
Animals
The experiments were carried out on adult male Wistar rats (TOXI-COOP KKT, Budapest, Hungary) weighing 270–310 g or Sprague–Dawley rats (230–250 g body weight) purchased from the Charles River Hungary Ltd (Isaszeg, Hungary). The animals were housed under standard environmental conditions (lights on between 06.00 and 18.00 h, temperature 22±1 °C, rat chow and water ad libitum). All experimental protocols were reviewed and approved by the Animal Welfare Committee at the Institute of Experimental Medicine of the Hungarian Academy of Sciences. (License numbers: PEI/001/1550- 10/2014; 22.1/3891/003/2009).
Anesthesia
The anesthesia of the animals was performed by intraperitoneal injection of a mixture of ketamine (50 mg/kg body weight) and xylazine (10 mg/kg body weight).
Transcardial perfusion with fixative and tissue preparation
As a final step of all experiments, the animals were anesthetized and then perfused transcardially with 20 ml 0.01M phosphate buffered saline (PBS; pH 7.4), followed by 150 ml of 4% paraformaldehyde (PFA) in 0.1M phosphate buffer (PB, pH 7.4). The brains were rapidly removed, postfixed in the same fixative for 2 hours and cryoprotected by immersion in 30% sucrose in PBS overnight. The brains were frozen in powdered dry ice and then coronal, 25 μm thick sections were cut through the forebrain and brainstem with a freezing microtome (Leica Microsystems, Wetzlar, Germany). Four series of sections, obtained at 100 μm intervals, were collected into antifreeze solution (30% ethylene glycol; 25% glycerol; 0.05M PB) and stored at -20°C until used for immunohistochemistry.
Section pretreatment for immunohistochemistry
Free-floating tissue sections were pretreated with 0.5% H2O2 and 0.5% Triton X- 100 in PBS for 15 min to reduce the endogenous peroxidase activity and increase the permeability of cell membranes, respectively. To reduce nonspecific antibody binding, the sections were treated with 2.5% normal horse serum in PBS for 20 min.
29
Preparation of experimental animals for mapping the refeeding-activated brain areas
5.5.1. Animal and tissue preparation
The mapping of the brain areas activated after two hours of refeeding was performed using 10 adult male Wistar rats. The rats were fasted for 40 hours. During this time, they had free access to water. After the fasting period, food was reintroduced to 5 of the 10 animals and they were allowed to eat ad libitum for 2 hours. At the completion of the refeeding interval, the food intake was weighed, both the fasted and the fasted+refed animals were deeply anesthetized and perfused transcardially as described above.
5.5.2. Immunohistochemical detection of c-Fos-immunoreactivity
One series of sections from each animal was pre-treated and then the sections were incubated in rabbit anti-c-Fos serum (Ab5; Oncogene Science, Cambridge, MA) at 1:10,000 dilution in PBS containing 2% normal horse serum and 0.2% sodium azide (antibody diluent) for 1 day at room temperature. After washing in PBS, the sections were incubated in biotinylated donkey anti-rabbit IgG (Jackson ImmunoResearch, West Grove, PA) at 1:500 dilution for 2 hours at room temperature, and after further rinsing in PBS, incubated in avidin-biotin-peroxidase complex (ABC Elite Kit, Vector Laboratories, Inc.
Burlingame, CA, USA) at 1:1000 dilution for 1 hour. Following further rinses in PBS, the peroxidase activity was visualized with Ni-DAB developer (0.05% diaminobenzidine, 0.15% nickel ammonium sulfate, 0.005% H2O2 in 0.05 M Tris buffer at pH 7.6) (Table 1), and the sections were mounted on gelatin coated slides, air dried, counterstained with 1% cresyl violet and coverslipped with DPX mounting medium (Sigma-Aldrich Inc., St.
Louis, MO, USA).
5.5.3. Mapping the refeeding-activated brain areas
To map the distribution of neurons containing c-Fos-immunoreactivity in fasted and refed animals, large mosaic images of the entire brain sections were taken by Zeiss AxioImager M1 bright field microscope equipped with an AxioCam MR digital camera and AxioVision software (Carl Zeiss AG., Oberkochen, Germany). The identification of brain regions was facilitated by Nissl counterstaining and was based on the rat brain atlas of Paxinos and Watson (Paxinos and Watson, 1998) and the rat brain atlas of Swanson
30
(Swanson, 2004). Images were imported into the Corel Draw 11 (Corel Corporation, Ottawa, Canada) software to draw the maps.
To identify the areas of the brain that may play role in the development of satiety during refeeding, the differences of neuronal activation in fasted and refed rats were identified by comparing the number of c-Fos-immunoreactive (IR) nuclei in each region.
Examination of the involvement of the vagus nerve and/or the ascending brainstem pathways in the refeeding-induced activation of POMC neurons in the arcuate nucleus
5.6.1. Surgical procedure of vagotomy
Bilateral subdiaphragmatic vagotomy was performed on 10 adult, male, Sprague–
Dawley rats. In addition, 16 adult male rats from the same strain were sham-operated.
After anesthesia, the animals were placed in a dorsal recumbent position and a laparotomy was performed to expose the stomach and the lower oesophagus at the subdiaphragmatic level. Anterior and posterior trunks of the vagus nerve were isolated on the surface of the subdiaphragmatic part of the oesophagus and transected with iridectomy scissors. To remove small vagal branches embedded in the connective tissue, all connective tissue was removed from the surface of the subdiaphragmatic part of the oesophagus. Buprenorphine (0.1 mg/kg body weight, subcutaneously) was administered immediately after the surgery and as required until the animals were fully recovered. Sham surgery was performed in a similar way, except that the vagal trunks were not cut and the connective tissue was not removed. One day after surgery, the vagotomized animals were divided into two groups and the sham-operated animals were divided into three groups. The first group was fasted for 40 hours (Fasted Vagotomized, n=5; Fasted Sham, n=5), whereas the second group was fasted for 40 hours and then given free access to food for 2 hours before perfusion (Refed Vagotomized, n=5; Refed Sham, n=5). The third group of the sham-operated rats was fasted for 40 hours and then refed with the same amount of food that was consumed by the refed, vagotomized rats (pairfed group, n=6). Food and water intake was monitored daily and during the 2 hours refeeding period. To verify the completeness of the vagotomy, the vagus nerve, the surrounding tissues and the stomach were visually inspected at the time of euthanasia. Criteria for complete vagus nerve transection were
31
the lack of continuity in the nervous tissue along the subdiaphragmatic part of the oesophagus together with the presence of gastric distension.
5.6.2. Surgical procedure of unilateral brainstem transection and tissue preparation Adult male Sprague-Dawley rats (n=19) were deeply anesthetized, and under stereotaxic guidance, a 3mm-wide glass knife was lowered into the brain at the level of mesencephalon, parallel with the coronal plane. The coordinates of the medial edge of the knife were: anterior–posterior, −5.6mm from the Bregma; lateral, 0mm; and dorsoventral, −9.1mm from the surface of the skull. Additional four animals were operated the same way, although the glass knife was not lowered into the brain (sham- transected animals). After 2 weeks of survival, the animals with transection were divided into two groups: the first group was fasted for 40 hours (n=12), whereas the second group and the sham-transected animals were fasted for 40 hours and then given free access to food for 2 hours before perfusion (n=7).
5.6.3. Determination of the effectiveness of brainstem transections by double-labelling immunofluorescence for dopamine β-hydroxylase (DBH) and POMC
Since the catecholaminergic, DBH containing axons originate exclusively in the brainstem, the effectiveness of the unilateral brainstem transections was verified by comparison of the DBH-IR innervation of the POMC neurons in the transected and intact side of ARC. After pretreatment, free-floating tissue sections of rats with unilateral transection were incubated in a mixture of mouse monoclonal antibodies against DBH (dilution 1:1000; Millipore, Billerica, MA, USA) and rabbit antiserum against POMC (dilution 1:2000; Phoenix Pharmaceuticals INC., Burlingame, CA, USA) for 2 days at 4
°C. After washing, the sections were immersed in a mixture of Alexa 555-conjugated donkey anti-mouse IgG (dilution 1:500; Invitrogen, Carlsbad, CA, USA) and fluorescein isothiocyanate (FITC)-conjugated donkey anti-rabbit IgG (dilution 1:50; Jackson ImmunoResearch) for 2 hours at room temperature (Table 1, end of this chapter). After additional washing, the sections were mounted on glass slides and coverslipped with Vectashield mounting medium (Vector Laboratories Inc.).
32
5.6.4. Image acquisition and analysis for determination of the effectiveness of transections
The sections were examined and images were taken using a Radiance 2100 confocal microscope (Bio-Rad Laboratories, Hemel Hempstead, UK). At least two sections were analyzed from each brain from different rostro-caudal levels of the ARC. With a 60X oil immersion objective. Serial optical sections of 180×180 μm areas covering the ARC were recorded on both sides of each section. The sections were scanned in one step for FITC and Alexa 555 using laser excitation lines 488 nm for FITC and 543 nm for Alexa 555, and dichroic/emission filters 560/500–530 nm for FITC and 560–610 nm for Alexa 555.
Pinhole sizes were set to obtain optical slices < 0.7 μm thick, and the series of optical slices were recorded with a 0.75-μm Z-step. The series of optical sections were merged and displayed with Laservox (Media Cybernetics Inc., Bethesda, MD, USA) software.
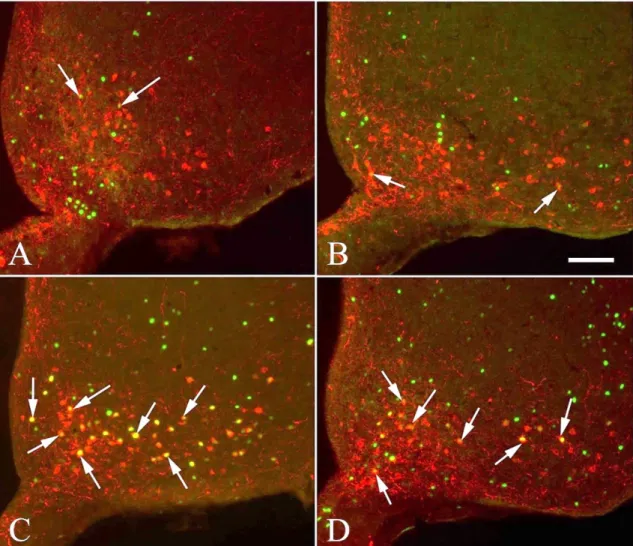
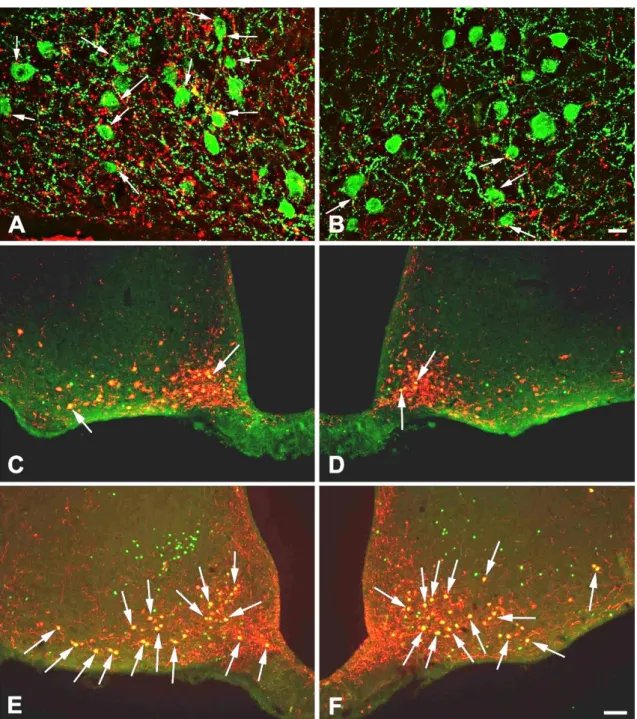
Perikarya and proximal dendrites of the POMC neurons were traced through the optical slices, and the DBH boutons juxtaposed to the POMC neurons were counted. Only brains with more than 60% reduction of the DBH innervation of POMC neurons on the transected side were used for double-labelling immunofluorescence of c-Fos and POMC (n=5 in each group).
5.6.5. Determination of the refeeding-induced activation of the ARC POMC neurons using double-labeling immunofluorescence for c-Fos and POMC in vagotomized animals and in rats with unilateral transection of ascending brainstem pathways Free-floating sections of fasted and refed vagotomized rats and animals with unilateral transection of ascending brainstem pathways were pretreated and were then incubated in rabbit c-Fos antiserum (dilution 1:10000; Calbiochem, San Diego, CA, USA) followed by biotinylated donkey anti-rabbit IgG (dilution 1:500) and ABC (dilution 1:1000). After amplification with the tyramide signal amplification (TSA) kit (Perkin Elmer Life and Analytical Sciences, Waltham, MA) according to the manufacturer’s instructions, sections were incubated in streptavidin-labelled FITC (dilution 1:250;
Vector Laboratories Inc.) and rabbit POMC antiserum (dilution 1:2000). After additional washing, the sections were incubated in Alexa 555 conjugated donkey anti-rabbit IgG (dilution 1:500) (Table 1).
To determine the percentage of POMC-containing neurons of the ARC that contain c-Fos, images of the double-labelled preparations were taken using Zeiss AxioPlan2 or
33
AxioImager epifluorescent microscopes (Carl Zeiss). The same field was double-exposed when switching the filter sets for each fluorochrome and superimposed using Adobe Photoshop (Adobe Systems Inc., San Jose, CA, USA) to create composite images for analysis. The number of single and double-labelled POMC-IR neurons was counted and the percentage of double-labeled neurons was calculated.
5.6.6. Statistical analysis
Comparison of the data was performed with two-way ANOVA and one-way ANOVA followed by a Newman–Keuls multiple comparisons post-hoc test. Food and water intake of the vagotomized and sham-vagotomized rats was analyzed using Student's t-test. P<0.05 was considered statistically significant. Results are presented as the mean±SEM.
Mapping the connections of parabrachial nucleus and the central nucleus of amygdala with other refeeding-activated neuronal groups
5.7.1. Retrograde tract tracing experiments
The retrograde tracer cholera toxin β subunit (CTB; List Biological Laboratories, Campbell, CA) was injected by iontophoresis into the region of PBN in 3 adult, male Wistar rats and into the region of CEA of 23 animals. Rats were anesthetized and their head positioned in a stereotaxic apparatus with the Bregma and lambda in the horizontal plane. Through a burr hole in the skull, a glass micropipette (17.5-20 μm outer tip diameter) filled with 0.5% CTB in 0.01M PB at pH 8.0 was lowered into the brain at stereotaxic coordinates corresponding to the PBN (anteroposterior, -9.3 mm from the Bregma; lateral,- 2.0 mm; and dorsoventral, -7.0 mm from the surface of the skull), and to the CEA (anteroposterior: -2.4 mm, mediolateral: -4.2 mm, dorsoventral: -8.2 mm) based on the atlas of Paxinos and Watson (Paxinos and Watson, 1998). The CTB was deposited for 10 min (6 μA (PBN) or 5 μA (CEA) positive current, pulsed on—off at 7s intervals) using a constant-current source (Stoelting, Wood Dale, IL). Seven-ten days after tracer deposition, rats were fasted for 48 h and then given free access to food for 2 hours. Immediately after refeeding, the animals were perfused with fixative and sections were prepared as described above.
34 5.7.2. Anterograde tract tracing experiments
The anterograde tracer, Phaseolus vulgaris leucoagglutinin (PHAL; Vector Laboratories Inc.) was injected into the PBN of 5 Wistar rats, and an additional 11 Wistar rats received PHAL injection into the region of CEA. The animals were anesthetized intraperitoneally with ketamine-xylazine and their head mounted in a stereotaxic apparatus as described above. Using the same stereotaxic coordinates as for the retrograde tract tracing experiment described above, 2.5% PHAL in 0.01M PB at pH 8.0 was injected by a glass micropipette into the PBN using iontophoresis (6 μA positive current, pulsed on—off at 7 s intervals) for 15-20 min. Following a 10-day transport time, the animals were fasted for two days and then refed for two hours. Perfusion of the animals with fixative, sectioning of the tissue, and the pretreatment of the sections for immunohistochemistry were performed as described above.
5.7.3. Localization of the CTB injection sites
CTB immunohistochemistry was performed to identify the core of the injection site in the PBN. One of the four series of sections was pre-treated as described above. The sections were then incubated in goat anti-CTB serum (1:10,000, List Biological Laboratories) for 48 hours. Following washes in PBS, the sections were immersed in biotinylated donkey anti-sheep IgG (1:500; Jackson ImmunoResearch) and incubated for 2 hours at room temperature. After rinsing with PBS, the sections were incubated in ABC at 1:1000 dilution for 1 hour. The peroxidase activity was visualized by Ni-DAB developer. The sections were mounted on gelatin coated slides, air dried, counterstained with 1% cresyl violet and coverslipped with DPX mounting medium (Sigma-Aldrich Inc.).
To facilitate the localization of the injection sites in the CEA, the core of the CTB injection sites were assessed after double-labeling of the sections for CTB and c-Fos. The early gene, c-Fos, was used to mark the CEA, since neurons of CEA are activated by refeeding, while the surrounding regions do not show c-Fos-immunoreactivity in refed animals. Sections pre-treated as described above were incubated in a mixture of primary antisera: goat anti-CTB serum (1:5000, List Biological Laboratories) and rabbit anti-c- Fos serum (1:1500, Oncogene, MA, USA) for 48 hours. After washing in PBS, the sections were incubated in biotinylated donkey anti-sheep IgG (Jackson ImmunoResearch) at 1:500 for 2 h at room temperature. After further rinsing in PBS, the