Genome-wide profiling using single-
nucleotide polymorphism arrays identifies novel chromosomal imbalances in pediatric glioblastomas
Hui-Qi Qu*, Karine Jacob*, Sarah Fatet, Bing Ge, David Barnett, Olivier Delattre, Damien Faury, Alexandre Montpetit, Lauren Solomon, Peter Hauser, Miklos Garami, Laszlo Bognar, Zoltan Hansely, Robert Mio, Jean-Pierre Farmer, Steffen Albrecht, Constantin Polychronakos, Cynthia Hawkins, and Nada Jabado
Departments of Paediatrics and Human Genetics, Montreal Children’s Hospital (H.-Q.Q., C.P.); Division of Hemato-Oncology, Departments of Paediatrics and Human Genetics, Montreal Children’s Hospital Research Institute (K.J., D.B., D.F., N.J.); Molecular Diagnostic Laboratory, Department of Genetics, Montreal Children’s Hospital Research Institute (R.M.); Division of Neurosurgery, Montreal Children’s Hospital (J.-P.F.);
Department of Pathology, Montreal Children’s Hospital, McGill University Health Centre, Montreal, Canada (S.A.); INSERM U 830, Institut Curie, Paris, France (S.F., O.D.); McGill University and Genome Quebec Innovation Centre, Montreal, Canada (B.G., A.M.); Division of Pathology, The Hospital for Sick Children, Toronto, Canada (L.S., C.H.); 2nd Department of Paediatrics, Faculty of Medicine, Semmelweis University, Budapest, Hungary (P.H., M.G.); Division of Neuro-Surgery, Division of Pathology, National Institute of Neurosurgery, Budapest, Hungary (L.B.); Department of Neurosurgery, Medical and Health Science Centre, University of Debrecen, Debrecen, Hungary (Z.H.)
Available data on genetic events in pediatric grade IV astrocytomas (glioblastoma [pGBM]) are scarce. This has traditionally been a major impediment in under- standing the pathogenesis of this tumor and in develop- ing ways for more effective management. Our aim is to chart DNA copy number aberrations (CNAs) and get insight into genetic pathways involved in pGBM.
Using the Illumina Infinium Human-1 bead-chip-array (100K single-nucleotide polymorphisms [SNPs]), we genotyped 18 pediatric and 6 adult GBMs. Results were compared to BAC-array profiles harvested on 16 of the same pGBM, to an independent data set of 9 pedi- atric high-grade astrocytomas (HGAs) analyzed on Affymetrix 250K-SNP arrays, and to existing data sets on HGAs. CNAs were additionally validated by real-
time qPCR in a set of genes in pGBM. Our results ident- ify with nonrandom clustering of CNAs in several novel, previously not reported, genomic regions, suggesting that alterations in tumor suppressors and genes involved in the regulation of RNA processing and the cell cycle are major events in the pathogenesis of pGBM. Most regions were distinct from CNAs in aGBMs and show an unexpectedly low frequency of genetic amplification and homozygous deletions and a high frequency of loss of heterozygosity for a high-grade I rapidly dividing tumor. This first, complete, high-resolution profiling of the tumor cell genome fills an important gap in studies on pGBM. It ultimately guides the mapping of onco- genic networks unique to pGBM, identification of the related therapeutic predictors and targets, and develop- ment of more effective therapies. It further shows that, despite commonalities in a few CNAs, pGBM and aGBMs are two different diseases.
Keywords:pediatric high-grade astrocytomas, brain tumors, SNP arrays, LOH
*These authors contributed equally to the manuscript.
Corresponding Author:Constantin Polychronakos, M.D., Montreal Children’s Hospital, 2300 Tupper, Montreal, Que., Canada, H3H 1P3 (constantin.polychronakos@mcgill.ca).
Received June 11, 2008; accepted May 6, 2009.
#The Author(s) 2010. Published by Oxford University Press on behalf of the Society for Neuro-Oncology. All rights reserved. For permissions, please e-mail: journals.permissions@oxfordjournals.org
Neuro-Oncology12(2):153 – 163, 2010.
doi:10.1093/neuonc/nop001
N E U R O - O N C O LO G Y
Introduction
B
rain tumors are the largest group of solid neo- plasms in children and are currently the leading cause of cancer-related mortality and morbidity in the pediatric years. Pediatric high-grade astrocytomas (HGAs), including grade IV astrocytomas (glioblastoma [GBM]) account for 15% of all brain neoplasms in chil- dren,1have a dismal prognosis despite aggressive man- agement, and have a high morbidity linked to current treatments. Although their diagnosis still relies mainly on pathology, little is known about the molecular mech- anisms underlying their development.Physical changes in the DNA copy number of particu- lar genomic regions, manifesting as loss of heterozygos- ity (LOH) or epigenetic changes such as loss of imprinting, have been shown to promote cancer for- mation and progression. In particular, LOH has been extensively used in the discovery of various tumor suppressor genes, including Rb1 and p53. A precise characterization of these genomic alterations in a given tumor may therefore increase our understanding of the oncogenic events promoting its growth and may provide more accurate means for its classification.
However, most of the work done to date on nonrandom LOH in solid tumors has been based on searches for a small number of candidate loci. Comparative genomic hybridization (CGH), which identifies chromosomal segments with copy number changes (gain or loss),2 – 4 has an effective resolution that varies from20 Mb to 100 kb and a far from optimal capacity in detecting chromosomal deletions, especially LOHs.5 More recently, a major breakthrough for the precise mapping of genomic aberrations in cancers has been made by the completion of the human genome sequence.6 Concurrently, high-density arrays for genotyping single- nucleotide polymorphisms (SNPs)6,7 have been made available (reviewed in Ref. 8). These arrays combine the genome-wide potential of hybridization arrays with higher-resolution (by an order of magnitude) detection of LOH, DNA copy number alterations, and other chromosomal aberrations compared to CGH.
Studies using these high-resolution arrays can be applied to unravel, with high precision, genomic imbalances in HGAs while providing an additional tool to classify these tumors. They have been used in adult HGAs (aHGAs, mainly high-resolution CGH arrays), providing more accurate tools for prognosis and the identification of therapeutic targets in this tumor.9 – 15 Genomic alterations involved in pHGAs are largely unknown, with only a few published studies using lower-resolution arrays.16 – 18 Moreover, pHGAs have distinct molecular profiles from aHGAs, indicating that results from adult studies cannot be applied to children.19,20To identify genetic loci specifi- cally involved in pHGAs, we analyzed 18 pediatric GBMs and 6 aHGAs using high-resolution Illumina 100K SNP arrays and an independent data set of 9 pHGAs using the Affymetrix 250K SNP arrays platform.
Materials and Methods
Sample Characteristics and Pathological Review All samples were obtained under a protocol approved by the hospitals’ institutional review boards and independently reviewed by senior pediatric neuro- pathologists (S.A. and C.H.) to ensure consistent classi- fication based on contemporary guidelines from the World Health Organization. Eighteen pGBMs (average 10.3+5.2 years) and 6 aGBMs (average 58.8+18.2 years) were analyzed using the Illumina platform.
Snap-frozen sections of areas immediately adjacent to the regions used for pathological diagnosis were pro- vided and contained vascular tissue ranging from ,10% to 30% of the full section. Normal tissue was not available for any of the samples. Tissues were obtained from the Pediatric Cooperative Human Tissue Network, the London/Ontario Tumor Bank, and from collaborators in Montreal and Toronto (Canada) and Hungary. Clinical findings of patients are provided in Table 1. Adult samples have previously been reported for gene expression analysis of pGBM.19
DNA Extraction and Hybridization
DNA from frozen tumors was extracted as described pre- viously.16 DNA (250 ng) from 25 samples was assayed with Infinium I whole genome genotyping, according to the recommendations of the manufacturer (Illumina, San Diego, CA, USA). The Illumina Sentrix Human-1 Genotyping BeadChip covers 109,365 gene-centric SNPs over the genome with a mean intermarker distance of 26 kb (13 kb median spacing). Image intensities were extracted using Illumina’s BeadScan software. Data for each BeadChip were self-normalized using information contained within the array. For Affymetrix 250K SNP chips, 250 ng of tumor DNA was processed according to the manufacturer (Affymetrix, Inc., Santa Clara, CA, USA) and data were analyzed as described elsewhere.16 Genome profiles were created using the Illumina Genome Viewer and Chromosome Browser, which allow viewing, identifying, and manually annotating the chromosomal aberrations. For the initial analysis, the output by BeadStudio software was used to interpret the nature of the aberration. These variables include the nor- malized intensity of hybridization, expressed as its base-2 logarithm (log2R), and the allelic ratio, expressed as the ratio of one allele over the sum of both alleles.21 Visualization of copy number and LOH in normal tissues is performed by plotting the log2Rand the allele ratios across the genome. This algorithm, however, assumes single-lineage DNA and could not be used alone with these tumor tissue samples, which are unavoid- ably mixed with normal vascular tissue. Amplifications were therefore detected if there was an increase in the log2R value (1, corresponding to tetraploid copy number ie 4). The SNPs with log2R2 in tumor tissues, but with normal log2R in all CEU (CEPH
[Centre de l’Etude du Polymorphisme Humain]
European) DNA samples analyzed in the HapMap project were taken as homozygous deletions.21 If log2R2 in the CEU samples, the marker was discarded as a failed assay. To identify heterozygous deletions, we estimated the LOH score using the genotypes of all SNPs in a sequence window of 1 Mb, around any marker. This score is the base-10 logarithm of the ratio of the probability of observing the genotypes of all SNPs in the presence of LOH over the probability of observing the same genotype in the absence of LOH. It is based on the allele frequencies observed in the European-ancestry subjects used in the HapMap project (CEU set) and assigned to the marker in the middle of the window.22We considered that a score of more than 10 is diagnostic of LOH. Four DNA samples from the CEU set were used as the normal control in the same assay.
BAC Arrays
The CGH-array analysis of tumor samples was per- formed as described previously.23 The V5S2 genomic array uses 3913 BAC markers from across the human
genome with a mean resolution of 1 Mb.
Normalization and data analyses were done with VAMP software (Bioinformatics Department, Curie Institute, Paris, France).23Fluorescence ratios exceeding 1.2 were considered indicative of gains of chromosomal material, whereas losses were indicated by ratios lower than 0.8.
Validation of Copy Number Changes by Quantitative Real-Time PCR
Quantitative real-time PCR was done on an ABI-Prism 7000 sequence detector (Applied Biosystems) using a SYBR Green kit (Applied Biosystems). The target locus from each tumor DNA was normalized to the reference, Line-1 as previously described.16
Statistical Analysis
To be considered causative, a somatic copy-number change must be non-random, that is, recur at the same locus in different tumors more frequently than expected by chance alone. To assess the statistical significance of the occurrence of such overlaps in different tumors, their number was compared to a distribution generated by cyclically permuting the position of the LOH regions on each chromosome of each tumor 10,000 times. The false-detection rate (FDR) was calculated as the proportion of overlaps in any given number of tumors that would be expected to occur by chance alone (see Supplementary Material, Fig. S1).
Results
Genomic Alterations Identified in BAC and in SNP Arrays in 16 pGBM Samples
We used a previously validated BAC-array platform, which has provided numerous results in tumor LOH studies,23 and investigated the concordance of copy number aberration (CNA) detection between this plat- form and the Illumina 100K SNP arrays in 16 pHGAs (P1 –P16; Table 1). BAC-array results validated data obtained by SNP arrays (see Supplementary Material, Table S1). However, because of the higher resolution of the SNP arrays, a higher number of alterations, left undetected by the BAC arrays, were uncovered.
This is in keeping with previous findings on the higher sensitivity of SNP technology for the detection of CNAs.24
CNAs in pGBM and aGBMs Detected Using Illumina SNP Arrays
Analysis of the data set of 18 pGBMs and 6 aGBMs using the Illumina SNP arrays showed that heterozygous deletions, detected as LOH, are common phenomena mostly in pGBM and were seen for each chromosome in a number of samples (Tables 1 –4; see also
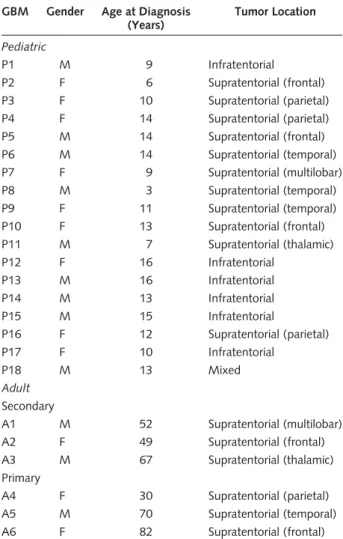
Table 1. Clinical characteristics of GBM samples from adult and pediatric patients analyzed using the Illumina 100K SNP array GBM Gender Age at Diagnosis
(Years)
Tumor Location
Pediatric
P1 M 9 Infratentorial
P2 F 6 Supratentorial (frontal)
P3 F 10 Supratentorial (parietal)
P4 F 14 Supratentorial (parietal)
P5 M 14 Supratentorial (frontal)
P6 M 14 Supratentorial (temporal)
P7 F 9 Supratentorial (multilobar)
P8 M 3 Supratentorial (temporal)
P9 F 11 Supratentorial (temporal)
P10 F 13 Supratentorial (frontal)
P11 M 7 Supratentorial (thalamic)
P12 F 16 Infratentorial
P13 M 16 Infratentorial
P14 M 13 Infratentorial
P15 M 15 Infratentorial
P16 F 12 Supratentorial (parietal)
P17 F 10 Infratentorial
P18 M 13 Mixed
Adult Secondary
A1 M 52 Supratentorial (multilobar)
A2 F 49 Supratentorial (frontal)
A3 M 67 Supratentorial (thalamic)
Primary
A4 F 30 Supratentorial (parietal)
A5 M 70 Supratentorial (temporal)
A6 F 82 Supratentorial (frontal)
Qu et al.: SNP arrays in pediatric high-grade astrocytomas
NEURO-ONCOLOGY † F E B R U A R Y 2 0 1 0 155
Supplementary Material, Table S1). Despite common LOH regions between pGBM and aGBM such as 9p24.3-9p13.1 and 17p13.3, there was little concor- dance between the CNAs detected in both settings, with most LOHs (Tables 3 and 4), amplifications (Table 5), and homozygous deletions (Table 6) found in children being different from the ones encountered in adults (Tables 2– 6). Unsupervised hierarchical clustering analysis, using as input data regions with CNAs in at least one sample, clustered the aGBM samples separately from most pGBMs and the normal brain, confirming the presence of distinct molecular imbalances specific to pGBM.19Interestingly, it also sep- arated primary from secondary aGBMs (Fig. 1).
Analysis of Recurrent Regional LOH in GBMs
Several overlapping regions of LOH in tumors were identified in pGBM samples (Tables 3 and 4). By permu- tation analysis, the 95% confidence interval of the FDR for seven tumor-overlaps is 0– 0.096, which makes it unlikely that more than one of these overlaps is the result of chance alone (see Supplementary Material, Fig. S1). Some of these LOHs found in more than seven samples have been previously described, but most are novel (Tables 2– 4). The highest LOH frequency peak in pGBM was from a 103-kb cluster located in Chr15q15 (10/18) (Tables 3 and 4). Novel genes, includ- ing protein p53 binding protein 1 (TP53BP1) and Cyclin
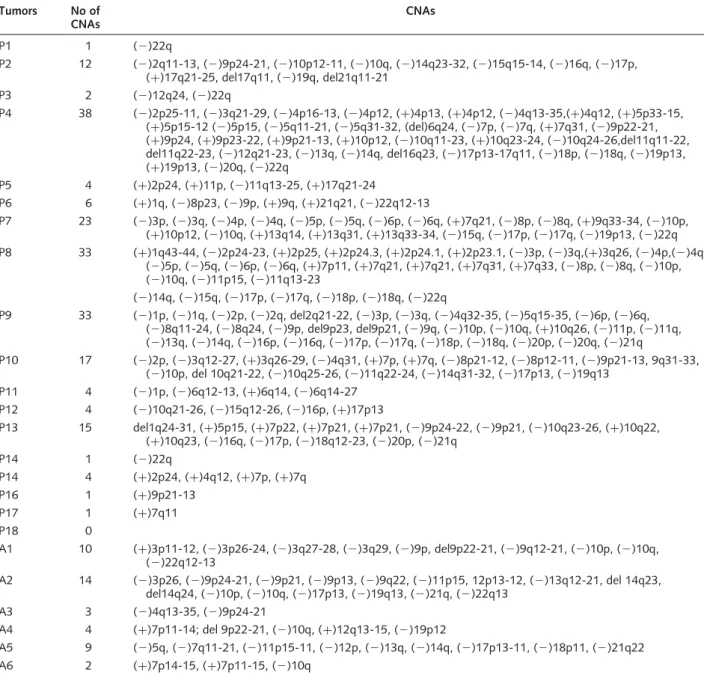
Table 2. CNAs identified in 18 pGBMs and aGBMs using the 100K SNP Illumina array Tumors No of
CNAs
CNAs
P1 1 (2)22q
P2 12 (2)2q11-13, (2)9p24-21, (2)10p12-11, (2)10q, (2)14q23-32, (2)15q15-14, (2)16q, (2)17p, (þ)17q21-25, del17q11, (2)19q, del21q11-21
P3 2 (2)12q24, (2)22q
P4 38 (2)2p25-11, (2)3q21-29, (2)4p16-13, (2)4p12, (þ)4p13, (þ)4p12, (2)4q13-35,(þ)4q12, (þ)5p33-15, (þ)5p15-12 (2)5p15, (2)5q11-21, (2)5q31-32, (del)6q24, (2)7p, (2)7q, (þ)7q31, (2)9p22-21, (þ)9p24, (þ)9p23-22, (þ)9p21-13, (þ)10p12, (2)10q11-23, (þ)10q23-24, (2)10q24-26,del11q11-22, del11q22-23, (2)12q21-23, (2)13q, (2)14q, del16q23, (2)17p13-17q11, (2)18p, (2)18q, (2)19p13, (þ)19p13, (2)20q, (2)22q
P5 4 (þ)2p24, (þ)11p, (2)11q13-25, (þ)17q21-24
P6 6 (þ)1q, (2)8p23, (2)9p, (þ)9q, (þ)21q21, (2)22q12-13
P7 23 (2)3p, (2)3q, (2)4p, (2)4q, (2)5p, (2)5q, (2)6p, (2)6q, (þ)7q21, (2)8p, (2)8q, (þ)9q33-34, (2)10p, (þ)10p12, (2)10q, (þ)13q14, (þ)13q31, (þ)13q33-34, (2)15q, (2)17p, (2)17q, (2)19p13, (2)22q P8 33 (þ)1q43-44, (2)2p24-23, (þ)2p25, (þ)2p24.3, (þ)2p24.1, (þ)2p23.1, (2)3p, (2)3q,(þ)3q26, (2)4p,(2)4q,
(2)5p, (2)5q, (2)6p, (2)6q, (þ)7p11, (þ)7q21, (þ)7q21, (þ)7q31, (þ)7q33, (2)8p, (2)8q, (2)10p, (2)10q, (2)11p15, (2)11q13-23
(2)14q, (2)15q, (2)17p, (2)17q, (2)18p, (2)18q, (2)22q
P9 33 (2)1p, (2)1q, (2)2p, (2)2q, del2q21-22, (2)3p, (2)3q, (2)4q32-35, (2)5q15-35, (2)6p, (2)6q, (2)8q11-24, (2)8q24, (2)9p, del9p23, del9p21, (2)9q, (2)10p, (2)10q, (þ)10q26, (2)11p, (2)11q, (2)13q, (2)14q, (2)16p, (2)16q, (2)17p, (2)17q, (2)18p, (2)18q, (2)20p, (2)20q, (2)21q
P10 17 (2)2p, (2)3q12-27, (þ)3q26-29, (2)4q31, (þ)7p, (þ)7q, (2)8p21-12, (2)8p12-11, (2)9p21-13, 9q31-33, (2)10p, del 10q21-22, (2)10q25-26, (2)11q22-24, (2)14q31-32, (2)17p13, (2)19q13
P11 4 (2)1p, (2)6q12-13, (þ)6q14, (2)6q14-27 P12 4 (2)10q21-26, (2)15q12-26, (2)16p, (þ)17p13
P13 15 del1q24-31, (þ)5p15, (þ)7p22, (þ)7p21, (þ)7p21, (2)9p24-22, (2)9p21, (2)10q23-26, (þ)10q22, (þ)10q23, (2)16q, (2)17p, (2)18q12-23, (2)20p, (2)21q
P14 1 (2)22q
P14 4 (þ)2p24, (þ)4q12, (þ)7p, (þ)7q
P16 1 (þ)9p21-13
P17 1 (þ)7q11
P18 0
A1 10 (þ)3p11-12, (2)3p26-24, (2)3q27-28, (2)3q29, (2)9p, del9p22-21, (2)9q12-21, (2)10p, (2)10q, (2)22q12-13
A2 14 (2)3p26, (2)9p24-21, (2)9p21, (2)9p13, (2)9q22, (2)11p15, 12p13-12, (2)13q12-21, del 14q23, del14q24, (2)10p, (2)10q, (2)17p13, (2)19q13, (2)21q, (2)22q13
A3 3 (2)4q13-35, (2)9p24-21
A4 4 (þ)7p11-14; del 9p22-21, (2)10q, (þ)12q13-15, (2)19p12
A5 9 (2)5q, (2)7q11-21, (2)11p15-11, (2)12p, (2)13q, (2)14q, (2)17p13-11, (2)18p11, (2)21q22
A6 2 (þ)7p14-15, (þ)7p11-15, (2)10q
A, adult glioblastoma; P, pediatric glioblastoma. (2) indicates an LOH; (þ) indicates an amplification or gain; “del” indicates a homozygous deletion.
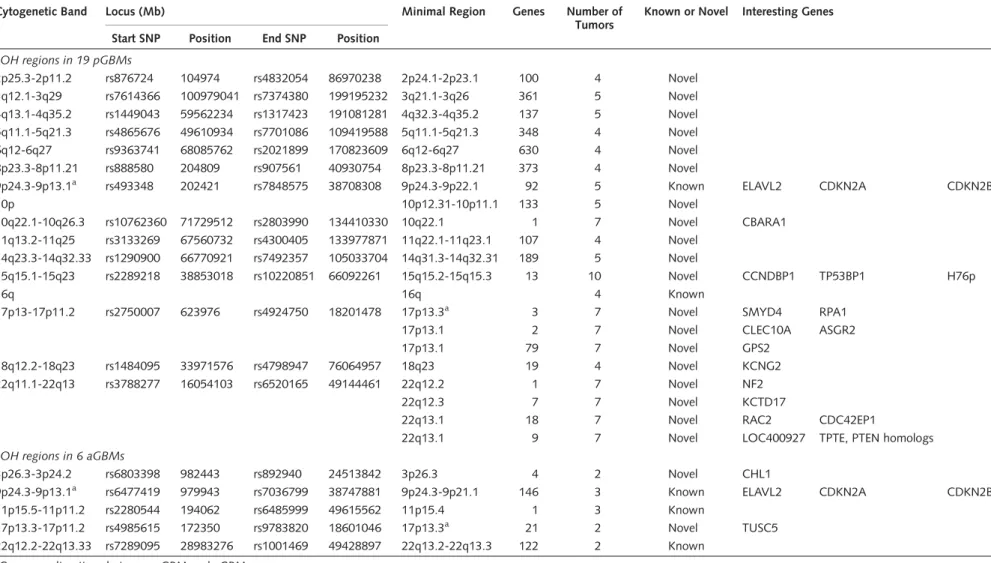
Table 3. LOH analysis showing distinct imbalances between pGBM and aGBM
Cytogenetic Band Locus (Mb) Minimal Region Genes Number of
Tumors
Known or Novel Interesting Genes Start SNP Position End SNP Position
LOH regions in 19 pGBMs
2p25.3-2p11.2 rs876724 104974 rs4832054 86970238 2p24.1-2p23.1 100 4 Novel 3q12.1-3q29 rs7614366 100979041 rs7374380 199195232 3q21.1-3q26 361 5 Novel 4q13.1-4q35.2 rs1449043 59562234 rs1317423 191081281 4q32.3-4q35.2 137 5 Novel 5q11.1-5q21.3 rs4865676 49610934 rs7701086 109419588 5q11.1-5q21.3 348 4 Novel
6q12-6q27 rs9363741 68085762 rs2021899 170823609 6q12-6q27 630 4 Novel
8p23.3-8p11.21 rs888580 204809 rs907561 40930754 8p23.3-8p11.21 373 4 Novel
9p24.3-9p13.1a rs493348 202421 rs7848575 38708308 9p24.3-9p22.1 92 5 Known ELAVL2 CDKN2A CDKN2B
10p 10p12.31-10p11.1 133 5 Novel
10q22.1-10q26.3 rs10762360 71729512 rs2803990 134410330 10q22.1 1 7 Novel CBARA1
11q13.2-11q25 rs3133269 67560732 rs4300405 133977871 11q22.1-11q23.1 107 4 Novel 14q23.3-14q32.33 rs1290900 66770921 rs7492357 105033704 14q31.3-14q32.31 189 5 Novel
15q15.1-15q23 rs2289218 38853018 rs10220851 66092261 15q15.2-15q15.3 13 10 Novel CCNDBP1 TP53BP1 H76p
16q 16q 4 Known
17p13-17p11.2 rs2750007 623976 rs4924750 18201478 17p13.3a 3 7 Novel SMYD4 RPA1
17p13.1 2 7 Novel CLEC10A ASGR2
17p13.1 79 7 Novel GPS2
18q12.2-18q23 rs1484095 33971576 rs4798947 76064957 18q23 19 4 Novel KCNG2
22q11.1-22q13 rs3788277 16054103 rs6520165 49144461 22q12.2 1 7 Novel NF2
22q12.3 7 7 Novel KCTD17
22q13.1 18 7 Novel RAC2 CDC42EP1
22q13.1 9 7 Novel LOC400927 TPTE, PTEN homologs
LOH regions in 6 aGBMs
3p26.3-3p24.2 rs6803398 982443 rs892940 24513842 3p26.3 4 2 Novel CHL1
9p24.3-9p13.1a rs6477419 979943 rs7036799 38747881 9p24.3-9p21.1 146 3 Known ELAVL2 CDKN2A CDKN2B
11p15.5-11p11.2 rs2280544 194062 rs6485999 49615562 11p15.4 1 3 Known
17p13.3-17p11.2 rs4985615 172350 rs9783820 18601046 17p13.3a 21 2 Novel TUSC5
22q12.2-22q13.33 rs7289095 28983276 rs1001469 49428897 22q13.2-22q13.3 122 2 Known
aCommon alterations between pGBM and aGBM.
Quetal.:SNParraysinpediatrichigh-gradeastrocytomas
NEURO-ONCOLOGY†FEBRUARY2010157
D-type binding-protein 1 (CCNDBP1), and two poten- tial tumor suppressor genes that regulate the p53and theRbpathways are within this LOH peak.
Analysis of Regional Chromosomal Amplification and Homozygous Deletions in GBMs
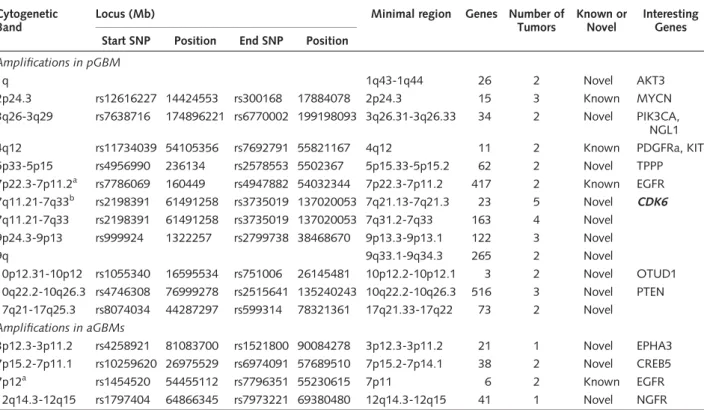
Only a small number of amplifications (defined as 4 copies or more) and homozygous deletions were found in the pGBM samples. These were mainly in regions close to the centromeres of Chrs 5, 7, 11, 19, and 20, where typically no genes are found (Table 3).
In contrast, chromosomal amplifications were more fre- quent in aGBMs (Tables 1 and 5). For example, all aGBMs had amplification of 4p16, 5p11, 11q11, and
20p11.2, and five of six had amplification in 8p23 and 19p12-13.3. Further, as expected and previously shown, epidermal growth factor receptor (EGFR) maps to the largest SNP cluster of amplification in Chr7p12 in two-thirds of the primary aGBMs included in this study (Table 5).25,26 In pGBM, a previously described amplification of 7p12 including EGFR was observed with a similar incidence to what is reported in the litera- ture (2 of 18; 10.5%). However, a new amplification in 7q21-22 includingCDK6(Cyclin D Kinase 6) was seen in 5 of 18 pGBMs. All tumors were supratentorial.
Interestingly, the latter is a known copy number variant with a seemingly higher incidence in pGBM than in the general population (5 of 18 versus 7 of 270; 26%
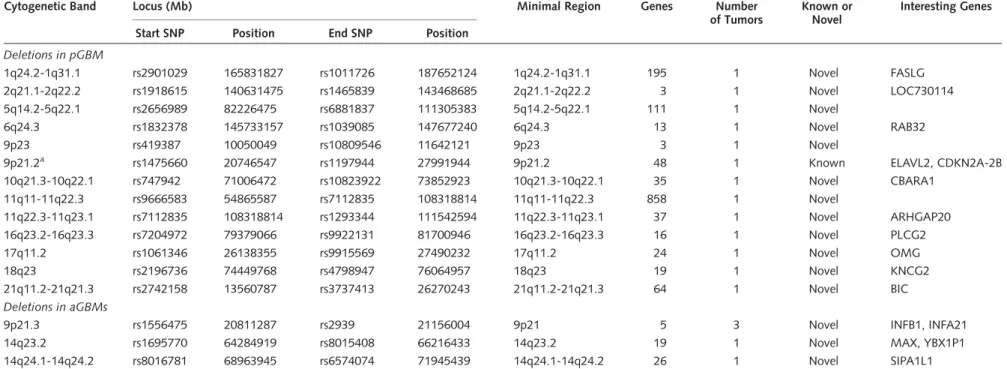
versus 3%, p,0.001, Fisher exact test). For regional homozygous chromosomal deletion, the most significant finding was the deletion of an SNP cluster in aGBMs con- taining interferon genes (IFNB1,IFNW1,IFNA21) that are important in the induction ofp53gene expression (Table 6).27 No homozygous deletions were observed in pGBM.
Validation of CNAs Identified in This Study
In the absence of control DNA from the same individual allowing confirmation that the CNAs we observed are tumor-derived and not a normal variant, we cross- referenced our data with the Database of Genomic Variants and the CEU study.28,29We additionally cross- referenced our data for the most relevant CNAs with data from a set of 1,363 control DNA analyzed with the Illumina Human-Hap 300K platform.30 This allowed us to identify some previously reported regions of common structural polymorphisms in the general popu- lation, further validating the other regions as tumor- specific LOHs (Tables 2– 6; see also Supplementary Material, Tables S1 and S2). We also compared our data with other available genotyping studies on pHGAs16 – 18 and on aHGAs9,31,32 as the number of adult cases used for comparison in this study is too few to make a meaningful conclusion. We also compared our data set to two publicly available 100K SNP array data sets on aHGAs (NCBI GEO DataSets as GSE9635 and GSE6109 Records).13,33 Cross-referencing our results with these data sets on aHGAs showed several commonalities with previously published studies, mainly for the adult patients included in our study (Pearson correlation, r: 0.83 and Tables 1– 6; see also Supplementary Material, Table S1); however, only few previously published CNAs were common with pGBM (Pearson correlation,r: 0.21). We further validated the data set against an independent data set of 9 pGBMs ana- lyzed using another SNP platform, the Affymetrix 250K SNP array that interrogates more than 200,000 loci and has a similar average resolution of 15 kb,34and obtained concordant results for several CNAs, further validating data obtained using the Illumina SNP arrays (see Supplementary Material, Fig. S2).
We also arbitrarily chose a set of genes involved in regions identified as homozygous deletions, LOH, or
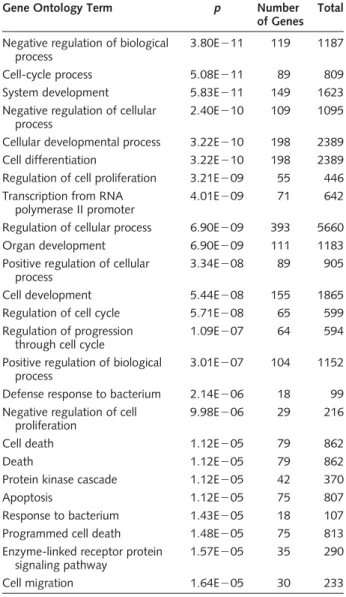
Table 4. Identification of statistically overrepresented gene ontologies (GOs) in the genes harbored in LOH regions analyzed using the GOstat tool (http://gostat.wehi.edu.au/cgi-bin/
goStat.pl)
Gene Ontology Term p Number
of Genes Total Negative regulation of biological
process
3.80E211 119 1187
Cell-cycle process 5.08E211 89 809
System development 5.83E211 149 1623
Negative regulation of cellular process
2.40E210 109 1095
Cellular developmental process 3.22E210 198 2389
Cell differentiation 3.22E210 198 2389
Regulation of cell proliferation 3.21E209 55 446 Transcription from RNA
polymerase II promoter
4.01E209 71 642
Regulation of cellular process 6.90E209 393 5660
Organ development 6.90E209 111 1183
Positive regulation of cellular process
3.34E208 89 905
Cell development 5.44E208 155 1865
Regulation of cell cycle 5.71E208 65 599
Regulation of progression through cell cycle
1.09E207 64 594
Positive regulation of biological process
3.01E207 104 1152
Defense response to bacterium 2.14E206 18 99 Negative regulation of cell
proliferation
9.98E206 29 216
Cell death 1.12E205 79 862
Death 1.12E205 79 862
Protein kinase cascade 1.12E205 42 370
Apoptosis 1.12E205 75 807
Response to bacterium 1.43E205 18 107
Programmed cell death 1.48E205 75 813
Enzyme-linked receptor protein signaling pathway
1.57E205 35 290
Cell migration 1.64E205 30 233
The complete database of annotated human genes was used as a control set. Results were filtered to include only GOs with a minimum path length of 5 and that fall under the biological process segment of the GO hierarchy.
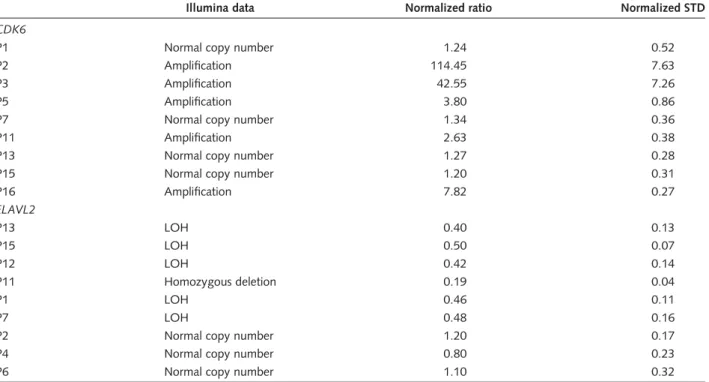
DNA amplification in our data set and validated these CNAs using quantitative real-time (qRT)-PCR on DNA extracted from the same tumors (Tables 5 and 6). ELAVL2 (embryonic lethal, abnormal vision, Drosophila-like 2), a gene located on 9p21, was within a region of LOH in 5 of 18 pGBMs and potentially deleted in 1 of 18. We confirmed these results using qRT-PCR (Table 7). Chromosomal amplification in pGBMs on 7q21-22, which containsCDK6, was ident- ified in 5 of 18 tumors. CDK6 amplification was also confirmed using qRT-PCR (Table 7).
Discussion
Understanding the molecular pathogenesis of pHGAs requires a detailed cataloguing of all the genetic lesions in the somatic lineage of this cancer. This study includes the largest cohort of pGBMs analyzed for genomic imbalances in tumor DNA and is the first to use high- resolution SNP arrays. While further confirming that aGBM and pGBM are genetically distinct cancers, we provide a comprehensive whole-genome map of CNAs for pGBM and identify, within regions of CNAs, altered genes and pathways for further analysis (Tables 1 –7).
Our data show findings in common with available array-based genomic studies on pGBM, including ELAVL2, CDKN2A, and CDKN2B deletions that have been reported in both pGBM and aGBM,
supporting the validity of our data set. However, pre- vious studies on pHGAs used arrays that had a lower res- olution of at least one log than the 100K and 250K arrays used in this study.16 In these former studies, as for BAC arrays, this resulted in a vast number of genetic abnormalities going undetected. We uncover herein several previously unidentified CNAs specific to pediatric tumors that help provide insight into molecular pathways involved in the genesis of pGBM. These CNAs include LOH in 15q15.1-15q23 and 17p13-17p11.2 and amplification of 7q21-22 and 1q43-44. Even if some CNAs are common to the pediatric and adult setting, their overall incidence will differ whether they occur in children or in adults. When we reviewed pub- lished data sets on aHGAs, commonalities with our find- ings on pGBM included LOH of 22q17p and 9p, whereas LOH of 3p21 and 10q21 and amplification of 7q, 2p, 9p, and 10q seemed specific to pGBM (see Supplementary Material, Table S2). As an added example, amplification of 7p12 includingEGFRis a fre- quent event in primary aGBMs (45%).9,35 We and others16,36 show amplification of 7p12 including EGFR in only rare cases of pediatric GBMs (less than 10%). Conversely, amplification of 7q21-22 including CDK6 is a rare event in aHGAs (one case report), whereas it was present in 5 of 18 pGBMs. In addition, as a consequence of the higher resolution of the arrays we used, the genetic interval subject to alteration in tumors will differ in pediatric and adult samples in many cases. For example, 10q LOH/deletion will
Table 5. Amplifications in pGBM and aGBM Cytogenetic
Band
Locus (Mb) Minimal region Genes Number of
Tumors
Known or Novel
Interesting Genes Start SNP Position End SNP Position
Amplifications in pGBM
1q 1q43-1q44 26 2 Novel AKT3
2p24.3 rs12616227 14424553 rs300168 17884078 2p24.3 15 3 Known MYCN
3q26-3q29 rs7638716 174896221 rs6770002 199198093 3q26.31-3q26.33 34 2 Novel PIK3CA, NGL1
4q12 rs11734039 54105356 rs7692791 55821167 4q12 11 2 Known PDGFRa, KIT
5p33-5p15 rs4956990 236134 rs2578553 5502367 5p15.33-5p15.2 62 2 Novel TPPP
7p22.3-7p11.2a rs7786069 160449 rs4947882 54032344 7p22.3-7p11.2 417 2 Known EGFR 7q11.21-7q33b rs2198391 61491258 rs3735019 137020053 7q21.13-7q21.3 23 5 Novel CDK6 7q11.21-7q33 rs2198391 61491258 rs3735019 137020053 7q31.2-7q33 163 4 Novel
9p24.3-9p13 rs999924 1322257 rs2799738 38468670 9p13.3-9p13.1 122 3 Novel
9q 9q33.1-9q34.3 265 2 Novel
10p12.31-10p12 rs1055340 16595534 rs751006 26145481 10p12.2-10p12.1 3 2 Novel OTUD1 10q22.2-10q26.3 rs4746308 76999278 rs2515641 135240243 10q22.2-10q26.3 516 3 Novel PTEN 17q21-17q25.3 rs8074034 44287297 rs599314 78321361 17q21.33-17q22 73 2 Novel
Amplifications in aGBMs
3p12.3-3p11.2 rs4258921 81083700 rs1521800 90084278 3p12.3-3p11.2 21 1 Novel EPHA3 7p15.2-7p11.1 rs10259620 26975529 rs6974091 57689510 7p15.2-7p14.1 38 2 Novel CREB5
7p12a rs1454520 54455112 rs7796351 55230615 7p11 6 2 Known EGFR
12q14.3-12q15 rs1797404 64866345 rs7973221 69380480 12q14.3-12q15 41 1 Novel NGFR
Seventeen (94.4%) of the 18 pediatric patients and all the 6 adult patients have at least one amplification. All the samples have at least 2 loci with amplification or homozygous deletion.
aCommon alterations between pGBM and aGBM.
bKnown CNA with a much higher incidence than the one found in the normal population.
Qu et al.: SNP arrays in pediatric high-grade astrocytomas
NEURO-ONCOLOGY † F E B R U A R Y 2 0 1 0 159
Table 6. Homozygous deletions in pGBM and aGBM
Cytogenetic Band Locus (Mb) Minimal Region Genes Number
of Tumors
Known or Novel
Interesting Genes
Start SNP Position End SNP Position
Deletions in pGBM
1q24.2-1q31.1 rs2901029 165831827 rs1011726 187652124 1q24.2-1q31.1 195 1 Novel FASLG
2q21.1-2q22.2 rs1918615 140631475 rs1465839 143468685 2q21.1-2q22.2 3 1 Novel LOC730114
5q14.2-5q22.1 rs2656989 82226475 rs6881837 111305383 5q14.2-5q22.1 111 1 Novel
6q24.3 rs1832378 145733157 rs1039085 147677240 6q24.3 13 1 Novel RAB32
9p23 rs419387 10050049 rs10809546 11642121 9p23 3 1 Novel
9p21.2a rs1475660 20746547 rs1197944 27991944 9p21.2 48 1 Known ELAVL2, CDKN2A-2B
10q21.3-10q22.1 rs747942 71006472 rs10823922 73852923 10q21.3-10q22.1 35 1 Novel CBARA1
11q11-11q22.3 rs9666583 54865587 rs7112835 108318814 11q11-11q22.3 858 1 Novel
11q22.3-11q23.1 rs7112835 108318814 rs1293344 111542594 11q22.3-11q23.1 37 1 Novel ARHGAP20
16q23.2-16q23.3 rs7204972 79379066 rs9922131 81700946 16q23.2-16q23.3 16 1 Novel PLCG2
17q11.2 rs1061346 26138355 rs9915569 27490232 17q11.2 24 1 Novel OMG
18q23 rs2196736 74449768 rs4798947 76064957 18q23 19 1 Novel KNCG2
21q11.2-21q21.3 rs2742158 13560787 rs3737413 26270243 21q11.2-21q21.3 64 1 Novel BIC
Deletions in aGBMs
9p21.3 rs1556475 20811287 rs2939 21156004 9p21 5 3 Novel INFB1, INFA21
14q23.2 rs1695770 64284919 rs8015408 66216433 14q23.2 19 1 Novel MAX, YBX1P1
14q24.1-14q24.2 rs8016781 68963945 rs6574074 71945439 14q24.1-14q24.2 26 1 Novel SIPA1L1
Fifteen (83.3%) of the 18 pediatric patients and all the 6 adult patients have at least one homozygous deletion. All the samples have at least 2 loci with amplification or homozygous deletion.
Homozygous deletion in 10q including PTEN was found in 4 of 6 adult tumors and is not included as it is a known alteration.
aCommon alterations between pGBM and aGBM.
al.:SNParraysinpediatrichigh-gradeastrocytomas
NEURO-ONCOLOGY†FEBRUARY2010
Table 7. Validation of Illumina Infinium 1 SNP-array data using qRT-PCR on selected genes
Illumina data Normalized ratio Normalized STD
CDK6
P1 Normal copy number 1.24 0.52
P2 Amplification 114.45 7.63
P3 Amplification 42.55 7.26
P5 Amplification 3.80 0.86
P7 Normal copy number 1.34 0.36
P11 Amplification 2.63 0.38
P13 Normal copy number 1.27 0.28
P15 Normal copy number 1.20 0.31
P16 Amplification 7.82 0.27
ELAVL2
P13 LOH 0.40 0.13
P15 LOH 0.50 0.07
P12 LOH 0.42 0.14
P11 Homozygous deletion 0.19 0.04
P1 LOH 0.46 0.11
P7 LOH 0.48 0.16
P2 Normal copy number 1.20 0.17
P4 Normal copy number 0.80 0.23
P6 Normal copy number 1.10 0.32
To validate results we obtained following the analysis of data from SNP arrays, we selected previously identified genes in high-grade astrocytomas that were included in regions showing chromosomal amplification (CDK6, amplification of Ch 7q21 in 5 tumors P2– P3–
P5 –P11– P16) or LOH or homozygous deletion (ELAVL2, LOH in P1 –P7 –P13– P15–P12, complete deletion in P11) and performed qRT-PCR on DNA extracted from the same tumors and from other tumors included in this study and showing no copy number change for these regions. Normalized ratio obtained using qRT-PCR was interpreted as follows:,0.2 homozygous deletion; 0.4,X,0.6 LOH;.2 amplification. Pediatric high-grade astrocytomas were numbered from 1 to 18 for clarity issues with the suffix P for pediatric.
CDK6, cyclin D kinase 6; ELAVL2, embryonic lethal, abnormal vision, drosophila-like 2; STD, standard deviation.
Fig. 1. Unsupervised hierarchical clustering of 24 GBMs (18 pediatric and 6 adult) and 1 control normal brain (CB). We used statistically significant CNAs present in at least one sample as data input (Welscht-test,p,0.001) and separated our data set accordingly. Pediatric (P) samples clustered separately from adult samples (A) and from the CB. DNA from one pediatric sample P1 was extracted from two separate parts of the same tissue sample. DNA from both extractions was independently subjected to whole-genome amplification prior to analysis on the 100K SNP array platform. P1a and P1b clustered similarly showing the reproducibility of the analysis of genome profiling. Primary adult glioblastoma (Ap) clustered separately from secondary adult glioblastoma (As).
Qu et al.: SNP arrays in pediatric high-grade astrocytomas
NEURO-ONCOLOGY † F E B R U A R Y 2 0 1 0 161
include the PTEN gene (10q23.31) in adults whereas the genetic interval will be different in children and LOH on 10q will not include it (10q21.3-10q22.1).
Cell-cycle abnormalities, including alterations of the p53and the RB1pathways, play an important role in the genesis of HGAs, including pHGAs.20,26As shown in the analysis of genes included in the CNA regions (Tables 3– 6) and by the gene ontology analysis (Table 4), genes associated with the cell-cycle check- points and genes involved in the regulation of cell-cycle and cell-death pathways are the major targets of LOHs in pGBM. For example, we identified recurrent LOHs in several tumors that encompass several genes including H76p, TP53BP1, and CCNDBP1 on 15p (Table 3).
H76p is associated with the g-tubulin complexes and may participate in the nucleation process.37 TP53BP1 is a conserved checkpoint protein with properties of a DNA double-strand break sensor. It binds to the central domain ofp53, enhancing transactivation, and its deletion may play an important role by impairing function of tumor protein p53 (TP53).38CCNDBP1is a helix– loop –helix leucine zipper protein, recently identified as a novel tumor suppressor in epithelial cancers, showing LOH and/or deletions on Chr15.39It decreases the levels of Cyclin D expression, reducing the phosphorylation of RB1, thus regulating the RB1 pathway and cell growth.39
The rare gene containing regions showing genomic amplification in pGBM included 7q21-22 in 5 pGBMs (Table 5). This region is interesting from two stand- points. It includes CDK6, which encodes for a kinase also regulating the RB1 pathway. Amplification of CDK6 in this subset of pGBM was validated by qRT-PCR (Table 7) and has not been previously reported in pHGAs. In aHGAs, amplification ofCDK6 has been reported in only one patient, whereas its over- expression, without genetic amplification, is more common (40%). Secondly, a CNA found with statisti- cally higher frequency in a given tumor is likely a germ- line predisposition to the tumor. 7q21-22 seems to be amplified in a small percentage of the normal popu- lation, and the higher incidence of its amplification in pGBM, when further confirmed, may indicate an
association of a common variant with susceptibility to these tumors (Table 5).
Little is known on the genetics of pGBM and our study fills an important gap in understanding this pedi- atric brain tumor. Moreover, the considerable wealth of information on the molecular genetics of aHGA is often projected onto the pediatric population without critical comparison between these two different disease contexts. Our data document how profound these differ- ences are. We propose that analyses such as the one pre- sented in this study may ultimately guide mapping of oncogenic signaling networks unique to pGBM, identifi- cation of the related therapeutic predictors and targets, and development of more effective therapies.
Alteration of copy number for genes involved in p53 and the RB pathways including, for example, amplifica- tion ofCDK6, or LOH ofCCNDBP1or TP53BP1, are some of the interesting findings unraveled in our data set that will help shed light on the unique molecular patho- genesis of this disease, providing hope of developing new therapeutic strategies to improve survival in a devastat- ing cancer.
Supplementary Material
Supplementary material is available atNeuro-Oncology Journalonline.
Acknowledgments
This work was supported by the Canadian Institutes of Health Research, the Cole Foundation, One Day at a Time, and the Vinchiaturese Association (N.J.), the Hungarian Scientific Research Fund (OTKA) Contract No. T-04639, and the National Research and Development Fund (NKFP) Contract No. 1A/002/
2004 (P.H., M.G., L.B., and Z.H.). H.Q. and K.J. are the recipients of a fellowship and a studentship, respect- ively, from the Canadian Institutes of Health Research.
N.J. is the recipient of a Chercheur Boursier Award from Fonds de la Recherche en Sante du Quebec.
Conflict of interest statement. None declared.
References
1. Broniscer A. Past, present, and future strategies in the treatment of high-grade glioma in children.Cancer Invest. 2006;24:77 – 81.
2. Vissers LE, Veltman JA, van Kessel AG, et al. Identification of disease genes by whole genome CGH arrays. Hum Mol Genet. 2005;
14(2):R215– R223.
3. Pinkel D, Albertson DG. Comparative genomic hybridization.Annu Rev Genomics Hum Genet. 2005;6:331 – 354.
4. He M, Rosen J, Mangiameli D, et al. Cancer development and pro- gression.Adv Exp Med Biol. 2007;593:117 – 133.
5. Thomas R, Scott A, Langford CF, et al. Construction of a 2-Mb resol- ution BAC microarray for CGH analysis of canine tumors.Genome Res. 2005;15:1831 – 1837.
6. Altshuler D, Brooks LD, Chakravarti A, et al. A haplotype map of the human genome.Nature. 2005;437:1299 – 1320.
7. Gunderson KL, Steemers FJ, Lee G, et al. A genome-wide scalable SNP genotyping assay using microarray technology. Nat Genet.
2005;37:549– 554.
8. Dutt A, Beroukhim R. Single-nucleotide polymorphism array analysis of cancer.Curr Opin Oncol. 2007;19:43 – 49.
9. Maher EA, Brennan C, Wen PY, et al. Marked genomic differences characterize primary and secondary glioblastoma subtypes and identify two distinct molecular and clinical secondary glioblastoma entities.
Cancer Res. 2006;66:11502 – 11513.
10. Nigro JM, Misra A, Zhang L, et al. Integrated array-comparative genomic hybridization and expression array profiles identify clinically relevant molecular subtypes of glioblastoma. Cancer Res.
2005;65:1678 – 1686.
11. Rich JN, Hans C, Jones B, et al. Gene expression profiling and genetic markers in glioblastoma survival. Cancer Res. 2005;65:
4051 – 4058.
12. Phillips HS, Kharbanda S, Chen R, et al. Molecular subclasses of high- grade glioma predict prognosis, delineate a pattern of disease pro- gression, and resemble stages in neurogenesis. Cancer Cell.
2006;9:157 – 173.
13. Kotliarov Y, Steed ME, Christopher N, et al. High-resolution global genomic survey of 178 gliomas reveals novel regions of copy number alteration and allelic imbalances. Cancer Res. 2006;66:
9428 – 9436
14. Horvath S, Zhang B, Carlson M, et al. Analysis of oncogenic signaling networks in glioblastoma identifies ASPM as a molecular target.Proc Natl Acad Sci USA., 2006;103:17402 – 17407.
15. McLendon R, Friedman A, Bigner D, et al. Comprehensive genomic characterization defines human glioblastoma genes and core pathways.
Nature. 2008;455:1061 – 1068.
16. Wong KK, Tsang YT, Chang YM, et al. Genome-wide allelic imbalance analysis of pediatric gliomas by single nucleotide polymorphic allele array.Cancer Res. 2006;66:11172 – 11178.
17. Warr T, Ward S, Burrows J, et al. Identification of extensive genomic loss and gain by comparative genomic hybridisation in malignant astrocy- toma in children and young adults. Genes Chromosomes Cancer.
2001;31:15 – 22.
18. Rickert CH, Strater R, Kaatsch P, et al. Pediatric high-grade astrocyto- mas show chromosomal imbalances distinct from adult cases.Am J Pathol. 2001;158:1525 – 1532.
19. Faury D, Nantel A, Dunn SE, et al. Molecular profiling identifies prog- nostic subgroups of pediatric glioblastoma and shows increased YB-1 expression in tumors.J Clin Oncol. 2007;25:1196– 1208.
20. Rood BR, Macdonald TJ. Pediatric high-grade glioma: molecular genetic clues for innovative therapeutic approaches. J Neurooncol.
2005;75(3):267 – 272.
21. Steemers FJ, Gunderson KL. Illumina, Inc. Pharmacogenomics.
2005;6:777 – 782.
22. Peiffer DA, Le JM, Steemers FJ, et al. High-resolution genomic profiling of chromosomal aberrations using Infinium whole-genome genotyping.
Genome Res. 2006;16:1136 – 1148.
23. La Rosa P, Viara E, Hupe P, et al. VAMP: visualization and analysis of array-CGH, transcriptome and other molecular profiles.
Bioinformatics. 2006;22:2066 – 2073.
24. Greshock J, Feng B, Nogueira C, et al. A comparison of DNA copy number profiling platforms.Cancer Res. 2007;67:10173 – 10180.
25. Wong AJ, Bigner SH, Bigner DD, et al. Increased expression of the epi- dermal growth factor receptor gene in malignant gliomas is invariably associated with gene amplification. Proc Natl Acad Sci USA.
1987;84:6899 – 6903.
26. Zhu Y, Parada LF. The molecular and genetic basis of neurological tumours.Nat Rev Cancer. 2002;2:616 – 626.
27. Takaoka A, Hayakawa S, Yanai H, et al. Integration of interferon-alpha/
beta signalling to p53 responses in tumour suppression and antiviral defence.Nature. 2003;424:516 – 523.
28. Conrad DF, Andrews TD, Carter NP, et al. A high-resolution survey of deletion polymorphism in the human genome. Nat Genet.
2006;38:75– 81.
29. Hinds DA, Kloek AP, Jen M, et al. Common deletions and SNPs are in linkage disequilibrium in the human genome. Nat Genet.
2006;38:82– 85.
30. Hakonarson H, Grant SF, Bradfield JP, et al. A genome-wide association study identifies KIAA0350 as a type 1 diabetes gene. Nature.
2007;448:591 – 594.
31. Bredel M, Bredel C, Juric D, et al. High-resolution genome-wide mapping of genetic alterations in human glial brain tumors.Cancer Res. 2005;65:4088 – 4096.
32. Liu F, Park PJ, Lai W, et al. A genome-wide screen reveals functional gene clusters in the cancer genome and identifies EphA2 as a mitogen in glioblastoma.Cancer Res. 2006;66:10815 – 10823.
33. Beroukhim R, Getz G, Nghiemphu L, et al. Assessing the significance of chromosomal aberrations in cancer: methodology and application to glioma.Proc Natl Acad Sci USA. 2007;104:20007 – 20012.
34. Mullighan CG, Goorha S, Radtke I, et al. Genome-wide analysis of genetic alterations in acute lymphoblastic leukaemia. Nature.
2007;446:758 – 764.
35. Ohgaki H, Dessen P, Jourde B, et al. Genetic pathways to glioblastoma:
a population-based study.Cancer Res. 2004;64:6892 – 6899.
36. Pollack IF, Hamilton RL, James CD, et al. Rarity of PTEN deletions and EGFR amplification in malignant gliomas of childhood: results from the Children’s Cancer Group 945 cohort. J Neurosurg.
2006;105:418 – 424.
37. Fava F, Raynaud-Messina B, Leung-Tack J, et al. Human 76p: a new member of the gamma-tubulin-associated protein family.J Cell Biol.
1999;147:857 – 868.
38. Wang B, Matsuoka S, Carpenter PB, et al. 53BP1, a mediator of the DNA damage checkpoint.Science. 2002;298:1435 – 1438.
39. Ma W, Stafford LJ, Li D, et al. GCIP/CCNDBP1, a helix–loop–helix protein, suppresses tumorigenesis.J Cell Biochem. 2007;100:1376–1386.
Qu et al.: SNP arrays in pediatric high-grade astrocytomas
NEURO-ONCOLOGY † F E B R U A R Y 2 0 1 0 163