New voting functions for neural network algorithms
Tibor Tajti
Eszterházy Károly University tajti.tibor@uni-eszterhazy.hu
Submitted: August 16, 2020 Accepted: October 21, 2020 Published online: October 21, 2020
Abstract
Neural Network and Convolutional Neural Network algorithms are among the best performing machine learning algorithms. However, the performance of the algorithms may vary between multiple runs because of the stochastic nature of these algorithms. This stochastic behavior can result in weaker accuracy for a single run, and in many cases, it is hard to tell whether we should repeat the learning giving a chance to have a better result. Among the useful techniques to solve this problem, we can use the committee machine and the ensemble methods, which in many cases give better than average or even better than the best individual result. We defined new voting function variants for ensemble learner committee machine algorithms which can be used as competitors of the well-known voting functions. Some belong to the locally weighted average voting functions, others are meta voting functions calculated from the output of the previous voting functions functions called with the results of the individual learners. The performance evaluation of these methods was done from numerous learning sessions.
Keywords:Machine learning, neural networks, committee machines, ensemble methods
MSC:92B20, 03B70, 03B52
1. Introduction
One of the most widely used machine learning algorithms is the Artificial Neu- ral Network or its Deep and Convolutional variants [7, 12, 19]. Neural network doi: https://doi.org/10.33039/ami.2020.10.003
url: https://ami.uni-eszterhazy.hu
229
algorithms are supervised machine learning algorithms, widely used in machine learning. Its major applications include classification, regression, pattern recogni- tion, function approximation, intelligent control, learning from data. The neural network is a set of interconnected artificial neurons and the appropriate algorithms working on them [7].
A variation of the multi-layer perceptron model is the convolutional neural network. LeNet was one of the very first convolutional neural networks creating an area of deep learning. Yann LeCun’s pioneering work has been named LeNet-5, after many successful iterations [12]. CNNs have a convolution operator, hence the name convolutional network. This convolution operator does feature extraction, e.g. when learning to classify a 2D image, smaller (e.g.3×3or5×5 pixels) parts of the image will be processed as a sliding window over the whole image, so the network learns such smaller-scale features of the images.
The knowledge of experts can be very useful in machine learning as well. When several learner algorithms learn the same problem or parts of the problem their knowledge can be combined in numerous ways [5, 17, 23]. This can be used both for getting satisfactory results from weak learners and for reaching top performance when using strong learners. Since multiple learners have proven to be more success- ful when we combine their results through voting, we defined new voting functions and measured their performance with ensemble learners in different group sizes.
Committee machine algorithms and ensemble methods use multiple neural net- works or other machine learning algorithms to make predictions and combine their results [22]. This can work with multiple instances of the same algorithm (e.g. [4]) or different algorithms or models (e.g. [9]) as well. Several simple committee ma- chine variants are used efficiently with committees voting on the same problem and combining their results with voting functions.
Note that many voting functions are available, e.g. minimum, maximum, me- dian voting [10]. We use the most well-known voting functions: fuzzy average, weighted fuzzy average, plurality, borda and product voting.
Ensemble methods have been very successful in setting record performance on challenging data sets [17]. Ensemble learners can also be used combined with other methods that can be used with machine learning algorithms, e.g. the fuzzification of training data binary class membership values [21], to have the advantage of using fuzzy truth values instead of the binary truth values [2, 3, 6, 8, 16, 24].
The most well-known committee machine voting functions are described in the followings. For each voting function, first let𝑜𝑖 be the actual output vector of class membership values predicted by learner𝑖for the actual sample given as input.
We note that training data can be changed dynamically, e.g. for time series prediction often we get new training data periodically.
1.1. Voting functions
1.1.1. Fuzzy average voting
Averaging is one of the most simple linear combiner voting schemes having the1/𝑁 weight for the outputs of each learner [20]. Calculate the average of the individual predictions: 𝑜[𝑗] = 𝑁1 ∑︀𝑛
𝑖=1𝑜𝑖[𝑗]for each𝑗output class, where𝑁 is the number of learners, 𝑜𝑖[𝑗] is the jth element (class membership value) in the output vector of the prediction. Then find for each sample the class with the highest membership value as the chosen class for the given sample (𝑙= argmax(𝑜)).
1.1.2. Plurality voting [18]
Find for each learner 𝑖, the class with the highest membership value from the prediction𝑜𝑖. If it is at indexℎ𝑖 (ℎ𝑖= argmax(𝑜𝑖)), then then let
𝑐𝑖[𝑗] =
{︃1, if𝑗=ℎ𝑖, 0, otherwise, for all𝑗 classes.
Then calculate the sum 𝑐[𝑗] = 𝑁1 ∑︀𝑛
𝑖=1𝑐𝑖[𝑗] for each𝑗 classes, where𝑁 is the number of learners. The winner of the voting for the sample is a class with the maximum value 𝑙 = argmax(𝑐). We note, that sometimes this method is called majority voting, although majority voting means choosing the winner only if more than 50% of the learners have voted on it. When using majority voting it is recommended to use an odd number of voters.
1.1.3. Borda voting [1]
For each individual learner 𝑖, calculate the index𝑠𝑖[𝑗]in order of the membership values from the prediction𝑜𝑖[𝑗]. Let𝑠𝑖[𝑗] be 𝑛if𝑜𝑖[𝑗]has the nth smallest value, for each𝑗 class for each 𝑖learner. Then calculate the sum𝑠[𝑗] = 𝑁1 ∑︀𝑛
𝑖=1𝑠𝑖[𝑗] for each 𝑗 classes, where 𝑁 is the number of learners used for the prediction. The winner of the voting is a class with the maximum values 𝑙= argmax(𝑠).
1.1.4. Nash (product) voting [1]
For each class 𝑗 evaluate the product of the predictions of all of the 𝑖 individual learners: 𝑜[𝑗] = ∏︀𝑁
𝑖=𝑗𝑜𝑖[𝑗] Then find for each sample the class with the highest membership value(𝑙= argmax(𝑜)).
We note that the fuzzy voting and the product voting can be used for regression as well, while plurality voting and borda voting are suitable for classification only.
These voting functions can be applied simply on the predictions of the individual learners which have learned either sequentially or in parallel.
2. New voting functions for neural network classi- fiers
We propose the addition of new variants for committee machine voting functions which in some cases might have better performance compared to the well-known voting functions. We note that our experiment was done using convolutional neural network classifiers, however, these voting functions might be used for every classifier which can produce fuzzy output values, as well. The good performance and the variety of the well-known committee machines motivated us to develop our new ones. We defined the following new committee machine voting functions which we will compare with some of the well-known voting functions. Some of the proposed new voting functions belong to the locally weighted average voting functions [22], others are meta voters using the previous ones.
2.1. Fuzzy average voting weighted by the confidence
Fuzzy average voting can be weighted by confidence [14]. Here we propose a simple function with getting a confidence from the class membership values. This method obviously needs less performance compared to other more advanced methods. Class membership values closer to 0 or 1 will have stronger weight, we transform the output of the individual learners before calculating the fuzzy average, so that the values which are considered uncertain (not close to 0 or 1) values will be less important by multiplying with a smaller weight. Given the network output 𝑜𝑖[𝑗]
for each 𝑖 learners for each 𝑗 classes we calculate the combined result with the following formula:
𝑜[𝑗] = 1 𝑁
∑︁𝑁
𝑖=1
((𝑜𝑖[𝑗]−0.5)(2𝑜𝑖[𝑗]−1)2+ 0.5).
Then we get the winner class from this weighted average: 𝑙= argmax(𝑜).
2.2. Fuzzy average voting weighted by 1-difference from the combined output
Knowing the outputs of the learners we can base another weighted average method based on the better performance of the fuzzy average compared to the individual learners. Starting with the calculation of the fuzzy average, individual predictions will be multiplied by a weight that is the difference from the ensemble prediction subtracted from1. Let𝑜[𝑗]be calculated as defined for the fuzzy voting in Section 1.
Then we calculate the new variant as follows:
𝑜′[𝑗] = 1 𝑁
∑︁𝑁
𝑖=1
((𝑜𝑖[𝑗]−0.5)(1− |𝑜𝑖[𝑗]−𝑜[𝑗]|) + 0.5).
We can find the winner class from the weighted average: 𝑙= argmax(𝑜′).
2.3. Fuzzy average voting weighted by the reciprocal value of the number of failed training samples
Let 𝑓𝑖 be the number of failed (misclassified) samples for each learner 𝑖, of the training dataset. The reciprocal value of 𝑓𝑖 will be used as the weight for the learner𝑖if𝑓𝑖 is not equal to 0, otherwise we use a maximal weight, e.g. 2.
𝑜[𝑗] = 1 𝑁
∑︁𝑁
𝑖=1
𝑜𝑖[𝑗]
𝑓𝑖
From this weighted average we get the winner class: 𝑙= argmax(𝑜).
2.4. Geometric mean (Nash voting with 𝑁 th root)
We create a variant of the Nash (product) vote function for using in meta voting function as well. Since with higher number of voters (𝑁) the product of many values from the interval[0,1]can be a very small number, much smaller than e.g. the fuzzy average, so we take the 𝑁th root of the product, getting the geometric mean of the output values. We note that the geometric mean will choose the same winner as the Nash (product) voting, since the Nth root function is strictly monotonically increasing over the interval[0,1]. For each class𝑗 evaluate the product sum of the predictions of all of the𝑖 individual learners:
𝑜[𝑗] = 𝑁
⎯⎸
⎸⎷∏︁𝑁
𝑖=1
𝑜𝑖[𝑗].
Then find the class with the highest membership value(𝑙= argmax(𝑜)).
2.5. Meta-voting variants
Fuzzy average or plurality vote by combining selected voting functions by calcu- lating the fuzzy average or the plurality of votes on the classes of the results of the selected voting functions. For analysis purposes, we define three meta voter variants.
• V8: Plurality voting from the results of V1, V2, V3, V4, V5, V6, V7
• V9: Plurality voting from the results of V1, V2, V3, V4, V7
• V10: Fuzzy average voting from the results of V1, V2, V3, V4, V7
For the above three meta voting functions, we calculate the results of the needed voting functions first, then we combine them as it was described above for the voting functions calculated from the results of the individual learners.
We note that any data used to calculate the weights certainly can only be part of the training data or result of the learning process, without any knowledge
about test data or performance on test data. We also note that plurality vote and borda vote functions do not give fuzzy class membership values, so they cannot be combined well by fuzzy average with the fuzzy results of other voters. So for the performance evaluation, we will use three meta voter functions described above (V8, V9, V10) for the better understanding and comparison possibility.
3. Performance evaluation of voter functions
3.1. Performance evaluation framework
We performed our evaluation using NVIDIA and AMD GPUs with the Tensorflow framework. Our simple system was based on a file interface allowing to run on multiple machines. For the experiments, we have used two convolutional neural network learning algorithms with different strength. They were built as modified variants of [15].
We used the MNIST database of handwritten digits [13] to perform our research.
The accuracy results may vary because of the stochastic nature of the algorithms, so many learning sessions were executed, and their average results were analysed. We can choose from many voting functions, e.g. fuzzy averaging, plurality(or majority) voting, etc. In our research, we have compared the results of some of the most well- known voting functions with our newly defined ones.
For the analyses, we used the Python Numpy and Pandas frameworks. The algorithms run with different epoch counts to see the behavior of our proposed algorithm variations not only with the statistically best settings. In the following subsection we will show the performance of the proposed voting functions. For the evaluation we run about one million learning sessions with three convolutional neural network algorithms modified according to our proposed methods.
We have executed several experiments with two algorithms of different strengths.
The first algorithm variant was built from the algorithm introduced in, the second variant was developed based on the algorithm. The algorithm variations were exe- cuted with different parameters, e.g. number of epochs to run, number of instances in the ensembles and parameters for the fuzzification of binary class membership values of training data, including parameters which keep the original class mem- bership values. We note that we have executed many learning sessions without fuzzification in order to have more reliable results for comparison.
3.2. Performance of voting functions
For the evaluation, we have included the well-known voter schemes and our new variants as well. We have implemented the following voting functions:
• V1: fuzzy voting, i.e. averaging
• V2: fuzzy variant – average of individual predictions weighted by a confidence estimation of the class membership values
• V3: fuzzy variant – average of individual predictions weighted by 1-difference from V1 results, predictions will be multiplied by a weight which is the dif- ference from the ensemble prediction subtracted from the value 1.0
• V4: fuzzy variant – average of individual predictions weighted by 1/training failures
• V5: plurality voting
• V6: borda voting
• V7: geometric mean voting (instead of product voting)
• V8: meta-voter: plurality vote by using all the above voting functions
• V9: meta-voter: plurality meta vote of voters without the plurality and borda voting (V1–V4, V7)
• V10: meta voter: fuzzy average meta vote of voters without the plurality and borda voting (V1–V4, V7)
We note that variations of the plurality vote also can be applied [11] however plurality and borda votes are not among the best performing voting functions according to our measurements, we included them for reference and comparison purposes.
3.2.1. Voting experiment 1 with algorithm based on [14]
Our first experiment on voting schemes has been run 1000 times. In each turn 6–20 voters voted with the voting functions (V1–V10) described above.
Voting function MIN AVG MAX
max(accuracy) 0.995600 0.997043 0.998000
avg(accuracy) 0.995188 0.996306 0.997260
min(accuracy) 0.992700 0.995422 0.996900
V1 – fuzzy average 0.996000 0.997351 0.998400 V2 – weighted by confidence 0.995900 0.997360 0.998300 V3 – weighted by diff from V1 0.996000 0.997346 0.998300 V4 – weighted by 1/failures 0.995500 0.997321 0.998300 V5 – plurality voting 0.995500 0.997280 0.998400
V6 – borda voting 0.995600 0.997296 0.998400
V7 – geometric mean voting 0.996000 0.997367 0.998300 V8 – meta – plurality (V1–V7) 0.995900 0.997353 0.998400 V9 – meta – plurality (V1–V4, V7) 0.996000 0.997356 0.998400 V10 – meta – fuzzy avg (V1–V4, V7) 0.996100 0.997350 0.998300
Table 1
Table 1 shows the accumulated results of the tested voting functions with the minimum, average and maximum number of the failed samples of the individual learners included. The best individual result was 20 fails of 10000 test samples, the worst was 73 failed samples and on average they performed as low as 36.94 fails from 10000 samples as individual learners. The well-known fuzzy voting performed 26.49 fails on average. There were no big differences among the voting functions, the best result came from the product voting (V7) from committee results on training failures. For some of the best performing voting functions (V1, V2, V7) we also show the accuracy achieved by them with different number of voters.
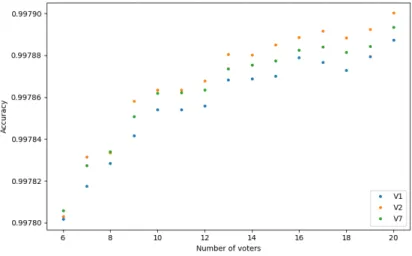
Figure 1: The performance results of our algorithm with V1 fuzzy average voting function by 6-20 voters on average on test data using
different epoch counts (15, 17, 19, 20).
As we can see on Figure 1 the three voting functions show similar behavior. All of them were performing better with more voters.
3.2.2. Voting experiment 2 with algorithm based on [15]
The second experiment ran 1000 training sessions on a slightly better algorithm, a modified version of [15]. It was executed with different epoch counts (15, 17, 19, 20) to eliminate the effect of a possibly statistically optimized epoch count for a specific dataset.
Table 2 shows the results where in each turn 6–20 voters cast their votes which were then combined using the voter functions defined above. The best individual result was 15 fails from 10000 test samples, the worst individual result was 44 failed samples and on average they performed only 27.55 fails as individual learners.
The well-known fuzzy voting performed 21.41 fails on average. There were no big differences among the voting functions, the best average result (21.28 fails on
Voting function MIN AVG MAX
max(accuracy) 0.996700 0.997795 0.998500
avg(accuracy) 0.996580 0.997245 0.997880
min(accuracy) 0.995600 0.996662 0.997600
V1 – fuzzy average 0.996700 0.997859 0.998700 V2 – weighted by confidence 0.996600 0.997863 0.998600 V3 – weighted by diff from V1 0.996700 0.997857 0.998700 V4 – weighted by 1/training failures 0.996800 0.997872 0.998700 V5 – plurality voting 0.996500 0.997786 0.998600 V6 – borda voting 0.996600 0.997791 0.998600 V7 – geometric mean voting 0.996700 0.997861 0.998700 V8 – meta – plurality (V1-V7) 0.996700 0.997860 0.998700 V9 – meta – plurality (V1-V4,V7) 0.996700 0.997862 0.998700 V10 – meta – fuzzy avg (V1-V4,V7) 0.996700 0.997857 0.998700
Table 2
average) came from the fuzzy voting weighted by the reciprocal value of training failures (V4).
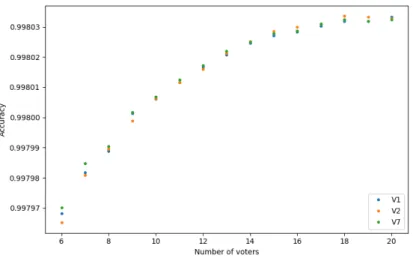
Also, we can check whether the difference between the voting functions depends on the number of voters. On the next figure, we can check that for three of the best performing voting functions.
Figure 2: The performance results of our algorithm with V1 fuzzy average voting function by 6-20 voters on average on test data using different parameters for the fuzzification of the training data class
membership values.
3.2.3. Voting experiment 3 with algorithm based on [15]
The third experiment ran also 1000 times on a modified version of [15]. It was executed with 20 epochs for each learner.
Voting function MIN AVG MAX
max(accuracy) 0.997100 0.997914 0.998500
avg(accuracy) 0.996840 0.997418 0.997886
min(accuracy) 0.996200 0.996878 0.997700
V1 – fuzzy average 0.997300 0.998126 0.998700 V2 – weighted by confidence 0.997300 0.998122 0.998700 V3 – weighted by diff from V1 0.997200 0.998128 0.998700 V4 – weighted by 1/failures 0.997300 0.998126 0.998700 V5 – plurality voting 0.997000 0.998044 0.998700
V6 – borda voting 0.997000 0.998044 0.998700
V7 – geometric mean voting 0.997100 0.998126 0.998700 V8 – meta – plurality (V1–V7) 0.997200 0.998125 0.998700 V9 – meta – plurality (V1–V4, V7) 0.997200 0.998128 0.998700 V10 – meta – fuzzy avg (V1–V4, V7) 0.997200 0.998129 0.998700
Table 3
Table 3 shows the results where in each turn 6-20 voters voted using the above- defined voter functions. The best individual result was 15 fails from 10000 test samples, the worst individual result was 38 failed samples and on average they performed only 25.82 fails as individual learners. The well-known fuzzy voting per- formed 18.74 on average. There were no big differences among the voting functions, the best result (18.71 fails) came from our meta fuzzy voter function (V10).
3.2.4. Voting experiment 4 with algorithm based on [15]
Our last experiment to compare voting functions also ran 1000 training sessions on a similar modified version of [15]. This time we also added a 0.2 dropout to the algorithm. Dropout is a useful regularization method, which helps to eliminate the overfitting in general, as well as in our case is useful for the fuzzification of the training data class membership values.
Table 4 shows the results of the experiment where in each turn 6–20 voters voted using the voting functions V1–V10. The best individual result was 17 fails from 10000 test samples, the worst individual result was 42 failed samples and on average they performed only 26.35 fails as individual learners. The well-known fuzzy voting performed 21.76 fails on average. There were no big differences among the voting functions, the best result came from our fuzzy voting weighted by the reciprocal value of training failures (V4).
Figure 3: The performance results of our algorithm with V1 fuzzy average voting function by 6-20 voters on average on test data using different parameters for the fuzzification of the training data class
membership values.
Voting function MIN AVG MAX
max(accuracy) 0.996900 0.997805 0.998300
avg(accuracy) 0.996740 0.997365 0.997980
min(accuracy) 0.995800 0.996841 0.997700
V1 – fuzzy average 0.996800 0.997824 0.998600 V2 – weighted by confidence 0.996900 0.997809 0.998600 V3 – weighted by diff from V1 0.996900 0.997833 0.998600 V4 – weighted by 1/failures 0.996800 0.997835 0.998600 V5 – plurality voting 0.996600 0.997721 0.998500
V6 – borda voting 0.996600 0.997733 0.998500
V7 – geometric mean voting 0.996800 0.997826 0.998600 V8 – meta – plurality (V1–V7) 0.996800 0.997829 0.998600 V9 – meta – plurality (V1–V4, V7) 0.996800 0.997828 0.998600 V10 – meta – fuzzy avg (V1–V4, V7) 0.996800 0.997829 0.998600
Table 4
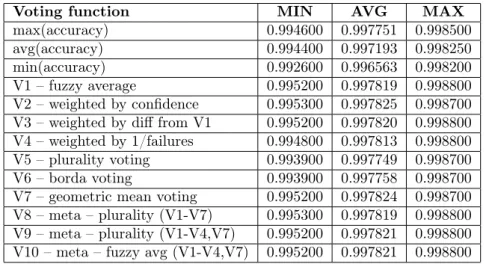
3.2.5. Combined statistics from experiments with different learners We also show combined statistics from the collected results performed by different learners to see a more comprehensive comparison between the voting functions. We collected all the results of our experiments which had all the variables presented in the above tables: individual test results and the results of the V1–V10 voting functions.
Voting function MIN AVG MAX
max(accuracy) 0.994600 0.997751 0.998500
avg(accuracy) 0.994400 0.997193 0.998250
min(accuracy) 0.992600 0.996563 0.998200
V1 – fuzzy average 0.995200 0.997819 0.998800 V2 – weighted by confidence 0.995300 0.997825 0.998700 V3 – weighted by diff from V1 0.995200 0.997820 0.998800 V4 – weighted by 1/failures 0.994800 0.997813 0.998800 V5 – plurality voting 0.993900 0.997749 0.998700 V6 – borda voting 0.993900 0.997758 0.998700 V7 – geometric mean voting 0.995200 0.997824 0.998700 V8 – meta – plurality (V1-V7) 0.995300 0.997819 0.998800 V9 – meta – plurality (V1-V4,V7) 0.995200 0.997821 0.998800 V10 – meta – fuzzy avg (V1-V4,V7) 0.995200 0.997821 0.998800
Table 5
Table 5 shows the combined statistics of about 1 million votings where in each turn 2–40 voters voted using the voting functions V1–V10. This statistics can differ from what we can see from the above tables, since the results of yet more learning sessions are included and the number of conducted tests and the number of learners participated in the tests were not the same in the experiments. The best individual result was 15 fails from 10000 test samples, the worst individual result was 74 failed samples and on average they performed only 28.07 fails as individual learners. The well-known fuzzy voting performed 21.81 fails on average. There were small differences among the voting functions, the best result came from our fuzzy average voting variant (V2) with 21.75 fails from 10000 test samples. V3 and V7 voting functions and V9 and V10 meta voting functions have also outperformed the V1 fuzzy average voting function. The voting performance of V7 had the lowest standard deviation among the voting functions.
4. Conclusion
From the experiments, which were performed to compare the new voting functions with some of the well-known ones, we can conclude that the accuracy of the ex- amined voting functions have a stochastic behavior. We discovered that there is no voting function that is always the winner. The availability of multiple voting functions can, however, lead to better performance, if the best performer function will be chosen for a specific problem set. Some of the proposed voting functions had better accuracy, in all our experiments, compared to the most frequently used well-known fuzzy average and plurality voting functions (V2, V7, V9, V10). This is results are very promising, although further research and analysis must be done to discover their behavior.
References
[1] G. Auda,M. Kamel,H. Raafat:Voting schemes for cooperative neural network classifiers, in: Proceedings of ICNN’95-International Conference on Neural Networks, vol. 3, IEEE, 1995, pp. 1240–1243.
[2] R. Basbous,B. Nagy,T. Tajti:Short Circuit Evaluations in Gödel Type Logic, Proc. of FANCCO 2015: 5th International Conference on Fuzzy and Neuro Computing, Advances in Intelligent Systems and Computing 415 (2015), pp. 119–138,
doi:https://doi.org/10.1007/978-3-319-27212-2_10.
[3] R. Basbous,T. Tajti,B. Nagy:Fast Evaluations in Product Logic: Various Pruning Techniques, in: FUZZ-IEEE 2016 - the 2016 IEEE International Conference on Fuzzy Sys- tems, Vancouver, Canada: IEEE, 2016, pp. 140–147,
doi:https://doi.org/10.1109/FUZZ-IEEE.2016.7737680.
[4] D. Ciresan,U. Meier,J. Schmidhuber:Multi-column deep neural networks for image classification, in: 2012 IEEE conference on computer vision and pattern recognition, IEEE, 2012, pp. 3642–3649.
[5] Y. Freund:Boosting a weak learning algorithm by majority, Information and computation 121.2 (1995), pp. 256–285.
[6] R. Fullér:Fuzzy systems, in: Introduction to Neuro-Fuzzy Systems, Springer, 2000, pp. 1–
131.
[7] S. Haykin:Neural Networks: A Comprehensive Foundation, 2nd, USA: Prentice Hall PTR, 1998,isbn: 0132733501.
[8] G. Kovásznai,C. Biró,B. Erdélyi:Puli–A Problem-Specific OMT solver, in: Proc. 16th International Workshop on Satisfiability Modulo Theories (SMT 2018), 371, 2018.
[9] K. Kowsari,M. Heidarysafa,D. E. Brown,K. J. Meimandi,L. E. Barnes:Rmdl:
Random multimodel deep learning for classification, in: Proceedings of the 2nd International Conference on Information System and Data Mining, 2018, pp. 19–28.
[10] L. I. Kuncheva:A theoretical study on six classifier fusion strategies, IEEE Transactions on pattern analysis and machine intelligence 24.2 (2002), pp. 281–286.
[11] L. Lam, C. Y. Suen: Optimal combinations of pattern classifiers, Pattern Recognition Letters 16.9 (1995), pp. 945–954.
[12] Y. LeCun,L. Bottou,Y. Bengio,P. Haffner:Gradient-based learning applied to doc- ument recognition, Proceedings of the IEEE 86.11 (1998), pp. 2278–2324.
[13] Y. LeCun,C. Cortes,C. J. Burges:The MNIST database of handwritten digits, 1998, 10.34 (1998), p. 14,
url:http://yann.lecun.com/exdb/mnist.
[14] L. Li,Q. Hu,X. Wu,D. Yu:Exploration of classification confidence in ensemble learning, Pattern recognition 47.9 (2014), pp. 3120–3131.
[15] Matuzas77:MNIST classifier with average 0.17% error, github.com (2020),
url:https://github.com/Matuzas77/MNIST-0.17/blob/master/MNIST_final_solution.
ipynb.
[16] B. Nagy,R. Basbous,T. Tajti:Lazy evaluations in Łukasiewicz type fuzzy logic, Fuzzy Sets and Systems 376 (2019), Theme: Computer Science, pp. 127–151,issn: 0165-0114, doi:https://doi.org/10.1016/j.fss.2018.11.014,
url:http://www.sciencedirect.com/science/article/pii/S0165011418309357.
[17] D. Opitz,R. Maclin:Popular ensemble methods: An empirical study, Journal of artificial intelligence research 11 (1999), pp. 169–198.
[18] W. Richards,H. S. Seung,G. Pickard:Neural voting machines, Neural Networks 19.8 (2006), pp. 1161–1167.
[19] S. Russell,P. Norvig:Artificial intelligence: a modern approach(2002).
[20] C. Sammut,G. I. Webb:Encyclopedia of machine learning, Springer Science & Business Media, 2011.
[21] T. Tajti:Fuzzification of training data class membership binary values for neural network algorithms, Annales Mathematicae et Informaticae 52 (2020), to be approved,
doi:https://doi.org/10.33039/ami.2020.10.001.
[22] V. Tresp: Committee machines, Handbook for neural network signal processing (2001), pp. 1–18.
[23] S. Wan,H. Yang:Comparison among Methods of Ensemble Learning, 2013 International Symposium on Biometrics and Security Technologies (2013), pp. 286–290.
[24] L. A. Zadeh,G. J. Klir,B. Yuan:Fuzzy Sets, Fuzzy Logic, and Fuzzy Systems, WORLD SCIENTIFIC, 1996,
doi:https://doi.org/10.1142/2895,
url:https://www.worldscientific.com/doi/abs/10.1142/2895.