Clustering of Metagenomic Data by Combining Different Distance Functions
Isis Bonet
1, Adriana Escobar
1, Andrea Mesa-Múnera
1, Juan Fernando Alzate
21 Universidad EIA, km 2 + 200 Vía al Aeropuerto José María Córdova, Envigado, Antioquia, Colombia
2 Centro Nacional de Secuenciación Genómica-CNSG, Facultad de Medicina, Universidad de Antioquia, Calle 67 Número 53-108, Medellín, Antioquia, Colombia
isis.bonet@eia.edu.co, aescobarvasco@mail.stmarytx.edu, andrea.mesa28@eia.edu.co, jfernando.alzate@udea.edu.co
Abstract: Metagenomics allows researchers to sequence genomes of many microorganisms directly from a natural environment, without the need to isolate them. The results of this type of sequencing are a huge set of DNA fragments of different organisms. These results pose a new computational challenge to identify the groups of DNA sequences that belong to the same organism. Even when there are big databases of known species genomes and some similarity-based supervised algorithms, they only have a very small representation of existing microorganisms and the process to identify a set of short fragments is very time consuming. For all those reasons, the reconstruction and identification process in a set of metagenomics fragments has a binning process, as a preprocess step, in order to join fragments into groups of the same taxonomic levels. In this paper, we propose a clustering algorithm based on k-means iterative and a consensus of clusters using different distance functions. The results achieved by the proposed method are divided using different lengths of sequences and different combinations of distances. The proposed method outperforms the simple and iterative k-means.
Keywords: Metagenomics; consensus clustering; sequences binning; k-means; distances function
1 Introduction
The study of microorganisms gives us a better understanding of global cycles that keep the biosphere in balance. Furthermore, it is important to know their functions in order to develop antimicrobial therapies and provide solutions to the environmental challenges of today.
A few years ago, the study of microorganisms consisted of isolating them in a laboratory under artificial culture conditions. After this step, suitable for a minor fraction of them, microbes can be studied to understand its biochemical and molecular properties. All its genetic information, the genome, was studied sequencing millions of partial fragments of its chromosome using sequencing machines. This short sequenced fragments are generally called reads and require an assembly process, which consists of reconstructing the entire chromosome DNA sequence. The most difficult part of the assembly process is combining the pieces of the puzzle because the fragments vary in size and some can be very similar, albeit they come from different regions in the genome [1].
Previous efforts have focused on methods developed to isolate and cultivate more microorganisms. The problem with this strategy is that only a small percentage of microorganisms can be isolated and cultivated in a laboratory setting [1, 2].
The development of more advanced sequencing technologies has led to the emergence of the metagenomics field, which made the dream of sequencing of samples directly from their natural habitats a reality. This new field has made it possible to study communities of microorganisms from different environments such as land, sea, or even the human gut, without the need to culture them [3-5].
Metagenomics does have limitations and arises new problems: now we can obtain DNA genomic sequences without the need to isolate and cultivate the organisms in a laboratory, but with this method we cannot obtain the entire genome of an organism, we can only obtain DNA fragments [2]. The presence of a variety of organisms increases the difficulty of reconstructing the DNA sequence.
Metagenomics provides scientists with a set of DNA fragments from a variety of organisms that need to be sorted for processing, this process is called binning, and it consists of identifying which groups of DNA fragments belong to a single organism, a single chromosome. In order to improve the results of binning, is common to make a partial assembly to obtain largest fragments called contigs.
Research of the binning process have focused on two methodologies:
composition-based and similarity-based methods [6]. Similarity-based binning is a supervised method, which uses similarity techniques such as alignment, comparing the metagenomic sequences with known genes or proteins in available databases, such as BLAST [7].
Composition-based binning is based on representing the sequences with characteristics that allow them to be separated into taxonomical groups. The most common features used to describe the sequences are GC content, codon usage or oligonucleotide frequencies. Composition-based methods can be implemented as either supervised or unsupervised depending on the use of a reference training set.
NBC [8], TACOA [9] and Phymm [10] are some examples of supervised implementations.
Although supervised methods are more accurate than unsupervised methods, the availability of enough reference training sets are small which leads to the use of unsupervised methods or the combination of both methods.
There have been some research on unsupervised binning methods, which use different clustering algorithms, distance measures and features to characterize the DNA fragments. One of the first reported was TETRA [11], which uses the k-mers feature, with k=4 also known as tetranucleotide frequencies. MetaCAA [12] is another program which also uses k-mers as feature representation. In [13] a Self- Organizing Maps (SOM) method was used to efficiently cluster complex data using the oligonucleotide frequencies calculation, while in [14] growing self- organizing maps was used. In [15] the authors used a fuzzy k-means algorithm based on GC percentage and oligonucleotides frequencies. MetaCluster is another method that employs a k-median algorithm and k-mers to represent the features [16, 17]. Other researchers have used clustering methods based on expectation maximization (EM) [18] [19].
Also, some authors have presented hybrid algorithms that combine the composition-based methodology along with alignment-based methods such as PhymmBL [10] and new versions of MetaCluster [17]. The alignment-based methods are limited when dealing with large-scale sequence data due to their computational complexity and are time-consuming. Taking into account that, we focused on composition-based methodologies.
There are some issues that can arise from a binning process such as: the databases are large and heterogeneous, the number of species in a sample is unknown, fragments vary in size and the number of fragments from each species is different, which results in an unbalanced database. These problems increase the difficulty for unsupervised binning, and require better attributes to represent the DNA fragments to be determined and improved algorithms that can handle large amounts of complex data.
In this paper we propose a clustering method based on k-means++ and the mixture of different distance functions. We use k-mers frequencies as representation of features. The results of our new method were compared with the results from a simple clustering algorithm by comparing the purity of the groups created using each method.
The remainder of this paper is structured as follows. Section 2 describes the data used to create the metagenomic database, the features selected to describe the sequences and the k-means++ clustering method. Section 3 introduces our proposed method based on k-means ++ iterative. Section 4 discusses the results obtained. The paper ends with the conclusions.
2 Methods and Data
The aim of this section is to introduce the data and methods used in our experiments. We describe the composition of our database with regard to size of metagenomic sequences and the diversity of the organisms.
We present the composition-based feature used to represent metagenomic sequences. We also introduce the k-means++ clustering method because it is the base of our proposed algorithm. In addition, we present the distance functions used in the algorithm and the quality measures used to compare the results.
2.1 Data
Assembled genomic sequences at contig level of different organisms including viruses, bacteria and eukaryotes were downloaded from the FTP site of the Sanger institute (ftp://ftp.sanger.ac.uk). In order to have representations of different groups of domains, but also a variety within each group, the database consists of 9 eukaryotes, 2 bacteria and 5 viruses.
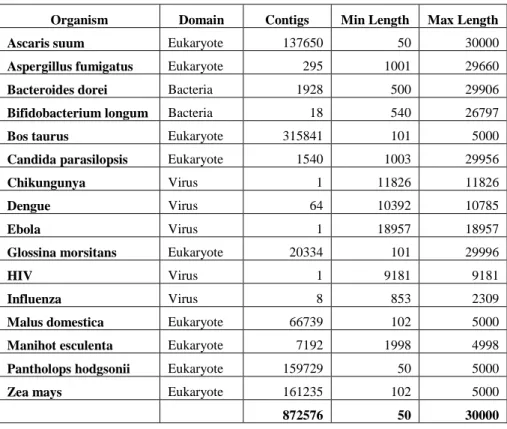
Table 1. Organisms in the database
Organism Domain Contigs Min Length Max Length
Ascaris suum Eukaryote 137650 50 30000
Aspergillus fumigatus Eukaryote 295 1001 29660
Bacteroides dorei Bacteria 1928 500 29906
Bifidobacterium longum Bacteria 18 540 26797
Bos taurus Eukaryote 315841 101 5000
Candida parasilopsis Eukaryote 1540 1003 29956
Chikungunya Virus 1 11826 11826
Dengue Virus 64 10392 10785
Ebola Virus 1 18957 18957
Glossina morsitans Eukaryote 20334 101 29996
HIV Virus 1 9181 9181
Influenza Virus 8 853 2309
Malus domestica Eukaryote 66739 102 5000
Manihot esculenta Eukaryote 7192 1998 4998
Pantholops hodgsonii Eukaryote 159729 50 5000
Zea mays Eukaryote 161235 102 5000
872576 50 30000
Selected viral sequences include HIV, Chikungunya, Ebola, Influenza and Dengue virus genomes. Bacterial sequences come from Bacteroides dorei and Bifidobacterium longum. Eukaryotes include 9 species: Ascaris suum (parasitic nematode), Aspergillus fumigatus (Filamentous fungi), Bos taurus (Cow), Candida parasilopsis (Yeast fungi), Glossina morsitans (Insect), Malus domestica (Apple tree), Manihot esculenta (Cassava), Pantholops hodgsonii (Tibetan antelope) and Zea mays (Corn plant).
Table 1 shows the description of each species included in the database, and provides the number of contigs for each species and the range of lengths for each (minimum and maximum). The table shows how heterogeneous the database is.
The variation in the number of contigs for each organism as well as the size of the contigs is very large. For example, Ascaris suum is an eukaryote has 137650 contigs that range between 50 and 30000 bases, while HIV only has a single contig with 9181 bases.
2.2 Features
The database consists of 872576 contigs in total which vary in size between 50 and 30000 nucleotides bases, we used a composition-based feature to represent the DNA fragments.
Taking into account some previous results [20], we select k-mer (k=4) as the features to represent the contigs.
A tetranucleotide is a 4-combination of the nucleotides that means, there are 256 possible tetranucleotides. For each tetranucleotide t a 4-mer feature define follows, resulting in 256 features.
4-mert (contig i): number of each tetranucleotide (t) and normalized with the total of tetranucleotides in the contig.
This feature was represented as the percent of each tetranucleotide in the fragment, because it was normalized with the total of tetranucleotides in the contig.
2.3 Clustering Method
K-means is one of the most popular clustering methods [21]. K-means++ is a variant of k-means, which improves the selection of centroids for the clusters [22].
This algorithm finds a set of k centroids based on a weighted probability distribution where a point x is chosen with a probability proportional to a distance function. This selection ensures that the centroids are distant from one another.
After the centroids are chosen, the algorithm proceeds as the standard k-means clustering.
We test different clustering algorithms as SOM, EM and k-means, but only the k- means++ method results are included because they provided the best results.
Some of the most used distance functions in this problem are Euclidean (1), Cosine (2) and Jaccard distance (3).
n
i
i
i y
x Y
X Euclidean
1
) 2
,
( (1)
n
i i n
i i n
i
i i
y x
y x Y
X Cosine
1 2 1
2
1 1
) ,
( (2)
n
i
i i n
i i n
i i
n
i
i i
y x y
x
y x Y
X Jaccard
1 1
2 1
2 1
2
) ,
( (3)
where X and Y are the instance to compare, with dimension n (features number), and xi and yi denote the i-th feature of X and Y respectively.
To assess the final quality of clustering methods we use a labeled database, intra and inter-cluster, and purity measure (4) [20].
j ij
j n
C n
Purity max
(4)
where nj is the number of organisms in cluster j (Cj) and nij is the number of organisms of class i in cluster j.
For the implementation of the clustering methods, we used Weka 3.9 [23], which is a free machine learning package that has implemented k-means++. Furthermore, it has the advantage that it is easy to add a new clustering method.
3 Clustering Method based on Combine Different Distances
We have proposed a clustering method based on iterative clustering [20] with k- mean++ as the base method. The main idea behind this proposal is the usage of multiple distances, in order to make different divisions of space input.
The proposal is a general clustering method, which is easily adaptable to any clustering problem. The principal parameters to adjust as in k-means method are the value of k and the distance function. Now we need to select not only one distance function, but two or more. We can suggest a distance function, because the best distance functions may be different depending on the problem.
Nevertheless, for metagenomics we can make a suggestion based on the results obtained in that experiment.
We use Euclidean (1), Cosine (2) and Jaccard (3) distance in order to test our method in the metagenomic database.
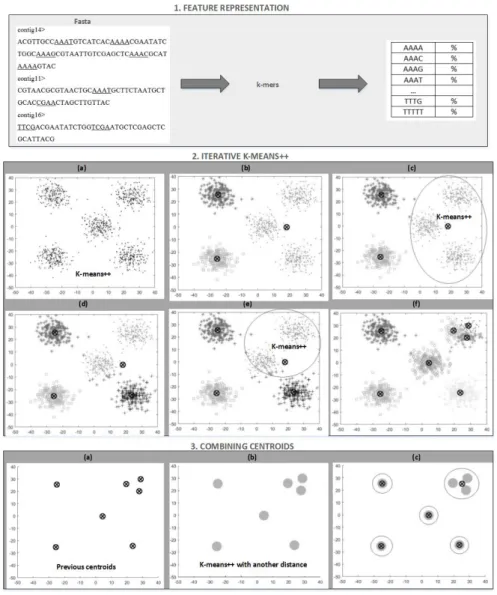
Figure 1. Steps of Proposed Clustering Method
The distance functions used to compare the length of the contigs was the Euclidean and Cosine. The second step of the method joins some clusters using the Jaccard distance.
Figure 1 represents the process of our proposed clustering method, which is based on the following steps:
Step 1: The fasta file containing metagenomic sequence data is converted into a composition-based file using k-mer features. In that case we use an .arff file representation with Weka.
To clarify the algorithm, the following steps are depicted in the following example.
Step 2: The given sample of data points (figure 2a), are intentionally distributed in five clearly separable groups. We expect that a clustering algorithm selects the centroids in such a way that each one are in different visible groups, but we don’t know the number of clusters that will be created. For example using k=3 you can obtain the result displayed in 2b, here it’s obvious that the cluster on the far right is not compact, and it can be divided again. This is where the iterative method begins by applying k-means++ while there is at least one non-compact cluster.
To measure the compactness of the clusters an internal evaluation based on the intra-cluster distance is used. The method seeks clusters with high intra-cluster distance and uses data that belongs to them as the input for the next clustering. In the example the cluster on the right side of figure 2c was selected and the k- means++ was applied again with k=2, which resulted in the partition displayed in 2d. It is clear that the cluster at top right of figure 2e is still non-compact, so the k- means++ is applied again, now with k=4. Figure 2f represents the final partition results.
The threshold used to evaluate the compactness of clusters is based on the intra- cluster distance and the standard deviation as shown in equation 5.
) (
)
( 1
1 i
n i i n
i intra clusterdistance Std intra clusterdistance Mean
Threshold (5)
where n is the number of clusters, and the intra-cluster distance for a given cluster is calculated as the average of distances between each instance that are contained in the cluster and the centroid of the cluster.
The application of iterative clustering methods generally provides more clusters than necessary, but this is the intention of this step. We want to obtain an over- estimated number of clusters. Indeed, the intention is to define double the number of clusters provided by the expert, in an attempt to define clusters with members of a single species, even when the species are divided in different groups.
Step 3: After the application of the iterative clustering method, we have a large number of clusters, some of which can be close to each other. The final step is to decrease the number of clusters. The new number of clusters is approximated
using an inter-cluster measure. Once again, k-means++ is used, but this time with the final centroids obtained in the previous step as the input (figure 3a and 3b).
Additionally, in order to partition the data space in a different way, a different distance measure was used (we suggest Jaccard distance). The results of this final clustering are shown in figure 3c, and the total number of clusters is smaller.
The previous example is an extremely simple case which was only intended to clarify the application of our proposed method. In metagenomics applications a greater number of clusters will be created than the real number of groups present in the sample, but we manage to decrease the number of clusters generated keeping the pure, and belonging to a single species by using our method. This was corroborated by using the purity measure to compare the results obtained.
It is important to remember that high purity is easy to achieve when the number of clusters is large [20]. This method provided positive results generating less clusters that are equally pure.
4 Results and Discussion
A metagenomic database built from 16 different organisms is used to evaluate the method. K-mers with k=4 are some of the characteristics selected to describe the metagenomic sequences. Euclidean and Cosine distances were used for the iterative k-means++ algorithms, while Jaccard distance was used in the last step of the algorithm to calculate the intra-cluster distances. Multiple tests to train the clustering method were performed, beginning with k of 15 and increasing until it was equal to 40. K was increased in the second clustering process by a factor of 2 to 10 times.
With the objective of comparing species in the same domain, we divide the database into three datasets: Bacteria, Virus and Eukaryotes. We also test the algorithm with the complete database.
The results obtained with the species divided in domain were very good for all the domains. Viruses, which are normally the most difficult to separate from the rest of organisms obtained the best results when they were analyzed alone.
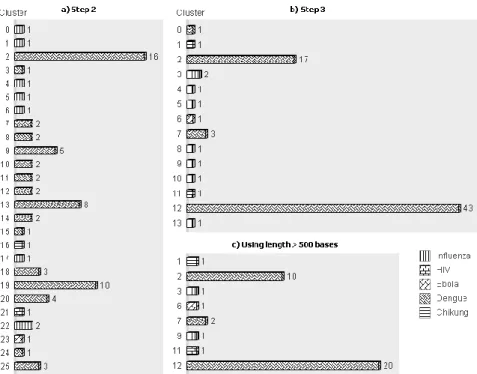
Figure 2 illustrates the best results obtained using the proposed method with the dataset of Virus. The results shown on the left side of the drawing are based on an iterative method with cosine distance of two phases of k-means++ with k=10 for first phase and k=25 for second phase resulting 26 clusters. The last step of the method applying k-means++ with Jaccard distance and k=14 is shown at the top right of figure.
Figure 2. Results using proposed method with dataset of Virus.
Even when we obtain 14 clusters for 5 species, these clusters are 100% pure.
Analyzing the results of iterative clustering described in step 2 (left side) it can be seen that Chikungunya, Ebola and HIV, which have one contig, could be separated in one cluster of each one. On the other hand, Dengue and Influenza are divided into 16 and 7 clusters respectively. The last clustering in the centroids corresponding to step 3 (top right), demonstrated that clusters of Chikungunya, Ebola and HIV remain the same and Dengue and Influenza are reduce to 4 (clusters 0, 2, 7 and 12) and 7 (clusters 3, 4, 5, 8, 9, 10 and 13) clusters.
The best results for Bacteria were obtained with k1=10 and k2=20. The second phase was using k=4 obtaining 97.5% of purity. Even when we have only two bacteria, Bifidobacterium longum was difficult to separate. Viruses have more number of species than the Bacteria, but Bacteria have more contigs and are bigger than Viruses. Bacteria have 1946 contigs ranging between 500 and 29906 bases, whereas Viruses present only 75 contigs in a range between 92 and 8748.
On the other hand Eukaryote which are the biggest in both number of species and contigs, achieved 99.7% of purity. The results were obtained with k1=25 and k2=30 in iterative process and k=4 for the last part. Candida parasilopsis and Aspergillus fumigatus are scatted across many clusters and could not be separated from the rest.
Figure 3. Results of proposed clustering methods with all domain of species, divided according the length of contigs.
Figure 3 shows the results of the whole database, now divided according to length of contigs. Left side of drawing illustrates the outcomes of proposed clustering method with length of contigs inferior to 10000 and using k1=15, k2=2500 for the iterative process resulting 2483 clusters. Right side of figure shows results also about the performance of iterative phase, but with contigs length greater than or equal to 10000 and using k1=15 and k2=230. And this time 232 clusters were obtained.
Although the organisms are very scattered we obtain a high purity and we can separate the virus in independent clusters. Using lengths larger than 10000, the algorithm achieves 100% of purity for all clusters, and 98.11% when the lengths are shorter than 10000.
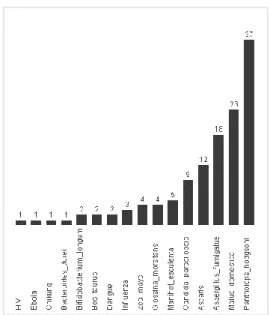
In order to reduce the number of clusters we join the results obtained before having now 2715 centroids and apply the last phase of the algorithm. The number of clusters was reduced from 2715 to 125 yielding a 99% of purity. Figure 4 displays the number of clusters by organism which oscillate into 1 to 37. Even when at least a cluster was obtained for each organism, three species cannot be totally separated from the rest: Bifidobacterium longum, Influenza and Aspergillus fumigatus. Some of their contigs are distributed in different clusters with other organisms.
Fig. 4. Final result by the application of step 3 with k=125
Summarizing, the proposed method based on two process of clustering one iterative and another with the centroids resulting for the first improves the results of binning in metagenomics. The key of the method is to use different distances for iterative clustering and centroids clustering. The combination of different distances can generate a significant change in the separation of the space. Here we use Cosine and Jaccard distances in the first and in the last clustering process respectively.
Additionally, it is important to take into account the lengths of the sequences. In order to minimize error we can divide the problem and create models that are focused on the short sequences and models that are based on the large sequences.
Conclusions
In this paper we proposed a clustering method based on k-means++ with two training phases. The first phase is an iterative clustering process, training a consecutive set of k-means++ with different inputs, decreasing in each one depending on the compact clusters determined in the previous run of clustering.
The second phase is another clustering but using the set of centroids obtained from the first phase. Each phase is trained with a different distance function.
The proposed method is applied to a metagenomic database that composed of 16 different organisms from three different domains: Bacteria, Virus and Eukaryote.
We obtained the best result using Cosine and Jaccard distance for the first and second phase respectively. The results obtained, based on the purity of clusters, outperforms results obtained with a simple k-means++ and also compared with an iterative k-means++.
We can conclude that longer DNA fragments can improve performance in a binning process. Although, the number of clusters is higher than the number of organisms, the proposed method provided pure clusters for organisms, achieving 100% of purity in all clusters when the lengths of contigs is greater than 10000, and 99% for all possible lengths.
The results shown have only been applied to one database, but the method is a promising development for clustering larger sequences or as a prior step in the taxonomy assigned process.
References
[1] R. S. Lasken and J. S. McLean, "Recent advances in genomic DNA sequencing of microbial species from single cells," Nat Rev Genet, Progress vol. 15, no. 9, pp. 577-584, 2014.
[2] N. R. Council, The New Science of Metagenomics: Revealing the Secrets of Our Microbial Planet. The National Academies Press, 2007.
[3] L. Nanni and A. Lumini, "MppS: An ensemble of support vector machine based on multiple physicochemical properties of amino acids," (in English), Neurocomputing, Article vol. 69, no. 13-15, pp. 1688-1690, Aug 2006.
[4] A. Oulas et al., "Metagenomics: Tools and Insights for Analyzing Next- Generation Sequencing Data Derived from Biodiversity Studies," in Bioinform Biol Insights, vol. 9, 2015, pp. 75-88.
[5] C.-K. Chan, A. Hsu, S. Halgamuge, and S.-L. Tang, "Binning sequences using very sparse labels within a metagenome," BMC Bioinformatics, vol.
9, no. 1, p. 215, 2008.
[6] A. Kislyuk, S. Bhatnagar, J. Dushoff, and J. Weitz, "Unsupervised statistical clustering of environmental shotgun sequences," BMC Bioinformatics, vol. 10, no. 1, p. 316, 2009.
[7] C. Camacho et al., "BLAST+: architecture and applications," BMC Bioinformatics, vol. 10, no. 1, p. 421, 2009.
[8] G. L. Rosen, E. Reichenberger, and A. Rosenfeld, "NBC: The Naïve Bayes Classification Tool Webserver for Taxonomic Classification of Metagenomic Reads," Bioinformatics, November 8, 2010 2010.
[9] N. N. Diaz, L. Krause, A. Goesmann, K. Niehaus, and T. W. Nattkemper,
"TACOA – Taxonomic classification of environmental genomic fragments using a kernelized nearest neighbor approach," BMC Bioinformatics, vol.
10, pp. 56-56, 2009.
[10] A. Brady and S. L. Salzberg, "Phymm and PhymmBL: Metagenomic Phylogenetic Classification with Interpolated Markov Models," Nature methods, vol. 6, no. 9, pp. 673-676, 2009.
[11] H. Teeling, J. Waldmann, T. Lombardot, M. Bauer, and F. Glockner,
"TETRA: a web-service and a stand-alone program for the analysis and
comparison of tetranucleotide usage patterns in DNA sequences," BMC Bioinformatics, vol. 5, no. 1, p. 163, 2004.
[12] R. M. Reddy, M. H. Mohammed, and S. S. Mande, "MetaCAA: A clustering-aided methodology for efficient assembly of metagenomic datasets," Genomics, vol. 103, no. 2–3, pp. 161-168, 2014.
[13] T. Abe, S. Kanaya, M. Kinouchi, Y. Ichiba, T. Kozuki, and T. Ikemura,
"Informatics for Unveiling Hidden Genome Signatures," Genome Research, vol. 13, no. 4, pp. 693-702, April 1, 2003 2003.
[14] H. Zouari, L. Heutte, and Y. Lecourtier, "Controlling the diversity in classifier ensembles through a measure of agreement," (in English), Pattern Recognition, Article vol. 38, no. 11, pp. 2195-2199, Nov 2005.
[15] K. Woods, W. P. Kegelmeyer, and K. Bowyer, "Combination of multiple classifiers using local accuracy estimates," (in English), Ieee Transactions on Pattern Analysis and Machine Intelligence, Article vol. 19, no. 4, pp.
405-410, Apr 1997.
[16] H. C. Leung et al., "A robust and accurate binning algorithm for metagenomic sequences with arbitrary species abundance ratio," (in eng), Bioinformatics, vol. 27, no. 11, pp. 1489-95, Jun 1 2011.
[17] Y. Wang, H. Leung, S. Yiu, and F. Chin, "MetaCluster-TA: taxonomic annotation for metagenomic data based on assembly-assisted binning," (in English), BMC Genomics, vol. 15, no. 1, pp. 1-9, 2014/01/24, Art. no. S12 [18] I. Partalas, G. Tsoumakas, I. Katakis, and I. Vlahavas, "Ensemble pruning
using reinforcement learning," in Advances in Artificial Intelligence, Proceedings, vol. 3955(Lecture Notes in Computer Science, Berlin:
Springer-Verlag Berlin, 2006, pp. 301-310.
[19] L. Nanni and A. Lumini, "FuzzyBagging: A novel ensemble of classifiers,"
Pattern Recognition, vol. 39, no. 3, pp. 488-490, Mar 2006.
[20] I. Bonet, W. Montoya, A. Mesa-Múnera, and J. Alzate, "Iterative Clustering Method for Metagenomic Sequences," in Mining Intelligence and Knowledge Exploration, vol. 8891, R. Prasath, P. O’Reilly, and T.
Kathirvalavakumar, Eds. (Lecture Notes in Computer Science: Springer International Publishing, 2014, pp. 145-154.
[21] J. MacQueen, "Some methods for classification and analysis of multivariate observations," presented at the Proceedings of the Fifth Berkeley Symposium on Mathematical Statistics and Probability, Volume 1:
Statistics, Berkeley, Calif., 1967, 1967. Available:
http://projecteuclid.org/euclid.bsmsp/1200512992
[22] D. Arthur and S. Vassilvitskii, "K-Means ++: The Advantages of Careful Seeding," in 8th Annual ACM-SIAM Symposium on Discrete Algorithms, New Orleans, 2007, pp. 1027-1035.
[23] I. Witten and E. Frank, Data Mining: Practical Machine Learning Tools and Techniques, 2nd ed. San Francisco: Morgan Kaufmann, 2005, p. 525