Goodness of t to the family of distribution.
Abstract of Ph.D. Theses
By Éva Osztényiné Krauczi Supervisor:
Professor Sándor Csörg®
Consultants:
Professor Gyula Pap and Professor Gábor Sz¶cs
Doctoral School in Mathematics and Computer Science Bolyai Institute, University of Szeged
Szeged, 2016
1 Introduction
The thesis is devoted to the study of goodness of t in the case of various dis- tributions. Let X1, . . . , Xn be a sample (independent identically distriduted random variables) from an unknown distribution with distribution functionF. The simple hy- pothesis is
H0 :F =F0,
whereF0 is a given distribution function, and the composite hypothesis is H0 :F ∈ F,
whereF denotes the family of probability distributions.
In Chapter 2 we collect the historical preliminaries using the comprehensive sum- mary provided by del Barrio, Cuesta-Albertos and Matrán [9]. For the overview we recall the rst tests which are suitable for goodness of t to a xed distribution paying special attention to the development of the asymptotic theory of goodness of t tests.
The goodness of t to the family of distributions and their asymptotic theories are considered focusing to two classes of this procedure: tests of t based on the empirical distribution function (EDF), and the regression and correlation tests of t.
In Chapter 3 we suggest a goodness of t procedure to the uniform distribution on [0,1] and to the uniform family. The idea is the following: consider a random uniform sample on [0,1], let the simple size be n. Moreover, there is a given deterministic distance level dn ∈ (0,1) for all n. We push through this distance level on [0,1] and we observe how many nonempty disjoint classes breaks up the elements of the order statistics into. The elements of the order statistics belong to the same class, where the distance between any two neighbouring elements is not greater than dn. The classes belong to a given sample at a given distance level is called the number of clusters.
S. Csörg® and Wu showed that the number of clusters is asymptotically normal for three dierent distance level sequences. We extend the results of S. Csörg® and Wu [6]
to multivariate limit theorems for uniform distributions on dierent intervals. These theorems are applied for testing uniformity on a known and an unknown interval. We prove that the joint cluster count vector is asymptotically normal in all cases. Thus, these tests dene asymptoticallyχ2 tests for a uniform distribution or for the uniform family. We simulated powers of the new tests as well.
In Chapter 4 we investigate a goodness of t test to the normal family, based on theL2-Wasserstein distance, proposed by del Barrio, Cuesta-Albertos, Matrán and Rodrí- guez-Rodríguez [10]. They obtained the location- and scale-free test statistic for the null hypothesis H0 :F ∈N, whereN denotes the normal family. A simulation study was performed to evaluate the power of the BCMR-test and to make comparisons with other tests of normality.
In Chapter 5 we present the weighted version of the quantile correlation test for goodness of t to the logistic family, introduced by del Barrio, Cuesta-Albertos, Matrán and Rodríguez-Rodríguez [10], and del Barrio, Cuesta-Albertos and Matrán [9]. The use of weight functions in the test statistics were suggested independently from each
other by de Wet in [7] and [8] and by S. Csörg® [4] and [5]. We prove the results of S.
Csörg® [5] for location and scale logistic family with the weight function for location family suggested by de Wet. Del Barrio, Cuesta-Albertos and Matrán [9] obtained the asymptotic distribution as the KarhunenLoève expansion of the weighted Brownian- bridge. With the same technique we determine the innite series representation of our limiting distribution. Similarly to the previous results a simulation study was performed to evaluate the power of the tests.
The author has written three papers on the subject of the thesis. Joint cluster counts from uniform distribution is published in Krauczi [16]. Krauczi [14] contains the study of the quantile correlation test for normality. Finally, the results of the weighted quantile correlation test for the logistic family are from Balogh and Krauczi [2].
All convergence relations are understood throughout the thesis asn→ ∞, and let
→D denote convergence in distribution and let →P denote convergence in probability.
2 Historical preliminaries
As an overview we recall the rst tests which are suitable for goodness of t to a xed distribution paying special attention to the development of the asymptotic theory of goodness of t tests. The rst goodness of t procedure is theχ2-test proposed by Pearson [17]. Under the null-hypothesis, this test has asymptotic distribution χ2. The EDF-tests and the recovery of their asymptotic distribution have received special attention. These tests use dierent functional distances to measure the discrepancy between the hypothesized distribution function and the empirical distribution function.
A section is devoted to the problem of the goodness of t to the family of distributions and their asymptotic theories. The rst studies are occurred in the most interesting case, for the Gaussian family. Then we adapt all the procedures considered in the rst subsection for the case of the parametric family. The simple idea is choosing an adequate estimator of the parameter and replacing the xed distribution by the distribution with the estimated parameter. Finally we recall the regression and correlation tests, the very popular WilkShapiro-test of normality [19] and it's further modications. The asymptotic result are also considered.
3 Goodness of t to the uniform family
Introduction and preliminary results
We suggest a goodness of t procedure to the uniform distribution on [0,1] and to the uniform family. The idea is the following: let U1, . . . , Un be a random uniform sample (independent uniformly distributed on[0,1]random variables). Moreover, there is a given deterministic distance level dn ∈ (0,1) for all n. We push through this distance level on [0,1]and we observe how many nonempty disjoint classes breaks up the elements of the order statistics into. The elements of the order statistics belong to the same class, where the distance between any two neighbouring elements is not
greater thandn. The classes belong to a given sample at a given distance level is called the number of clusters and denoted Kn(dn).
We recall that S. Csörg® and Wu [6] showed that the number of clusters is asymp- totically normal for three dierent distance level sequences.
Theorem 1 (Csörg® and Wu [6]) (i) If ndn→0 and n2dn→ ∞, then
∆n = sup
x∈R
P Kn−ne−ndn
pne−ndn(1−e−ndn) ≤x
!
−Φ(x)
=O r
(ndn+εn) log 1
ndn +log(n√ dn) n√
dn
, where εn=p
(4 logn)/n, and so (Kn−ne−ndn)/(n√
dn)−→ ND (0,1).
(ii) If 0<lim infnndn≤lim supnndn<∞, then sup
x∈R
P Kn−ne−ndn
pne−2ndn(endn−1−n2d2n) ≤x
!
−Φ(x)
=O log3/4n n1/4
! , and hence ifndn→c∈(0,∞), then(Kn−ne−ndn)/√
n−→ ND (0, σ), whereσ =e−2c[ec− 1−c2].
(iii) If ndn→ ∞ and ne−ndn→ ∞, then
∆n=O (ndn)3/2
√
endn +p
εnndnlog(ne−ndn) +
rendn
n log(ne−ndn)
! , where ∆n is as in the case (i) and εn =p
(4 logn)/n again, and so Kn−ne−ndn
√ ne−ndn
−→ ND (0,1).
We extend the results of S. Csörg® and Wu [6] to multivariate limit theorems for uniform distributions on dierent intervals. These theorems are applied for testing uniformity on a known and an unknown intervals.
Theoretical results
We investigate the joint behaviour ofKn's for sequences of dierent distance levels.
Set J ≥ 1 and let dn1 ≤ dn2 ≤ · · · ≤ dnJ, n ∈ N, be distance levels. If the sample comes from the uniform distribution on the unit interval [0,1], then Knj(dnj) denote the numbers of clusters corresponding to the distance levelsdnj for allnandj. Consider the random vector
Kn= 1
√n
Kn1(dn1)−mn1
σn1 , ...,KnJ(dnJ)−mnJ σnJ
>
, n ∈N, (1)
with the sequencesmnj =ne−ndnj and
σnj2 =e−2ndnj(endnj −1−n2d2nj), j = 1, . . . , J.
Theorem 2 Let dn1 ≤dn2 ≤ · · · ≤dnJ, n∈N, be distance levels satisfying one of the following conditions:
(T1) ndnj →0, n2dnj → ∞;
(T2) 0<lim infnndnj ≤lim supnndnj <∞; (T3) ndnj → ∞, ne−ndnj → ∞.
Moreover, assuming additionally sij := lim
n→∞
e−ndni−ndnj(endni −1−n2dnidnj)
σniσnj ∈R, 1≤i < j ≤J, (2) and let sjj := 1 and sji :=sij. Then
Kn−→ ND J(0,Σ) (3) with the covariance matrix Σ = (sij)i,j=1,...,n.
One of the corollary of this theorem is that the limiting distribution can be ob- tained with the block diagonal matrixΣ.
Corollary 3 Suppose J ≥ 2, and 0 ≤ J1 ≤ J2 ≤ J are such, that distance levels dnj satisfy condition (T1) for j ≤ J1 and condition (T3) for j > J2. Moreover, assume additionally the following conditions:
(i) For i < j ≤J1 it holds sij := limn→∞p
dni/dnj ∈R.
(ii) For J1 < j ≤ J2 cj := limn→∞ndnj ∈ R exists. Then for J1 < i < j ≤ J2 it holds
sij := (eci−1−cicj) q
(eci −1−c2i)(ecj −1−c2j) .
(iii) For J2 < i < j sij := limn→∞e−n(dnj−dni)/2 ∈R also exists.
And let sji :=sij and sjj := 1. Then (3) holds with the block diagonal matrix Σ =
Σ1 0 0 0 Σ2 0 0 0 Σ3
,
where the dimensions of blocks Σ1, Σ2 and Σ3 are the respectively J1×J1, (J2−J1)× (J2−J1)and (J−J2)×(J−J2). The components of blocks are dened withsij's above.
We apply Corollary 3 to typical sequences suggested by S. Csörg® and Wu in [6], hereby we choose the parameters to obtain a diagonal covariance matrix. S. Csörg® and Wu give well-behaving examples called typical sequences. A typical sequence(dn)n=1,2...
for the case (T1) isdn=n−α for someα∈(1,2). In particular, we take dnj =n−αj for j ≤ J1, with α1 > α2 >· · · > αJ1 resulting in sij = 0 for i < j ≤ J1. In the case (T2) the existence of the limit c := limn→∞ndn ∈ R gives the typical sequence (dn)n=1,2.... Here let 0 ≤ J2 −J1 ≤ 2 which means that Σ2 is at most a 2×2 matrix and take cJ2 = (ecJ1+1 −1)/cJ1+1 in the case J2 −J1 = 2. A typical sequence (dn)n=1,2... for the case (T3) is dn = β(logn)/n for some β ∈ (0,1). So we take dnj = βj(logn)/n for j > J2, with βi < βj for J2 < i < j resulting again sij = 0. Under these special choices Corollary 3 reduces to the following one.
Corollary 4
Kn−→ ND J(0, EJ), where EJ denotes the unit matrix with dimension J.
If the sample comes from the uniform distribution on the known interval [a, b]
with a, b ∈ R, a < b, then we prove with applying a linear transformation of the interval[a, b] onto the interval [0,1], that the transformed cluster count vector is also asymptotically normal distributed under the correctly transformed assumptions.
LetV1, V2, . . . , Vn be independent random variables, each uniformly distributed on the interval[a, b]with a, b∈R, a < b, known. SetJ ≥1and letdn1 ≤dn2 ≤ · · · ≤dnJ be distance levels. Let Knja,b(dnj) be numbers of clusters corresponding to the distance levelsdnj, j = 1, . . . , J. Set
ma,bnj =ne−ndnjb−a, σnja,b= v u u
te−2ndnjb−a endnjb−a −1−
ndnj b−a
2! , and
Ka,bn = 1
√n
Kn1a,b(dn1)−ma,bn1
σn1a,b , . . . ,KnJa,b(dnJ)−ma,bnJ σa,bnJ
!>
.
Theorem 5 Suppose each dnj satises one of the conditions (T1), (T2) or (T3'), where
(T3') ndnj → ∞, ne−ndnjb−a → ∞. In addition,sij's exist for which
e−ndnib−a−ndnjb−a
endnib−a −1− ndni b−a
ndnj b−a
/σa,bniσnja,b→sij, 1≤i < j ≤J, (4) and let sii:= 1 and sji :=sij.Then it holds
Ka,bn −→ ND J(0,Σ) (5) with the covariance matrix Σ = (sij)i,j=1,...,J.
Finally, the sample comes from the uniform distribution on the unknown interval.
LetV1, . . . , Vn be independent, uniformly distributed random variables on the interval [a, b] with a < b being unknown and let V1,n, . . . , Vn,n be the ordered sample. We investigated a counterpart of Theorems 2 and 5 when the endpoints of the interval are estimated by ˆan = V1,n and ˆbn = Vn,n. In an analogue to the previous notations, for given J ≥ 1 and distance levels dn1 < · · · < dnJ denote Kˆnj(dnj) numbers of clusters corresponding to the distance levelsdnj,j = 1, . . . , J, set
ˆ
mnj =ne−
ndnj
ˆbn−ˆan, σˆnj = v u u te−2
ndnj ˆbn−ˆan e
ndnj
ˆbn−ˆan −1−
ndnj ˆbn−aˆn
2!
and
Kbn = 1
√n
Kˆn1(dn1)−mˆn1 ˆ
σn1 , . . . ,
KˆnJ(dnJ)−mˆnJ ˆ
σnJ
!>
.
Theorem 6 The assumptions of Theorem 5 are satised, and consider the covariance matrix Σ from there. Then
Kbn
−→ ND J(0,Σ). (6)
Statistical results
It follows from theoretical results that we obtain asymptotically χ2 test for good- ness of t under the simple and the composite null hypotheses.
First consider the simple null hypothesis asserting that a sample X1, . . . , Xn has the uniform distribution on[0,1]. GivenJ ≥1and distance levelsdn1 ≤ · · · ≤dnJ, n∈ N,each satisfying one of the conditions (T1), (T2) or (T3) such that the condition (2) holds. The covariance matrix Σas in Theorem 2 is nonsingular. Let Kn be the vector given by (1). Then from (3) it follows that under the simple null hypothesis
Cn:=K>nΣ−1Kn
−→D χ2J,
whereχ2J is a random variable with the chi-square distribution withJ degrees of free- dom. So, Cn denes a test for uniformity on [0,1], called here the cluster test and denoted byCn.
Now, consider the composite null hypothesis asserting that a sample comes from the family of all uniform distributions on R. Distance levels dn1 ≤ · · · ≤ dnJ, n ∈ N, each satisfy the conditions of Theorem 6, then under the simple null hypothesis we obtain
Cbn:=Kb>nΣ−1Kbn−→D χ2J.
Accordingly it may seemed, that the composite hypothesis may be tested like the previous paragraph. The problem is that as we don't know the explicit value a and b, so the component of the covariance matrix Σ can't be determined, hence the test statisticsCbncan't be counted based on a given sample. Therefore we test the composite null hypothesis with another procedure. Here, we propose a possible solution based on the random transformation of the sampleV1, . . . , Vn coming from an unknown interval into the unit interval as follows:
V2,n−V1,n
Vn,n−V1,n, . . . ,Vn−1,n−V1,n Vn,n−V1,n
.
Here K˜n−2,j(dnj) denote the numbers of clusters corresponding to the distance levels dnj for the randomly transformed sample, j = 1, . . . , J, and let
K˜n−2 := 1
√n
K˜n−2,1(dn1)−mn−2,1
σn−2,1
, . . . ,
K˜n−2,J(dnJ)−mn−2,J
σn−2,J
!>
be a vector of normalized numbers of clusters of the randomly transformed sample.
In addition letΣ˜ be the covariance matrix computed using the randomly transformed sample. Then
Cnmod := ˜K>n−2Σ˜−1K˜n−2
−→D χ2J.
So,Cnmod denes a test for uniformity, called here the modied cluster test and denoted by Cnmod. These tests dene asymptotically χ2 tests for a uniform distribution or for the uniform family. This means that asymptotic critical values of these tests are given by quantiles of the chi-square distribution withJ degrees of freedom.
We simulated powers of the new tests against some continuous alternative dis- tributions on [0,1] and we compared these tests with the data driven smooth test introduced in Inglot and Ledwina [12]. The conclusion is that the cluster tests perform less well than other procedures unless some highly oscillating alternatives.
4 Goodness of t to the normal family
Introduction and preliminary results
We perform a simulation study of the goodness of t test to the normal family based on theL2-Wasserstein distance, proposed by del Barrio, Cuesta-Albertos, Matrán and Rodríguez-Rodríguez [10]. They obtained the location- and scale-free test statistic for the null hypothesis H0 : F ∈ N, where N denotes the normal family. This testing procedure belongs to the class of minimum distance tests (using the distance of quantile functions); on the other hand it is asymptotically equivalent with a correlation test. The name of this test derives from these two dierent approaches: the quantile correlation test.
To describe their proposal, let P2(R)be the set of probabilities onR with a nite second moment. For probabilities P1 and P2 in P2(R) the L2-Wasserstein distance betweenP1 and P2 is
W(P1, P2) = inf
[E(X1−X2)2]1/2,L(X1) =P1,L(X2) = P2 ,
where L(X) denotes the probability distribution of the random variable X. It can be explicitly obtained in terms of quantile functions:
W(P1, P2) = Z 1
0
(F1−1(t)−F2−1(t))2dt 1/2
,
whereF1−1 and F2−1 are quantile function associated with the probabilitiesP1 and P2. If P is a probability distribution in P2(R) with distribution functionF, mean µ0 and standard deviation σ0, then L2-Wasserstein distance-square between F and the class of all normal lawsN is
W2(P,N) := inf{W2(P, Nσµ), Nσµ∈N}=σ20− Z 1
0
F−1(t)Φ−1(t)dt 2
,
where Φ−1 is the standard normal quantile function. The ratio W2(P,N)/σ02 is not aected by location or scale changes ofF. Hence, it can be considered as a measure of dissimilarity betweenF and N.
Given a random sampleX1, . . . , Xn fromF, now the empirical version of the ratio W(P,N)/σ0 may be obtained. Then the location- and scale-free BCMR-test statistic for the null hypothesis H0 :F ∈N is
Tn:= W2(Fn,N)
Sn2 = 1− hR1
0 Qn(t)Φ−1(t)dti2
Sn2 = 1−
hPn
k=1Xk,nR kn
k−1 n
Φ−1(t) dti2
Sn2 ,
whereSn2 denotes the empirical variance.
Del Barrio, Cuesta-Albertos, Matrán and Rodríguez-Rodríguez [10] investigated the asymptotic distribution of the test statistic under the null-hypothesis. They man- aged to produce the limit distribution in two dierent forms. The rst form is func- tionals of the Brownian bridge, the second is a series of random variables. Letϕdenote the standard normal density function andB denote the Brownian bridge, and let
an = 1 n
Z n+1n
1 n+1
t(1−t) [ϕ(Φ−1(t))]2dt.
Theorem 7 (del Barrio, Cuesta-Albertos, Matrán and Rodríguez-Rodríguez[10]) If F ∈N, then
n(Tn−an)−→D Z 1
0
B2(t)−E(B2(t)) ϕ2(Φ−1(t)) dt−
Z 1 0
B(t) ϕ2(Φ−1(t))dt
2
− Z 1
0
B(t)Φ−1(t) ϕ2(Φ−1(t))dt
2
=D − 3 2+
∞
X
j=3
Zj2−1 j ,
where (Zj)∞j=3 is a sequence of independent standard normal random variables.
Simulation results
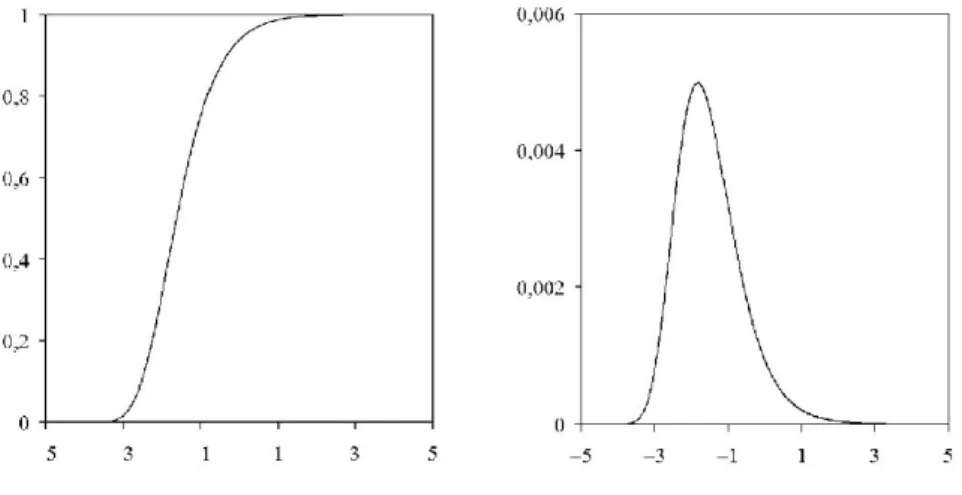
In the simulation study the distribution function of the limiting random variable above is computed numerically in two dierent ways. You can see the asymptotic distribution in Fig. 1. Next, using dierent sample sizes from n = 10 to n = 100 000, we simulate the distribution function of the BCMR-test statisticn(Tn−an). As shown in Fig. 2, we nd that the convergence is overall very slow.
A simulation study was performed to evaluate the power of the BCMR test against many continuous alternative distributions and make comparisons with ve other tests of normality. The rst of these tests is ShapiroWilk's W test [19], for which there is a specic interest in the comparison for the small n = 20 and 50, while for n = 100 we use the ShapiroFrancia [18] extension of the W test, denoted by W0. Among the EDF tests we considered the KolmogorovSmirnov D test [13], with the modication
Figure 1: The asymptotic distribution function (left) and its density (right)
Figure 2: The distribution functions of the BCMR-test statisticn(Tn−an) forn = 10, 20 (dotted line), 50 and the asymptotic distribution function the thicker line marked with A on the left (left). The same forn= 100 and 100 000 (right)
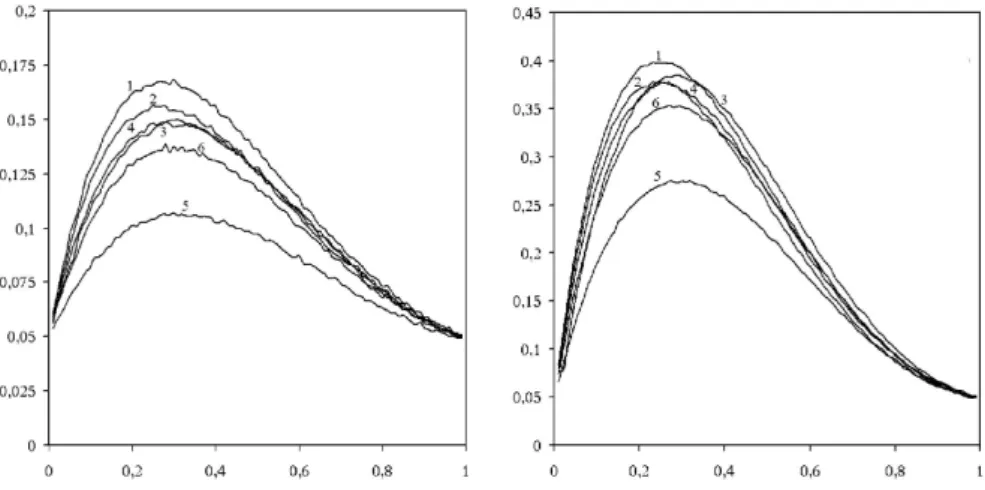
Figure 3: Power of the BCMR, W, ISE, BHEP, D and A2 test as a function of λ for CN(λ,4) (left) and the same for CN(λ,9): 1=BCMR test; 2=W test; 3=ISE test;
4=BHEP test; 5=D; 6=A2 test (right)
suggested by Stephens [20], and the Anderson-Darling A2 test [1]. The fourth test we have chosen is based on density estimation, the integrated squared error (ISE) test of Bowman and Foster [3] with xed kernels. The fth test is based on the empirical characteristic function, the BHEP test from Epps and Pulley [11]. The two gures in Fig. 3 contain a comparison of the powers of ve tests against contaminated normal alternatives for n = 20 and α = 0.05 signicance level. The symbol CN(λ, σ2) stands for the contaminated normal distribution F(x) = (1−λ)Φ(x) +λΦ(x/σ), x ∈ R, for all0< λ <1 and σ >0.
A rough general conclusion of this study is that the BCMR-test usually per- forms better than the other tests, except for the combination of the WilkShapiro- and the ShapiroFrancia-test. In most cases the properties of the latter combination and the properties of the BCMR quantile correlation test appear to be very similar to each other. Since under the null hypothesis the asymptotic distribution for Wilk Shapiro-test is the same as for the BCMR-test, thus the result of the power study isn't surprising.
5 Goodness of t to the logistic family
We present the weighted version of the quantile correlation test statistics for good- ness of t to the logistic family, introduced by del Barrio, Cuesta-Albertos, Matrán and Rodríguez-Rodríguez [10], and del Barrio, Cuesta-Albertos and Matrán [9]. The use of weight functions in the test statistics were suggested independently from each other by de Wet in [7] and [8] and by S. Csörg® in [4] and [5]. It is an interesting fact that there the authors' motivations were considerably dierent. S. Csörg® showed that the suitably weighted versions of the correlation tests have limiting distribution for more
family of probability distributions; de Wet expected the loss of degrees of freedom in the limiting null distribution (in the case of the normal family this means that the rst two terms are missing in the innite series representation of the asymptotic distribu- tion). We prove the results of S. Csörg® [5] for location and scale logistic family with the weight function for location family suggested by de Wet.
For a given distribution function G(x), x ∈ R, and for θ ∈ R and σ > 0, let Gθσ(x) =G((x−θ)/σ), x∈R, and consider the location-scale family
Gl,s ={Gθσ :θ ∈R, σ >0}.
Denote by QG(t) = G−1(t),0 < t < 1, the quantile function of G. Consider a weight function w : (0,1) → [0,∞) satisfying R1
0 w(t) dt = 1, and dene the weighted r-th moment
µr(G, w) :=
Z 1 0
(QG(t))rw(t) dt = Z ∞
−∞
xrw(G(x))dG(x).
Assume that µ1(G, w) and µ2(G, w) are nite, and dene also the weighted variance:
ν(G, w) := µ2(G, w)−µ21(G, w)≥0.
The weighted L2-Wasserstein distance with weight function w of two distributions F and Gcan be dened as
Ww(F, G) :=
Z 1 0
(QF(t)−QG(t))2w(t) dt 12
.
Therefore the weighted L2-Wasserstein distance Ww(F,Gl,s) = inf{Ww(F, G) : G ∈ Gl,s} between F and location-scale familyGl,s, scaled to F is
Ww2(F,Gl,s)
ν(F, w) = 1− hR1
0 QF(t)QG(t)w(t)dt−µ1(F, w)µ1(G, w)i2
ν(F, w)ν(G, w) ,
as derived in [5].
Consider a random sampleX1, . . . , Xnwith common distribution functionF, and let a xed distribution functionG. We would like to test the null hypothesis H0 :F ∈ Gl,s. Letting Qn be the sample quantile function, in order to dene the following test statistics
Vn := 1− hR1
0 Qn(t)QG(t)w(t)dt−µ1(G, w)R1
0 Qn(t)w(t)dti2
ν(G, w)
R1
0 Q2n(t)w(t)dt− R1
0 Qn(t)w(t)dt 2
= 1−
hPn
k=1Xk,n
nR kn
k−1 n
QG(t)w(t)dt−µ1(G, w)R kn
k−1 n
w(t)dt oi2
ν(G, w)
Pn
k=1Xk,n2 R kn
k−1 n
w(t)dt− Pn
k=1Xk,nR kn
k−1 n
w(t)dt2,
derived from the weighted L2-Wasserstein distance between the empirical distribution of the sample and the location-scale familyGl,s.
Csörg® determined the limiting behaviour of this statistics, below we use the following general result due to Csörg® [5].
Theorem 8 (Csörg® [5]) Let w be a nonnegative integrable function on the interval (0,1), for which R1
0 w(t) dt = 1. Suppose thatG has nite weighted second moment and that it is twice dierentiable on the open interval (aG, bG) such that g(x) =G0(x) >0 for all x∈(aG, bG), and let B denote the Brownian bridge. If the conditions
sup
0<t<1
t(1−t)|g0(QG(t))|
g2(QG(t)) <∞,
Z 1 0
t(1−t)
g2(QG(t))w(t)dt <∞, and
n Z n+11
0
[Y1,n−QG(t)]2w(t)dt−→0,P n Z 1
n n+1
[Yn,n−QG(t)]2w(t)dt−→0P are satised, the following asymptotic is valid:
If F belong to Gl,s generated by G, then nVn−→VD g := 1
ν(G, w) (Z 1
0
B2(t)
g2(QG(t))w(t)dt− Z 1
0
B(t)
g(QG(t))w(t)dt 2)
− 1
ν(G, w) Z 1
0
B(t)QG(t)
g(QG(t)) w(t)dt− µ1(G, w) ν(G, w)
Z 1 0
B(t)
g(QG(t))w(t)dt 2
. This theorem was used to establish the asymptotic distributions of the test statistics specialized to the logistic family.
Results
Consider the logistic distribution function G(x) = 1/(1 +e−x), x ∈ R, and Gl,s
denotes the logistic location-scale family as dened above. With the weight function suggested by de Wet [8] for the logistic location family w(t) = 6t(1−t), 0 < t < 1, with the weighted rst moment µ1(G, w) = 0 and with the weighted second moment µ2(G, w) =π2/3−2 the location-scale-free test statistic specializes to
Vn= 1−
" n X
k=1
ak,nXk,n
#2
π2 3 −2
n
X
k=1
bk,nXk,n2 −
n
X
k=1
bk,nXk,n
!2
,
where the coecients are given explicitly by ak,n =
Z kn
k−1 n
6t(1−t) ln t
1−t
dt
= k2(3n−2k)
n3 ln k
n−k − (k−1)2(3n−2k+ 2)
n3 ln k−1
n−k+ 1 + ln n−k
n−k+ 1 +1−2k n2 + 1
n , bk,n =
Z kn
k−1 n
6t(1−t)dt = 3(2k−1)
n2 +2(−3k2+ 3k−1)
n3 .
As a corollary to the asymptotic results from [5] we obtain the following limiting distribution of the test statisticsVn.
Theorem 9 If the distribution functionF of the sample belongs to the logistic location- scale family Gl,s then the rescaled statistic nVn has the asymptotic distribution
nVn−→D V := 1 π2/3−2
(Z 1
0
6B2(t) t(1−t)dt−
Z 1 0
6B(t) dt 2)
−
1 π2/3−2
Z 1 0
6B(t) ln t
1−t
dt 2
, where the integrals exists with probability1.
Del Barrio, Cuesta-Albertos and Matrán [9] obtained the asymptotic distribution as the KarhunenLoève expansion of the weighted Brownian-bridge. With the same technique we determine the innite series representation of our limiting distribution.
Theorem 10 The limiting distribution V can be represented alternatively as V =D 1
π2 3 −2
∞
X
k=2
6
k(k+ 1)Zm2 −
"
1
π2 3 −2
∞
X
l=1
3√ 4l+ 1
l(l+ 1)(2l−1)(2l+ 1)Z2l
#2
, where (Zm)∞m=1 is an innite sequence of independent identically distributed standard normal random variables, and the series converges with probability 1.
Simulation results
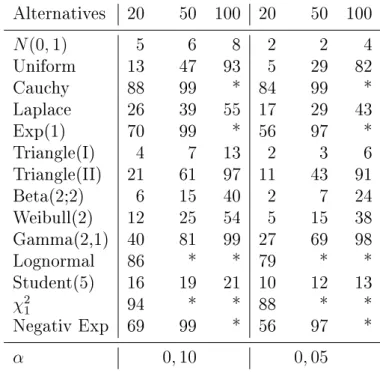
Similarly to the previous section a simulation study was performed to evaluate the power of the tests. The numerical results is presented in Table 1. We compare the new test with Meintanis-tests based on the empirical characteristic function and the empirical momentum generating function from [15].
A rough general conclusion of this study is that a simply computable test statistic is obtained, the asymptotic critical values may be used and the test seems to be average powerful.
References
[1] T. W. Anderson and D. A. Darling. Asymptotic theory of certain goodness of t criteria based on stochastic processes. Annals of Mathematical Statistics, 23:193 212, 1952.
[2] F. Balogh and É. Krauczi. Weighted quantile corelation test for the logistic family.
Acta Scientiarum Mathematicarum.(Szeged), 80(1-2):307326, 2014.
[3] A. Bowman and P. Foster. Adaptive smoothing and density-based tests of multi- variate normality. JASA. Journal of the American Statistical Association, 88:529 537, 1993.
[4] S. Csörg®. Weighted correlation tests for scale families. Test, 11(1):219248, 2002.
[5] S. Csörg®. Weighted correlation tests for location-scale families. Mathematical and Computer Modelling, 38(7-9):753762, 2003. Hungarian applied mathematics and computer applications.
[6] S. Csörg® and W. B. Wu. On the clustering of independent uniform random variables. Random Structures Algorithms, 25(4):396420, 2004.
[7] T. de Wet. Discussion of "Contributions of empirical and quantile processes to the asymptotictheory of goodness-of-t tests". Test, 9(1):7479, 2000.
Table 1: Empirical powers (in %) for nVn against some alternatives (n = 20,50 and 100 sample sizes,∗ 100% empirical power, α signicance level
Alternatives 20 50 100 20 50 100
N(0,1) 5 6 8 2 2 4
Uniform 13 47 93 5 29 82
Cauchy 88 99 * 84 99 *
Laplace 26 39 55 17 29 43
Exp(1) 70 99 * 56 97 *
Triangle(I) 4 7 13 2 3 6
Triangle(II) 21 61 97 11 43 91
Beta(2;2) 6 15 40 2 7 24
Weibull(2) 12 25 54 5 15 38
Gamma(2,1) 40 81 99 27 69 98
Lognormal 86 * * 79 * *
Student(5) 16 19 21 10 12 13
χ21 94 * * 88 * *
Negativ Exp 69 99 * 56 97 *
α 0,10 0,05
[8] T. de Wet. Goodness-of-t tests for location and scale families based on a weighted L2-Wasserstein distance measure. Test, 11(1):89107, 2002.
[9] E. del Barrio, J. A. Cuesta-Albertos, and C. Matrán. Contributions of empirical and quantile processes to the asymptotic theory of goodness-of-t tests. Test, 9(1):196, 2000. With discussion.
[10] E. del Barrio, J. A. Cuesta-Albertos, C. Matrán, and J. M. Rodríguez-Rodríguez.
Tests of goodness of t based on the L2-Wasserstein distance. The Annals of Statistics, 27(4):12301239, 1999.
[11] T. Epps and L. B. Pulley. A test for normality based on the empirical characteristic function. Biometrika, 70:723726, 1983.
[12] T. Inglot and T. Ledwina. Towards data driven selection of a penalty function for data driven Neyman tests. Linear Algebra and its Applications, 417(1):124133, 2006.
[13] A. Kolmogorov. Sulla determinazione empirica di una legge di distribuzione. Gior- nale del Istituto Italiano degli Attuari, 4:8391, 1933.
[14] É. Krauczi. A study of the quantile correlation test of normality. Test, 18(1):156 165, 2009.
[15] S. G. Meintanis. Goodness-of-t tests for the logistic distribution based on empir- ical transforms. Sankhy a. The Indian Journal of Statistics, 66(2):306326, 2004.
[16] K. É. Osztényiné. Joint cluster counts from uniform distribution. Probability and Mathematical Statistics, 33(1):93106, 2013.
[17] E. S. Pearson. A further development of tests for normality. Biometrika, 22:239 249, 1930.
[18] M. W. Shapiro, S.S. and H. Chen. An approximate analysis of variance test for normality. Journal of the American Statistical Association, 63:134372, 1968.
[19] S. Shapiro and M. Wilk. An analysis of variance test for normality (complete samples). Biometrika, 52:591611, 1965.
[20] M. A. Stephens. EDF statistics for goodness of t and some comparisons. Journal of the American Statistical Association, 69:730737, 1974.