Development of Anhydrous Ethanol Puri fi cation: Reduction of Acetal Content and Vapor − Liquid Equilibrium Study of the Ethanol − Acetal Binary System
Eniko Haaz, Daniel Fozer, and Andras Jozsef Toth*
Cite This:https://dx.doi.org/10.1021/acsomega.0c04750 Read Online
ACCESS
Metrics & More Article Recommendations*
sı Supporting InformationABSTRACT: Acetaldehyde diethyl acetal (herein called acetal) is an important pollutant of anhydrous ethanol. Isobaric vapor−liquid equilibrium (VLE) of an ethanol−acetal binary system was measured using a vapor condensate and liquid circulation VLE still. The experimental data were correlated with Wilson, nonrandom two- liquid (NRTL), and universal quasichemical (UNIQUAC) activity coefficient models, which were found suitable for representing the VLE data. Proper agreements between experimental and calculated VLE data were obtained, which were then confirmed with consistency tests. The applicability of the novel VLE data was demonstrated during an investigation of an anhydrous ethanol purification column.
Reduction of the concentration of acetal and other pollutants was
examined and optimized in a flowsheet environment. The modeling results were verified in a laboratory with an experimental distillation column, confirming a correct agreement between the results. It must be highlighted that the developed method is suitable for the production of pharmacopeial quality anhydrous alcohol, based on reliable, verified VLE data. The results show the importance of accurate VLE data in critical compositions (low pollutant content); moreover, aiming at high product purity, experimental validation has paramount importance. The consistency between the three platforms (VLE and distillation experiments andflowsheet simulation) confirms the accuracy of the developed method.
1. INTRODUCTION
Certain industries, for example, pharmaceutical and fine chemical sectors, need high purity chemicals. Such chemicals are frequently produced by distillation. In the case of pharmacopeial anhydrous alcohol, there are strict requirements regarding polluting compounds. For the reliable production of such ethanol, a proper process should be designed. Nowadays, the process design activities are strongly based on professional flowsheeting software programs. These software programs must operate on a reliable database, rigorous modeling tools, and accurate calculation based on thermodynamic equilibria. The accuracy of these tools is generally sufficient; however, in a research focused on obtaining high purity chemicals, special attention must be paid to the evaluation of the computed results.
A typical example for the application of distillation is the production of ethanol, as a precious chemical infine chemical industry.1Basically, ethanol production is performed through a biological process, resulting in bioethanol, obtained in different qualities/purities depending on its application.2−5
Anhydrous ethanol has an alcohol content of at least 99.7 v/v
% and thus an extremely low water content.6The extremely low water content makes it suitable for use by fuel manufacturers to make mixed fuel.7 By mixing with traditional petrol in fuel production, the proportion of biocomponents has increased,
thus reducing traffic emissions of environmentally harmful greenhouse gases.8−10 Pharmacopeial anhydrous alcohol is a premium quality anhydrous alcohol which, besides conforming to the relevant EU and Hungarian specifications, also meets the strict requirements of the PHHg VIII, EU Pharma 4 pharmacopeial regulations.11,12The major aim of this work is to develop the conversion process from anhydrous ethanol produced on a biological source to pharmacopeial anhydrous alcohol using distillation.
The required level of purity is extremely difficult to achieve as raw anhydrous alcohol contains a wide variety of contaminants, albeit only in small concentrations. Examples of ethanol contaminants include acetal, acetaldehyde, acetone, benzene, cyclohexane, methanol, ethyl methyl ketone, isobutyl methyl ketone, propanol, isopropyl alcohol, butanols, furfural, 2- methylpropan-2-ol, and 2-methylbutan-2-ol.13 During the distillation process, polluting compounds have to be removed
Received: September 28, 2020 Accepted: December 23, 2020
Article http://pubs.acs.org/journal/acsodf
© XXXX The Authors. Published by American Chemical Society
A
https://dx.doi.org/10.1021/acsomega.0c04750 ACS OmegaXXXX, XXX, XXX−XXX License, which permits unrestricted use, distribution and reproduction in any medium,
provided the author and source are cited.
Downloaded via BUDAPEST UNIV TECHNOLOGY & ECNMC on January 6, 2021 at 07:45:32 (UTC). See https://pubs.acs.org/sharingguidelines for options on how to legitimately share published articles.
to obtain the high purity bottom product, considered pharmacopeial anhydrous alcohol.
One of the most important pollutant compounds is acetal, as it belongs to the most common contaminants. Acetaldehyde diethyl acetal (1,1-diethoxyethane) is a major flavoring component of distilled beverages, especially of sherry14 and malt whisky.15 In spite of being one of many compounds containing the acetal functional group, this specific chemical is often simply referred to as acetal.
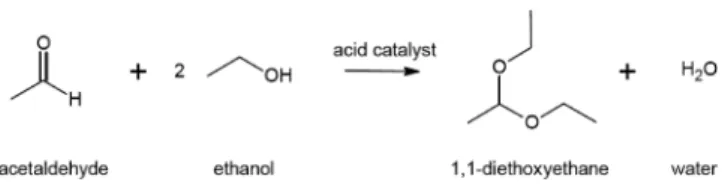
Acetal is applied in the design of synthetic perfumes to increase the resistance to oxidation, therefore the lifetime of perfumes. Acetals have been under consideration as oxygenated additives to diesel fuel because they drastically decrease the emission of nitrogen oxides and other particles while retaining or improving the cetane number and helping in the combustion of thefinal products, without decreasing the ignition quality.16−19 1,1-Diethoxyethane production involves the reversible reaction of acetaldehyde and ethanol in acid medium, according to the following: acetaldehyde + 2 ethanol↔acetal + water (see Figure 1).20−22However, acetaldehyde could be replaced by
ethylene, acetylene, or vinyl ether.23 The advantage of using acetaldehyde and ethanol as reactants is that ethanol is produced from renewable sources (mainly from the sugarcane industry) and acetaldehyde can be produced by dehydrogenation of ethanol or direct ethylene oxidation.19,24,25
The reaction shown inFigure 1is slightly exothermic; at a temperature of 25°C, a 59% conversion can be achieved with a sulfonic acid catalyst. The acetal formed can be used as an additive to diesel fuels as it increases the cetane number and promotes combustion of the mixture.26
In order to increase the purification efficiency, it is essential to know the exact vapor−liquid phase equilibrium data of the mixture. Ionescu et al.27 have presented the vapor−liquid equilibrium (VLE) data and nonrandom two-liquid (NRTL), Wilson, and Gothard model parameters of ethanol−diethyl acetate and i-propanol−diethyl acetate binary mixtures. In contrast, the VLE data and main thermodynamic models for other contaminant components of anhydrous ethanol have already been explored in detail.28,29Consequently, a further goal of this work is to experimentally determine the VLE data of this binary mixture for universal quasichemical (UNIQUAC) model parameters too and to verify the VLE data with laboratory distillation experiments and in aflowsheet environment.
The purpose of VLE analysis is to determine equilibrium- related data and the boiling-dew point, in addition to thermodynamic data. Today, these can be calculated with fairly high accuracy using process simulators, various state equations, and activity coefficient models, but the basis of the calculations lies in the knowledge of reliable and accurate measurement data and physicochemical parameters. It is not possible to perform accurate calculations with thermodynamic relations alone, as it requires knowledge of appropriate measurement data and parameters derived from them.
These can be used to explore the possible azeotropic behavior of liquid mixtures; furthermore, separation possibilities of liquid mixtures can also be modeled on the basis of this data.
Simulation programs often determine the state of a multi- component mixture from the parameters of the pure components, which can cause discrepancies with their actual behavior. For example, they show an azeotrope, or a liquid− liquid distribution, where it does not actually occur, or they do not reveal it where it is in fact present. However, knowledge of azeotropes is essential in the design of a separation unit, as they require different technologies and special design considerations.
VLE data and the resulting pair interaction parameters can be used to model the separation of different mixtures, as well as for the design of separation systems. In the context of industrial implementation, the economic aspects are also taken into account in which case different separation models can also be used for cost calculation.
During the measurements, it is necessary to examine the equilibrium phases of vapor and liquid under the same conditions. VLE points can be determined in two ways. Either the operation is carried out at constant temperature and the pressure is changed point by point or vice versa. By these means, it is possible to perform isothermal or isobaric measurements.
Since the vast majority of columns in industrial separation units operate under constant pressure, in the present work, the vapor−liquid phase equilibrium of the various mixtures is also measured at constant pressure.
However, the measurement data must be examined to determine whether they are in accordance with the relevant thermodynamic laws, for which the so-called thermodynamic consistency tests, derived from thermodynamic relationships, are used.30 Thermodynamic theorems provide a deeper understanding of different physical, physicochemical, and thermal processes. The equations derived from these are still used today to quantitatively describe chemical systems and phase equilibria. In order to make sure that the measured data comply with the laws of thermodynamics, consistency tests can serve as a tool for verification.31It is important to check if the measured equilibria correspond to reality, that is, whether the measurement points are consistent or inconsistent.32,33If they are shown to be consistent, they meet the thermodynamic theorems and the data set can be considered reliable.
2. RESULTS AND DISCUSSION
First, the modified equipment and VLE measurement procedure were tested with the acetaldehyde−ethanol binary mixture as a well-known and studied system. Good reproducibility and correlation with published results were obtained for the VLE data29at 101 kPa (Supporting Information:Table S1, Figures S1 and S2). It can be stated that the equilibrium still was suitable for measurements.
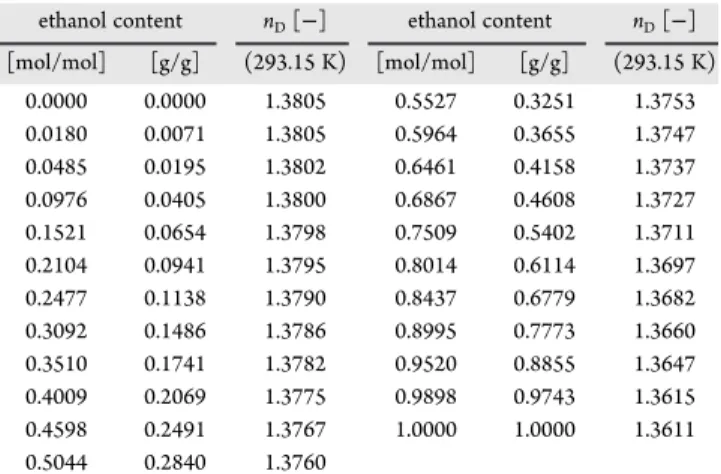
The refractive indexes were experimentally determined in the whole concentration range for the ethanol (1)−acetal (2) system atT = 293.2 K. The data are shown inTable 1. The concentration versus refractive index plots are shown inFigure 2.The isobaric VLE of ethanol (1)−acetal (2) was measured atp
= 101 kPa. With the experimental data, NRTL, Wilson, and UNIQAC parameters were regressed. The experimental and calculated data are presented inTable 2andFigures 3and4. The activity coefficients presented were calculated byeq 1.
Figure 1.Acetalization of acetaldehyde and ethanol.
https://dx.doi.org/10.1021/acsomega.0c04750 ACS OmegaXXXX, XXX, XXX−XXX B
y p x p
i i
i i
γ= ×
× * (1)
The minimization of ChemCAD’s objective function was utilized to obtain model parameters34witheq 2.
y y T T
OF ( ) ( )
i N
i i
i N
i i
VLE 1
exp, cal, 2
1
exp, cal, 2
∑ ∑
= − + −
= = (2)
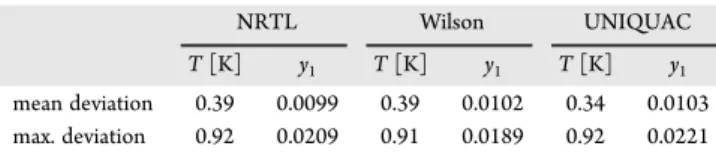
The calculated mean and maximum deviation results can be found inTable 3.
As it can be seen, the maximum deviation is lower than 1.00 for NRTL, Wilson, and UNIQUAC models and no significant difference is revealed in the accuracy of the models.
The volume and area structural parameters applied in UNIQUAC modeling are demonstrated inTable 4.
It can be determined that ethanol forms a minimal boiling azeotropic mixture with acetal in the investigated concentration range. The calculated binary parameters are presented inTable 5.
The thermodynamic consistency test for ethanol−acetal data was performed according to Herrington’s area test for isobaric data.30,34 DH and JH values are calculated according to the following equations.
D 100
ln( / )dx
ln( / )dx
H
x x
x x
0 1
1 2 1
0 1
1 2 1
1 1
1 1
∫
∫
γ γ γ γ
= ×
|
=
=
=
=
(3)
J T
150 T
H
max min
= × |Δ |
(4)
DH −JH ≤10% (5)
TheDHvalue was 18.3% and theJHvalue was found to be 9.5%;
therefore, DH − JH is 8.8%. It can be concluded that the measured data is suitable for application in a flowsheet environment. The elaborated ethanol−acetal binary model can be used for simulation of the ethanol purification column.
Figure 5shows the optimization of ethanol purification. The red line represents the acetal target concentration in the bottom product, which is 10 ppm. Acetaldehyde did not occur in the bottom product in any of the cases. The feed was close to the Table 1. Experimental Refractive Indexes (nD) of the Ethanol
(1)−Acetal (2) Mixture at 293.2 K,p= 101 kPaa
ethanol content nD[−] ethanol content nD[−]
[mol/mol] [g/g] (293.15 K) [mol/mol] [g/g] (293.15 K)
0.0000 0.0000 1.3805 0.5527 0.3251 1.3753
0.0180 0.0071 1.3805 0.5964 0.3655 1.3747
0.0485 0.0195 1.3802 0.6461 0.4158 1.3737
0.0976 0.0405 1.3800 0.6867 0.4608 1.3727
0.1521 0.0654 1.3798 0.7509 0.5402 1.3711
0.2104 0.0941 1.3795 0.8014 0.6114 1.3697
0.2477 0.1138 1.3790 0.8437 0.6779 1.3682
0.3092 0.1486 1.3786 0.8995 0.7773 1.3660
0.3510 0.1741 1.3782 0.9520 0.8855 1.3647
0.4009 0.2069 1.3775 0.9898 0.9743 1.3615
0.4598 0.2491 1.3767 1.0000 1.0000 1.3611
0.5044 0.2840 1.3760
aStandard uncertaintyuisu(nD) = 0.0001,u(p) = 2 kPa,u(T) = 0.1 K;u(x1) = 0.0001.
Figure 2.Experimental refractive indexes of the system ethanol (1)−acetal (2) at T = 293.2 K (black solid circle)x1: mole fraction of ethanol
https://dx.doi.org/10.1021/acsomega.0c04750 ACS OmegaXXXX, XXX, XXX−XXX C
boiling point in every case. Studying Figure 5, the following optimized parameters can be determined: 40 theoretical stages, feed into the eighth stage, the reflux ratio is 26, and column pressure must be kept at 10 kPa. The relatively high values can be considered realistic because extreme purity ethanol was the
goal. It must be mentioned that 10 kPa has to be achieved in feed and column pressure to reach the corresponding acetal concentration in the bottom product. Under a pressure value of 10 kPa, it is difficult to keep up the working pressure in the laboratory column apparatus; therefore, computer calculations were not performed below this value.
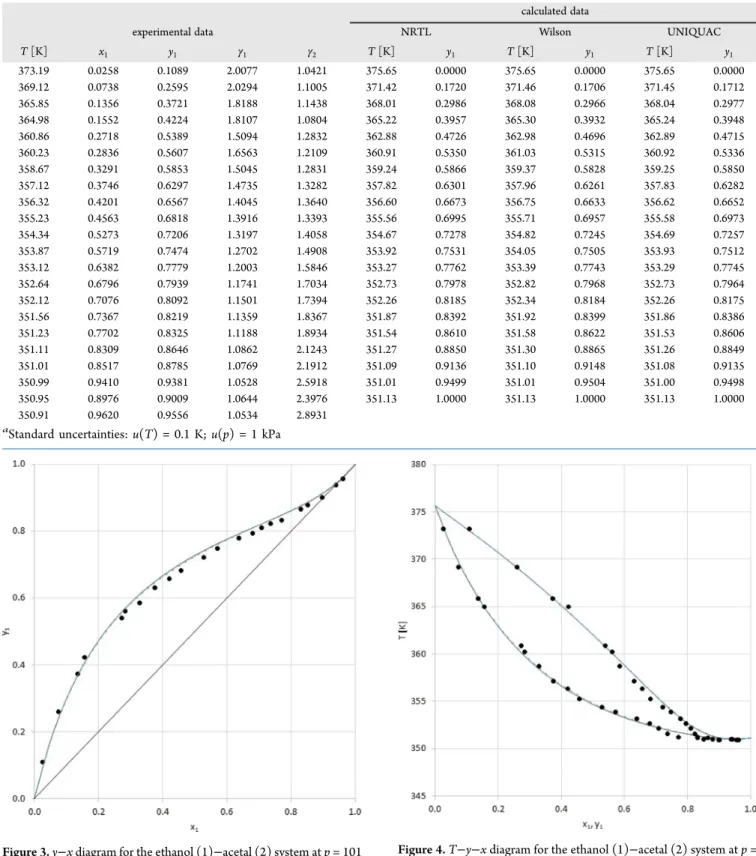
Table 2. VLE Data (T, Temperature;x, Liquid Mole Fraction;y, Vapor Mole Fraction) of Ethanol (1)−Acetal (2) atp= 101 kPaa
calculated data
experimental data NRTL Wilson UNIQUAC
T[K] x1 y1 γ1 γ2 T[K] y1 T[K] y1 T[K] y1
373.19 0.0258 0.1089 2.0077 1.0421 375.65 0.0000 375.65 0.0000 375.65 0.0000
369.12 0.0738 0.2595 2.0294 1.1005 371.42 0.1720 371.46 0.1706 371.45 0.1712
365.85 0.1356 0.3721 1.8188 1.1438 368.01 0.2986 368.08 0.2966 368.04 0.2977
364.98 0.1552 0.4224 1.8107 1.0804 365.22 0.3957 365.30 0.3932 365.24 0.3948
360.86 0.2718 0.5389 1.5094 1.2832 362.88 0.4726 362.98 0.4696 362.89 0.4715
360.23 0.2836 0.5607 1.6563 1.2109 360.91 0.5350 361.03 0.5315 360.92 0.5336
358.67 0.3291 0.5853 1.5045 1.2831 359.24 0.5866 359.37 0.5828 359.25 0.5850
357.12 0.3746 0.6297 1.4735 1.3282 357.82 0.6301 357.96 0.6261 357.83 0.6282
356.32 0.4201 0.6567 1.4045 1.3640 356.60 0.6673 356.75 0.6633 356.62 0.6652
355.23 0.4563 0.6818 1.3916 1.3393 355.56 0.6995 355.71 0.6957 355.58 0.6973
354.34 0.5273 0.7206 1.3197 1.4058 354.67 0.7278 354.82 0.7245 354.69 0.7257
353.87 0.5719 0.7474 1.2702 1.4908 353.92 0.7531 354.05 0.7505 353.93 0.7512
353.12 0.6382 0.7779 1.2003 1.5846 353.27 0.7762 353.39 0.7743 353.29 0.7745
352.64 0.6796 0.7939 1.1741 1.7034 352.73 0.7978 352.82 0.7968 352.73 0.7964
352.12 0.7076 0.8092 1.1501 1.7394 352.26 0.8185 352.34 0.8184 352.26 0.8175
351.56 0.7367 0.8219 1.1359 1.8367 351.87 0.8392 351.92 0.8399 351.86 0.8386
351.23 0.7702 0.8325 1.1188 1.8934 351.54 0.8610 351.58 0.8622 351.53 0.8606
351.11 0.8309 0.8646 1.0862 2.1243 351.27 0.8850 351.30 0.8865 351.26 0.8849
351.01 0.8517 0.8785 1.0769 2.1912 351.09 0.9136 351.10 0.9148 351.08 0.9135
350.99 0.9410 0.9381 1.0528 2.5918 351.01 0.9499 351.01 0.9504 351.00 0.9498
350.95 0.8976 0.9009 1.0644 2.3976 351.13 1.0000 351.13 1.0000 351.13 1.0000
350.91 0.9620 0.9556 1.0534 2.8931
aStandard uncertainties:u(T) = 0.1 K;u(p) = 1 kPa
Figure 3.y−xdiagram for the ethanol (1)−acetal (2) system atp= 101 kPa with experimental data (black solid circle), Wilson (green line), UNIQUAC (blue line), and NRTL (red line) activity coefficient models
Figure 4.T−y−xdiagram for the ethanol (1)−acetal (2) system atp= 101 kPa with experimental data (black solid circle), Wilson (green line), UNIQUAC (blue line), and NRTL (red line) activity coefficient models
https://dx.doi.org/10.1021/acsomega.0c04750 ACS OmegaXXXX, XXX, XXX−XXX D
The reboiler duty value was 2278 MJ/h in the optimum.
Figure 6shows the influence of reboiler duties (Q-RD) on the acetal concentration of the bottom product (W-Acetal).
The experiments were carried out according to the optimized results of the simulations. The reflux ratio was 26 and the distillate/feed ratio was the same as that of the simulation, 10%.
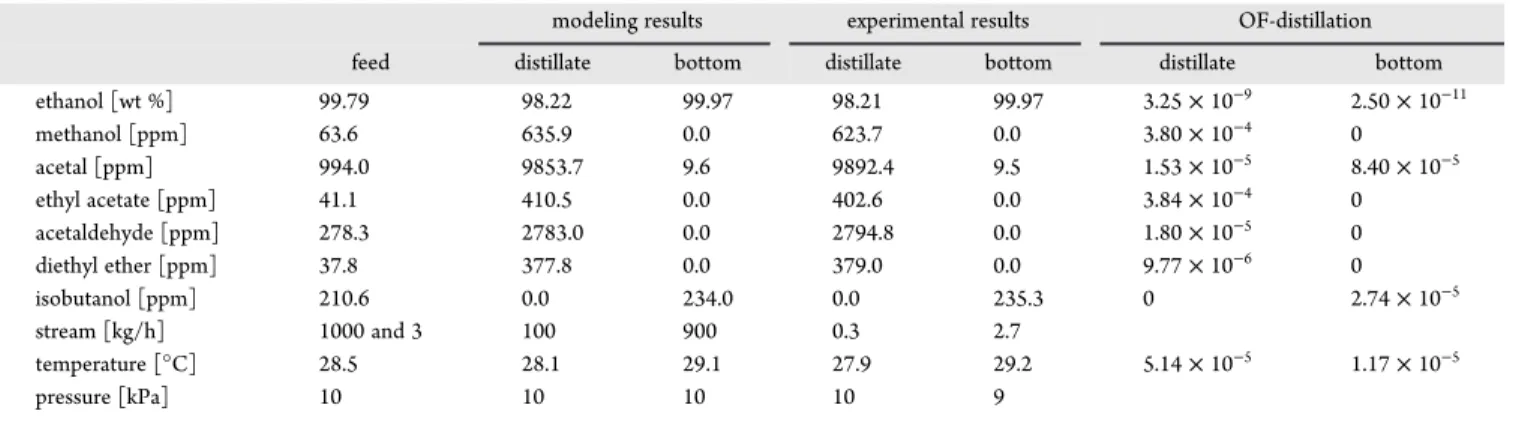
The feed flow rate was 3 kg/h in the case of laboratory experiments. The trap flow rate was 0.05 kg/h, which was analyzed together with the distillate product due to its nearly identical composition. In this evaluation part, the best available results are presented.Table 6shows the optimized simulation results and their control laboratory measurement results. The simulation verification can be taken with the objective function (OFDistillation), which presents minimized deviation of the simulated and the measured values (seeeq 6).35
D W D W
D W
OF or or
i or
n Distillation
1
Experiment Modeling
Experiment
i 2
kjjjjj j
y {zzzzz
∑
z= −
=
(6) The prespecified purification requirements can be achieved in both laboratory and simulation cases as shown inTable 6. As it can be seen, low objective function values can be achieved due to the accurate assembly of laboratory apparatus. Furthermore, the laboratory experiments justified the accuracy of VLE data, especially ethanol−acetal measurements, which also proved to be valid under vacuum conditions.
3. CONCLUSIONS
VLE data for the ethanol−acetal binary system were measured using a modified Gillespie still. Experimental data were Table 3. Accuracy of NRTL, Wilson, and UNIQUAC Models
NRTL Wilson UNIQUAC
T[K] y1 T[K] y1 T[K] y1 mean deviation 0.39 0.0099 0.39 0.0102 0.34 0.0103 max. deviation 0.92 0.0209 0.91 0.0189 0.92 0.0221
Table 4. Structural Parameters for Pure Components (R: Volume Parameter andQ: Area Parameter)
parameter acetal ethanol
R 4.9868 2.1054
Q 4.332 1.972
Table 5. Calculated Binary (Ethanol and Acetal) Interaction Parameters of Wilson (λ12,λ21, Adjustable Parameters), NRTL (Bij,Bji, Dimensionless Interaction Parameters;α, Constant Characteristic of the Nonrandomness of the Mixture), and UNIQUAC (ΔUij,ΔUji, Binary Interaction Parameter) Models
NRTL Wilson UNIQUAC
Bij Bji α λ12 λ21 ΔUij ΔUji 559.08 −168.65 0.296 525.002 213.742 16.25 269.9
Figure 5.Optimization process of modeling of anhydrous ethanol purification.
https://dx.doi.org/10.1021/acsomega.0c04750 ACS OmegaXXXX, XXX, XXX−XXX E
correlated with Wilson, NRTL, and UNIQUAC models. It was demonstrated that acetal forms a minimal boiling azeotropic mixture with ethanol. The data were applied for the design of an ethanol purification unit. Pharmacopeial quality anhydrous alcohol can be produced with the vacuum distillation method.
The pollutant content of the bottom product can be reduced below 300 ppm and for the most important compound, acetal, a value under 10 ppm can be reached. Evaluating the simulated and the experimentally measured data, it can be stated that almost perfect isolation can be guaranteed with the application of the best available laboratory devices. The other conclusion to be drawn is that close to 0% or to 100% we land in a dangerous
region where modeling becomes more important and special attention needs to be paid to the experimental work and analytics. It must be mentioned that there is consistency between the results of flowsheet simulations, distillation and VLE experiments, respectively.
4. MATERIALS AND METHODS
Before the examination of anhydrous ethanol purification, vapor−liquid measurements were performed. The VLE data of acetaldehyde−ethanol is already well known in the literature.29 Therefore, this mixture was examined for the correct operation of the VLE still.
Figure 6.Influence of the reboiler duties [Q-RD (MJ/h)] and acetal concentration of the bottom product [W-Acetal (ppm)] on the reflux ratio [−]
(1), feed stage [−] (2), and stages [−] (3)
Table 6. Comparison of Simulated and Measured Data of the Anhydrous Ethanol Purification Process
modeling results experimental results OF-distillation
feed distillate bottom distillate bottom distillate bottom
ethanol [wt %] 99.79 98.22 99.97 98.21 99.97 3.25×10⁻⁹ 2.50×10⁻¹¹
methanol [ppm] 63.6 635.9 0.0 623.7 0.0 3.80×10⁻⁴ 0
acetal [ppm] 994.0 9853.7 9.6 9892.4 9.5 1.53×10⁻⁵ 8.40×10⁻⁵
ethyl acetate [ppm] 41.1 410.5 0.0 402.6 0.0 3.84×10⁻⁴ 0
acetaldehyde [ppm] 278.3 2783.0 0.0 2794.8 0.0 1.80×10⁻⁵ 0
diethyl ether [ppm] 37.8 377.8 0.0 379.0 0.0 9.77×10⁻⁶ 0
isobutanol [ppm] 210.6 0.0 234.0 0.0 235.3 0 2.74×10⁻⁵
stream [kg/h] 1000 and 3 100 900 0.3 2.7
temperature [°C] 28.5 28.1 29.1 27.9 29.2 5.14×10⁻⁵ 1.17×10⁻⁵
pressure [kPa] 10 10 10 10 9
Table 7. Description of Chemicals Applied in This Work (MW: Molecular Weight)
chemical name formula MW [g/mol] source initial mole fraction purity purification method final mole fraction purity analysis method
ethanol (1) C2H6O 46.07 molar chemicals 0.9999 GC−MS
acetal (2) C6H14O2 118.17 sigma-aldrich 0.9800 distillation 0.9995 GC−MS
acetaldehyde C2H4O 44.05 sigma-aldrich 0.9950 distillation 0.9999 GC−MS
https://dx.doi.org/10.1021/acsomega.0c04750 ACS OmegaXXXX, XXX, XXX−XXX F
The properties of the commercially available chemicals used in VLE examination are introduced in Table 7. Ethanol was applied without further purification. Acetal and acetaldehyde were purified by vacuum distillation at a pressure of 27 kPa.
The VLE still is a modified Gillespie apparatus. An amount of about 100 mL of the appropriate mixture was added to the liquid container at the site of the top valve. For the heating of the mixture, an electric resistance wire was used, folded around the boiler tube. Through the Cottrell-pump, the vapor−liquid mixture was lifted into the thermometer well. Subsequently, the phases were directed into the equilibrium chamber, where their separation could occur, at an equilibrium state. The con- densation of the vapor phase took place on the surface of the chamber and in the condenser, then the resulting condensate was transferred to the vapor sampler. The sample originating from the liquid phase was obtained at the site of the liquid sampler. For temperature measurement, a VWR Traceable Digital Thermometer (China) was used (223−573 K), presenting an uncertainty of 0.1 K. As for atmospheric pressure,
the accuracy of the measurement was 1 kPa.36The atmospheric pressure was measured by a VACUUBRAND PC2003 VARIO (China) vacuum pump.
Refractive indexes were determined for the analysis of the equilibrium samples, three replications were applied. In addition, gas chromatography analysis was performed for certain equilibrium and calibration samples as a validation for the refractometric method.36 A Carl Zeiss Abbe Refractometer (Type G) was applied for the analysis of refractive indexes. The accuracy of the refractometer was 0.0001 at 293.2 K, according to the manufacturer. Literature and experimental refractive indexes and Antoine constants of the used chemicals are listed in Table 8. As it can be seen, the experimental refractive indexes show good agreement with the literature data.
Table 9contains the main compounds of the raw anhydrous ethanol sample.
The main purification requirements for the composition of pharmacopeial quality anhydrous alcohol are the following: 200 ppm in methanol, 10 ppm in acetaldehyde + acetal, 2 ppm in benzene, and 300 ppm in all pollutants.13It can be seen that more types of substances are above the prescribed composition.
Table 8. Experimental and Literature Refractive Indexes (nD) at 293.2 K of Pure Compounds Used and Antoine Constants
property ethanol acetal acetaldehyde
nDpresent work 1.3611 1.3805 1.3308
nDliterature 1.3613 1.3819 1.3316
nDreference 37 38 39
Antoine constantsa
A 5.24677 4.7498 3.68639
B 1598.673 1573.964 822.894
C −46.424 −43.681 −69.899
T-min [K] 292.77 250 293.4
T-max [K] 366.63 375.3 377.5
reference 40 41 42,43
aAntoine constants (bar, K) of ethanol, acetal, and acetaldehyde were calculated by NIST from literature data.
Table 9. Components of the Anhydrous Ethanol Sample with the Boiling Point of Pure Component at 101 kPa
substance
ppm-
v/v wt %
pure component boiling point [°C]
ethanol - 99.79 78.4
methanol 64 8.05×10⁻³ 64.7
acetal 994 1.26×10⁻¹ 102.5
ethyl acetate 41 5.20×10⁻³ 77.1
acetaldehyde 278 3.53×10⁻² 20.2
diethyl ether 38 4.79×10⁻³ 34.6
isobutanol 211 2.67×10⁻² 108.0
Figure 7.Flowsheet of anhydrous alcohol purification.
Figure 8.Flowchart of the optimization process of anhydrous alcohol purification.
https://dx.doi.org/10.1021/acsomega.0c04750 ACS OmegaXXXX, XXX, XXX−XXX G
Distillation can be performed in discontinuous (batch) and continuous mode.44−46In the present study, the amount to be processed was relatively large (1000 kg/h) so continuous operation was recommended. The actual task was to remove polluting compounds and therefore to achieve a high-quality product. According to basic unit operation knowledge, a distillation column with a stripping section should be applied.47 Therefore, considering the data inTable 9, it can be estimated in advance that the polluting compounds’removal results mainly in the distillate product and the bottom product contains the pharmacopeial anhydrous alcohol.
Atfirst,flowsheeting simulations were carried out with the ChemCAD 7.1.5 program to get a comprehensive overview about the system andfind promising alternatives. The optimal reflux ratio (thereby the distillate and bottom flow rates), column pressure, number of theoretical stages, feed stage, and heating and cooling requirements were also determined with the dynamic programming optimization method.48−50The inves- tigated ethanol sample is considered highly nonideal, because it has more azeotropic binary pairs. As an equilibrium model for the calculation of highly nonideal vapor−liquid equilibria, the UNIQUAC method was applied.51−54Considering the vapor− liquid equilibria, that is, our modeling results obtained with ChemCAD, the separation of the ethanol sample can be
performed significantly better if vacuum distillation is applied.
Figure 7shows theflowsheet used for modeling the distillation.
Figure 8summarizes the optimization process of anhydrous alcohol purification.
The modeling results were tested in a laboratory, under experimental conditions. The main parameters of the exper- imental column were the following: 1.5 m high and internal diameters of 25 mm (rectifying section) and 20 mm (stripping section) with Sulzer EX structured packing (seeFigure 9). The column had 40 theoretical stages, according to the measurement carried out with an ethanol−water binary mixture. The feed was preheated and it was pumped into the eighth stage of the column. The column heating was controlled with a heating basket (300 W). The vacuum was maintained with a VACUUBRAND PC2003 VARIO vacuum pump and kept at 10 kPa. Another vacuum pump was also used for bottom product removal and kept at 9 kPa. The distillation apparatus was collected in three traps connected in series and cooled with liquid nitrogen to prevent the evaporation and loss of the distillate product. The reflux ratio was maintained with a Bertolt reflux controller.
As a startup procedure of the experiments, batch distillation wasfirst carried out to obtain a relatively pure liquid satisfying the purity prescriptions in the reboiler.13Afterward, continuous Figure 9.Laboratory demonstrative column for alcohol purification.
https://dx.doi.org/10.1021/acsomega.0c04750 ACS OmegaXXXX, XXX, XXX−XXX H
mode was used until a steady-state (constant outputflows and temperatures) operation was achieved.
The content of the feed (F), distillate(D), bottom product (W), and traps were measured with a Shimadzu GC2010Plus + AOC-20 autosampler gas chromatograph with a ID-BP1 (60 m
×0.32 mm, 1.0μm) column using helium as the carrier gas. The column temperature was kept at constant 60 °C while the injector was thermostated to 250 °C and MS ion source temperature was set to 250°C. Pressure of the helium carrier gas (with 5.0 purity) was kept at 90 kPa. The results were the average of three analyses in the analytical method.55
■
ASSOCIATED CONTENT*sı Supporting Information
The Supporting Information is available free of charge at https://pubs.acs.org/doi/10.1021/acsomega.0c04750.
Experimental equilibrium data andy−xdiagram andT− y−x diagram for the acetaldehyde (1)−ethanol (2) system (PDF)
■
AUTHOR INFORMATION Corresponding AuthorAndras Jozsef Toth−Department of Chemical and Environmental Process Engineering, Budapest University of Technology and Economics, Budapest H-1111, Hungary;
orcid.org/0000-0002-5787-8557; Phone: +36 1463 1494; Email:andrasjozseftoth@edu.bme.hu
Authors
Eniko Haaz−Department of Chemical and Environmental Process Engineering, Budapest University of Technology and Economics, Budapest H-1111, Hungary
Daniel Fozer−Department of Chemical and Environmental Process Engineering, Budapest University of Technology and Economics, Budapest H-1111, Hungary
Complete contact information is available at:
https://pubs.acs.org/10.1021/acsomega.0c04750
Notes
The authors declare no competingfinancial interest.
■
ACKNOWLEDGMENTSThis publication was supported by the János Bolyai Research Scholarship of the Hungarian Academy of Sciences, ÚNKP-20- 4-II-BME-296 New National Excellence Program of the Ministry for Innovation and Technology, NTP-NFTÖ-20-B- 0095 National Talent Program of the Cabinet Office of the Prime Minister, OTKA 128543 and 131586. The research reported in this paper and carried out at the Budapest University of Technology and Economics has been supported by the National Research Development and Innovation Fund (TKP2020 National Challenges Subprogram, Grant No.
BME-NC) based on the charter of bolster issued by the National Research Development and Innovation Office under the auspices of the Ministry for Innovation and Technology.
■
ABBREVIATION NomenclatureBij,Bji Dimensionless interaction parameters (NRTL model)
D Distillate product
DH Parameter for Herington consistency test
F Feed
JH Parameter for Herington consistency test MW Molecular weight
N Number of theoretical stages nD Refractive index
OF Objective function
p Pressure [kPa]
pi* Partial pressure of componenti[Pa]
Q Area parameter (UNIQUAC model) Q-RD Reboiler duty [MJ/h]
R Volume parameter (UNIQUAC model) T Temperature [°C; K]
ΔUij,ΔUji Binary interaction parameter (UNIQUAC model) VLE Vapor−Liquid Equilibrium
W Bottom product
wt % Weight percent x Liquid mole fraction y Vapor mole fraction
Greek letters
α Constant characteristic of the nonrandomness of the mixture (NRTL model)
γi Activity coefficient
λ12,λ21 Adjustable parameters (Wilson model)
■
(1) Batista, F. R. M.; Follegatti-Romero, L. A.; Meirelles, A. J. A. A newREFERENCES distillation plant for neutral alcohol production. Sep. Purif. Technol.2013,118, 784−793.
(2) Ravagnani, M. A. S. S.; Reis, M. H. M.; Filho, R. M.; Wolf-Maciel, M. R. Anhydrous ethanol production by extractive distillation: A solvent case study.Process Saf. Environ. Prot.2010,88, 67−73.
(3) Álvarez, V. H.; Alijó, P.; Serrao, D.; Filho, R. M.; Aznar, M.;̃ Mattedi, S. Production of Anhydrous Ethanol by Extractive Distillation of Diluted Alcoholic Solutions with Ionic Liquids.In Comput.-Aided Chem. Eng.de Brito Alves, R. M.; do Nascimento, C. A. O.; Biscaia, E.
C., Eds. Elsevier:2009;27, 1137−1142.
(4) Hoch, P. M.; Espinosa, J. Optimisation of a bio-ethanol purification process using conceptual design and simulation tools.In Comput.-Aided Chem. Eng., Braunschweig, B.; Joulia, X., Eds. Elsevier:
2008,25, 235−240.
(5) Shenoy, A. U.; Shenoy, U. V. Designing optimal bioethanol networks with purification for integrated biorefineries.Energy Convers.
Manage.2014,88, 1271−1282.
(6) Kumar, S.; Singh, N.; Prasad, R. Anhydrous ethanol: A renewable source of energy.Renew. Sust. Energ. Rev.2010,14, 1830−1844.
(7) Pinto, V. S. Use of 1H nuclear magnetic resonance and chemometrics to detect the percentage of ethanol anhydrous in Brazilian type C premium gasoline.Fuel2020,276, 118015.
(8) Gabriel, K.; Santos, M. M.; Adriano, J.; Marques, J.; Lemos, M.;
Muachia, A.; Barros, A. A. C. Anhydrous bio-ethanol produced from Elaeis Guineensis palm wine for use as a biodiesel feedstock.S. Afr. J.
Chem. Eng.2019,29, 10−16.
(9) Loy, Y. Y.; Lee, X. L.; Rangaiah, G. P. Bioethanol recovery and purification using extractive dividing-wall column and pressure swing adsorption: An economic comparison after heat integration and optimization.Sep. Purif. Technol.2015,149, 413−427.
(10) Kaymak, D. B. Design and Control of a Separation Process for Bioethanol Purification by Reactive Distillation. In Comput.-Aided Chem. Eng., Espuña, A.; Graells, M.; Puigjaner, L., Eds. Elsevier: 2017;
40, 1075−1080.
(11) HealthCare, E. D. F. T. Q. O. M.European Pharmacopoeia (Ph.
Eur.). 10th edition; Council of Europe: 2019.
(12) Snodin, D. J.; McCrossen, S. D. Guidelines and pharmacopoeial standards for pharmaceutical impurities: Overview and critical assessment.Regul. Toxicol. Pharmacol.2012,63, 298−312.
https://dx.doi.org/10.1021/acsomega.0c04750 ACS OmegaXXXX, XXX, XXX−XXX I
(13) Paál, T.; Szalai, H.; Nagy, A.; Haraszti, C.; Boldizsár, I.
Pharmacopoea Hungarica. VIII. edition; Medicina: Budapest, 2004.
(14) Zea, L.; Serratosa, M. P.; Mérida, J.; Moyano, L. Acetaldehyde as Key Compound for the Authenticity of Sherry Wines: A Study Covering 5 Decades.Compr. Rev. Food Sci. Food Saf.2015,14, 681−
693.
(15) Maarse, H.Volatile Compounds in Foods and Beverages. Taylor &
Francis: New York, 1991.
(16) Boennhoff, K. 1,1-Diethoxyethane as Diesel Fuel. DE Patent No.
2,911,411, 1980.
(17) Boennhoff, K. Method for Enhancing the Ignition Performance of Dialkoxyalkanes Used as Diesel Fuel, in Particular 1,1-Diethoxy- ethane. DE Patent No. 3,136,030, 1983.
(18) Golubkov, A.; Golubkov, I. Motor Fuel for Diesel, Gas-Turbine and Turbojet Engines. U.S. Patent No. 02/0026744 A1, 2002.
(19) Silva, V. M. T. M.; Rodrigues, A. E. Novel process for diethylacetal synthesis.AIChE J.2005,51, 2752−2768.
(20) Bramwyche, P. L.; Mudgan, M.; Stanley, H. M. Manufacture of Diethyl Acetal. U.S Patent No. 2 519 540, 1950.
(21) Petersen, M. L. Process for the Production of Liquid Acetals. U.S.
Patent No. 4 024 159, 1977.
(22) Capeletti, M. a. R.; Balzano, L.; de la Puente, G.; Laborde, M.;
Sedran, U. Synthesis of acetal (1,1-diethoxyethane) from ethanol and acetaldehyde over acidic catalysts.Appl. Catal., A2000,198, L1−L4.
(23) Kohlpaintner, C.; Schulte, M.; Falbe, J.; Lappe, P.; Weber, J.
Ullmann’s Encyclopedia of Industrial Chemistry. 7th edition; Wiley-VCH Verlag GmbH & Co. KGaA.: Germany, 2016.
(24) He, X.; Liu, H. Efficient synthesis of 1,1-diethoxyethane via sequential ethanol reactions on silica-supported copper and H-Y zeolite catalysts.Catal. Today2014,233, 133−139.
(25) Silva, V. M. T. M.; Pereira, C. S. M.; Rodrigues, A. E.; Verevkin, S.
P.; Emel’yanenko, V. N.; Garist, I. V.; Gmehling, J. Experimental and Theoretical Study of Chemical Equilibria in the Reactive Systems of Acetals Synthesis.Ind. Eng. Chem. Res.2012,51, 12723−12729.
(26) Gomez, M. F.; Arrúa, L. A.; Abello, M. C. Synthesis of 1,1- diethoxyethane using a continuous flow reactor: catalyst deactivation and effect of feed purity and of solvent addition. J. Chem. Technol.
Biotechnol.2004,79, 391−396.
(27) Ionescu, I.; Cioroianu, D.; Savescu, V. Liquid-vapor-equilibrium data in the binary-systems made up of ethanol, i-propanol and acetaldehyde diethylacetate.Rev. Chim.1994,45, 803−807.
(28) Kim, Y.; Sapei, E.; Keskinen, K. I.; Aittamaa, J. Vapor−Liquid Equilibrium for Binary Systems of 2-Propanol + 1,1-Diethoxyethane at 353 K, Ethyl Ethanoate + 1,1-Diethoxyethane at 348 K, and 2- Propanone + 1,1-Diethoxyethane at 328 K.J. Chem. Eng. Data2005,50, 364−368.
(29) Gmehling, J.; Onken, U. Vapor-Liquid Equilibrium Data Collection: Aqueous-Organic Systems. DECHEMA: Frankfurt/Main, Germany, 1977.
(30) Herington, E. F. G. A thermodynamic test for the internal consistency of experimental data on volatility ratios.Nature1947,160, 610−611.
(31) Wisniak, J. The Herington test for thermodynamic consistency.
Ind. Eng. Chem. Res.1994,33, 177−180.
(32) Herington, E. F. G. Symmetrical-area tests for the consistency of vapour−liquid equilibrium data. I. Isothermal data.J. Appl. Chem.1968, 18, 285−291.
(33) Miklós, D.; Kemény, S.; Almásy, G.; Kollár-Hunek, K.
Thermodynamic consistency of data banks.Fluid Phase Equilib.1995, 110, 89−113.
(34) Havasi, D.; Mizsey, P.; Mika, L. T. Vapor−Liquid Equilibrium Study of the Gamma-Valerolactone−Water Binary System.J. Chem.
Eng. Data2016,61, 1502−1508.
(35) Toth, A. J.; Haaz, E.; Nagy, T.; Tarjani, A. J.; Fozer, D.; Andre, A.;
Valentinyi, N.; Mizsey, P. Novel method for the removal of organic halogens from process wastewaters enabling water reuse.Desalin. Water Treat.2018,130, 54−62.
(36) Havasi, D.; Pátzay, G.; Kolarovszki, Z.; Mika, L. T. Isobaric Vapor−Liquid Equilibria for Binary Mixtures of γ-Valerolactone +
Methanol, Ethanol, and 2-Propanol. J. Chem. Eng. Data 2016, 61, 3326−3333.
(37) Rheims, J.; Köser, J.; Wriedt, T. Refractive-index measurements in the near-IR using an Abbe refractometer.Meas. Sci. Technol.1997,8, 601−605.
(38) O’Neil, M. J.; Heckelman, P. E.; Dobbelaar, P. H.; Roman, K. J.;
Kenny, C. M.; Karaffa, L. S. The Merck Index: An Encyclopedia of Chemicals, Drugs, and Biologicals; Royal Society of Chemistry: 2013.
(39)http://www.raeco.com/training/refractive-index-values.htm.
(40) Ambrose, D.; Sprake, C. H. S. Thermodynamic properties of organic oxygen compounds XXV. Vapour pressures and normal boiling temperatures of aliphatic alcohols.J. Chem. Thermodyn.1970,2, 631− 645.
(41) Stull, D. R. Vapor Pressure of Pure Substances. Organic and Inorganic Compounds.Ind. Eng. Chem.1947,39, 517−540.
(42) Bull, S. S.; Seregrennaja, I. I.; Tsherbakora, P. R. Isothermic Equilibrium of Liquid-Steam in System Water-Acetoaldehyde.Khim.
Prom. (Moscow)1963,7, 507−509.
(43) Coles, K. F.; Popper, F. Vapor-Liquid Equilibria. Ethylene Oxide - Acetaldehyde and Ethylene Oxide - Water Systems.Ind. Eng. Chem.
1950,42, 1434−1438.
(44) Koczka, K.; Mizsey, P. New area for distillation: Wastewater treatment.Period. Polytech., Chem. Eng.2010,54, 41−45.
(45) Tóth, A. J.; Gergely, F.; Mizsey, P. Physicochemical treatment of pharmaceutical process wastewater: Distillation and membrane processes.Period. Polytech., Chem. Eng.2011,55, 59−67.
(46) Mizsey, P.; Tóth, A. J. Application of the principles of industrial ecology for the treatment of process waste waters with physicochemical tools.Industrial Ecology2012,1, 101−126.
(47) Cséfalvay, E.; Deák, A.; Farkas, T.; Hanák, L.; Mika, L. T.;
Mizsey, P.; Sawinsky, J.; Simándi, B.; Szánya, T.; Székely, E.; Vágó, E.
Chemical Unit Operations II; Typotex Kiadó: Budapest, 2011.
(48) Toth, A. J. Comprehensive evaluation and comparison of advanced separation methods on the separation of ethyl acetate- ethanol-water highly non-ideal mixture.Sep. Purif. Technol.2019,224, 490−508.
(49) Haaz, E.; Toth, A. J. Methanol dehydration with pervaporation:
Experiments and modelling.Sep. Purif. Technol.2018,205, 121−129.
(50) Edgar, T. F.; Himmelblau, D. M.; Lasdon, L. S.Optimization of chemical processes; McGraw-Hill: Michigan, USA, 2001.
(51) Wiśniewska-Goclowska, B.; Malanowski, S. X. K. A new modification of the UNIQUAC equation including temperature dependent parameters.Fluid Phase Equilib.2001,180, 103−113.
(52) Klamt, A.; Krooshof, G. J. P.; Taylor, R. COSMOSPACE:
Alternative to conventional activity-coefficient models.AIChE J.2002, 48, 2332−2349.
(53) Egner, K.; Gaube, J.; Pfennig, A. GEQUAC, an excess Gibbs energy model describing associating and nonassociating liquid mixtures by a new model concept for functional groups. Fluid Phase Equilib.
1999,158-160, 381−389.
(54) Abrams, D. S.; Prausnitz, J. M. Statistical Thermodynamics of Liquid Mixtures: A New Expression for the Excess Gibbs Energy of Partly or Completely Miscible Systems.AIChE J.1975,21, 116−128.
(55) Valentinyi, N.; Andre, A.; Haaz, E.; Fozer, D.; Toth, A. J.; Nagy, T.; Mizsey, P. Experimental investigation and modeling of the separation of ternary mixtures by hydrophilic pervaporation.Sep. Sci.
Technol.2020,55, 601−617.
https://dx.doi.org/10.1021/acsomega.0c04750 ACS OmegaXXXX, XXX, XXX−XXX J