Robert A. Tobey Ronald A. Walters Philip G, Hohmann Carl E. Hildebrand Lawrence R. Gurley
Cellular and Molecular Biology Group Los Alamos Scientific Laboratory
University of California Los Alamos, New Mexico
I. INTRODUCTION
The detection of specific sequences of biochemical processes as cells prepare for DNA replication and division (Baserga, 1968;
Mitchison, 1971; Tobey et al., 1974, 1975) suggests the temporal- ly ordered expression of genetic information during the cell cy- cle. Although little is known about the underlying regulatory mechanisms, it has been suggested that changes in chromatin
structure may be involved in control of cycle-specific events (Mazia, 1963). One possible avenue for altering chromatin structure involves the reversible modification of histones (All- frey, 1971; Bradbury and Crane-Robinson, 1971). Consequently, over the past few years we have utilized CHO cells to examine the
5
Biochemical dissection of the cell cycle is greatly facili- tated by use of populations synchronized at different stages in the cycle (Petersen et al., 1969). Cells synchronized in one portion of the cell cycle are generally unsuitable for studies in other phases due to synchrony decay, a naturally occurring loss of synchrony arising from variations in the rate of cycle progres- sion by individual cells in the population (Engelberg, 1964;
Petersen et al., 1969). In particular, cells synchronized in mitosis or early should never be utilized to study " G2 events," since the G2 cells are badly contaminated with cells from other phases of the cell cycle.
For example. Fig. 1A summarizes the kinetic response of CHO cells following mitotic selection (Tobey et al., 1967). Es- sentially identical results are obtained in cultures released from G^-arrest in isoleucine-deficient medium (Tobey and Ley, 1971; Tobey, 1973). Although the initial mitotic population possesses an Engelberg synchrony index (Engelberg, 1964) of 0.97
(where 1.0 is perfect synchrony), note that the maximum propor- tion of G2 cells is only 30% - the result of synchrony decay.
Therefore, it is apparent that cells prepared by mitotic selec- tion or by the isoleucine-deficiency method are useful for study- ing early interphase events, but much less satisfactory for in- vestigating mid- to late-cycle processes.
100 T~7
°oL 2 4 6 8 10 12 14
HOURS ο
ι 1
10
FIGURE 1 Cell-cycle kinetics following synchronization of CHO cells. (A) Cells synchronized by mitotic selection (Tobey et al., 1967) were placed in suspension culture, and aliquots were removed at intervals thereafter for determination of cell-cycle distribu- tion. (B) Cells released from isoleucine-mediated Gj-arrest
(Tobey and Ley, 1971; Tobey, 1973) were treated for 9 hr with 10~3 M hydroxyurea as they were traversing Gj, resulting in an accumu- lation of cells at the Gj/S boundary (Tobey and Crissman, 1972a).
The cells were then washed and resuspended in drug-free medium (t = 0) . Aliquots were removed at intervals thereafter to allow determination of the cell-cycle distribution. Cell-cycle distri- butions were determined by a combination of flow microfluorometry, thymidine-^H autoradiography, and cell number enumeration, as de- scribed previously (Tobey and Crissman, 1972b).
In order to examine events in mid/late interphase, we find it necessary to treat cells traversing G^ (following either mitotic selection or release from isoleucine-deficient medium) with 1 0 ~3 M hydroxyurea, which causes the cells to accumulate near the G^/S border (Tobey and Crissman, 1972a) due to an inhibition of synthe- sis of dATP (Walters et al., 1973). After removing hydroxyurea, the cells proceed synchronously through the cycle as shown in Fig.
IB. These cultures are especially well suited for investigating events at the G^/S boundary and in S phase, but they may also be used for examining later events in view of the 60-65% value of G2 cells obtained approximately 6 hr after drug removal. Similar
FRACTION NUMBER
FIGURE 2 Preparative Polyacrylamide gel electrophoresis pro- files of histone phosphorylation in CHO cells from interphase cultures (Ά and B) and from cultures traversing from G2 into mi- tosis (C and D). The cells were prelaheled for 52 hr with 50 pCi lysine-3H per liter of culture prior to exposure for a 2-hr period to 20 mCi of carrier-free 32PO^ per liter of culture. Specific details involving cell synchronization and isolation and fraction- ation of histones may be found elsewhere (Gurley et al., 1974a).
kinetic data are obtained in cultures synchronized by double- thymidine blockade or isoleucine-thymidine blockade (Kraemer and Tobey, 1972).
Once synchronization techniques are developed, it is absolute- ly essential to know at all stages of the experiment precisely where in the cycle the cells are located. In this laboratory, we utilize a combination of flow microfluorometry, cell number enu- meration, and autoradiography to monitor population kinetics
(Tobey and Crissman, 1972b). Thus, each time a sample is removed for biochemical analysis, a duplicate sample is removed for de- termination of the cell-cycle distribution, thereby ensuring that we are measuring the response of a known population.
III. CELL-CYCLE-SPECIFIC PHOSPHORYLATION OF HISTONES
Our early studies utilized preparative Polyacrylamide gel electrophoresis to examine the patterns of phosphorylation of the various histones at different stages in the CHO cell cycle. In Gj-arrested populations maintained 38 hr in isoleucine-deficient medium, only histone f2a2 was significantly phosphorylated during a 1-hr exposure to 3 2 p o4 (Gurley et al., 1973a).
In contrast, examination of interphase populations (i.e., cycle-traversing cells in G^, S, and G2) revealed that two his- tones were phosphorylated: f2a2 and fl (Fig. 2 A ) . As cells pro- gressed from G2 into M, three histones were phosphorylated to an appreciable extent: histones f2a2, fl, and f3, with evidence for more than one phosphorylated site on fl (Fig. 2B) (Gurley et al., 1973b, 1974a). The fl and f3 fractions were specifically phos- phorylated as cells entered mitosis and were rapidly dephosphor- ylated as cells reentered G^ (Gurley et al., 1974a).
Cell-cycle kinetic studies revealed that interphase-specific phosphorylation of histone fl (also measured by preparative gel electrophoresis) commenced 2 hr prior to entry into S phase
(Gurley et al., 1974a, b ) . This observation allowed us to con- clude that the events involved phosphorylation of old, préexistent fl molecules and provided an early indication that the cells had recovered from the nonproliterating state and were preparing to replicate DNA (Gurley et al., 1974a, b ) .
To obtain more detailed information concerning the phosphory- lation events associated with cell-cycle progression, it was nec- essary to utilize an additional analytical technique. Patterns of phosphorylation of the various subfractions of histone fl were examined by ion exchange column chromatography on Bio-Rex 70. As shown in Fig. 3A, this method resolves at least four distinct fl subfractions from CHO cells. In cultures arrested in late fol- lowing release of isoleucine-deficient cells into complete medium containing hydroxyurea, a single form of phosphorylated fl was
FRACTION NUMBER
FIGURE 3 Bio-Rex 70 ion exchange column chromatography of histone fl from exponential and synchronized cultures of CHO cells. Cells prelabeled with lysine-3Η, as in Fig. 2 above, were pulse-labeled for 1-hr periods with 20 mCi of carrier-free 32PO^
per liter of culture. Four different unphosphorylated fl sub- fractions are indicated by Roman numerals. Specific details in- volving cell synchronization and isolation and fractionation of histones are presented elsewhere (Gurley et al., 1975).
found to exist for each of the four subfractions (Fig. 3B) (Gurley et al., 1975); this G-^ phosphorylation event was designated flG]_»
When the cells in Fig. 3B entered S phase after removal of hydroxyurea, a second, more highly phosphorylated form of fl
(fls) was observed as a faster eluting shoulder in the phosphory- lated flci peak (Fig. 3 C ) . The 3 2P :3H ratio of the fig peak was twice that of the flß^ peak (Gurley et al., 1975).
Finally, in G2/M-rich cultures, two new forms of phosphory- lated fl were observed which had 3 2P :3H ratios approximately four times greater than that observed in the phosphorylated flg-^ peak
(Fig. 3 D ) . This mitotic-specific phosphorylation event was designated f lM (Gurley et al., 1975).
Detailed kinetic analysis of a number of experiments similar to those described in Fig. 3 allowed us to draw the following con- clusions regarding phosphorylation events in the CHO cell (Gurley et al., 1975)
(a) Two hours before initiation of DNA replication, approximately 20% of the "old" fl histone molecules were phosphorylated (flç-^)·
(b) A second phosphorylation event (fig) began as cells entered S phase. This event involved the phos- phorylation of a second site in addition to the flg-^
phosphorylation site. Whereas the amount of phosphor- ylated flGi accumulated in chromatin continued to in- crease throughout the entire cell cycle, the amount of phosphorylated f lg did not increase as cells progressed through S and G2« Maximally, only 10% of the fl mole- cule exhibited this fig type of phosphorylation at any one time.
(c) A third phosphorylation event (flM) resulted from a burst of phosphorylation as cells entered m i - tosis, adding two new chromatographic fractions whose
3 2P :3H ratios were four-fold greater than that of phos- phorylated f l ç ^ ln mitotic cells, all fl molecules were phosphorylated, and f lM was specifically dephos- phorylated as cells reentered G^.
(d) In CHO cells, each of the fl phosphorylation events associated with specific times in the cell cycle
( f lG l, fig, and f lM) occurred on all four histone subfractions (I-IV).
Similarly, from studies utilizing Triton X-100 Polyacrylamide gel electrophoresis, it was concluded that the mitotic specific
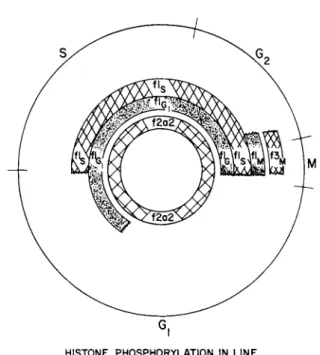
HISTONE PHOSPHORYLATION IN LINE CHO CHINESE HAMSTER CELLS
FIGURE 4 Relationship of histone phosphorylation to the cell cycle of line CHO Chinese hamster cells. The shaded bands indi- cate the times in the cell cycle that histones f2a2, fl, and f3 are phosphorylated.
f 3M phosphorylation occurred on all f3 subfractions (Gurley et al.r 1975).
The relationship between histone phosphorylation and the cell cycle is depicted diagrammatically in Fig. 4. Whereas phosphory- lation of f3 is confined to the mitotic period, histone fl is phosphorylated at three different stages in the cell cycle, and f2a2 occurs throughout the entire cycle and also in G-^-arrested cells maintained in isoleucine-deficient medium (Gurley et al., 1973a).
IV. PHOSPHORYLATION OF SPECIFIC REGIONS WITHIN THE fl MOLECULE DURING CELL-CYCLE PROGRESSION
The phosphorylation events which occur on histone fl during late G-^, S phase, and mitosis suggest an ordered, sequential modi- fication of the histones as cells progress through the cell cycle.
By analyzing 3 2P-labeled phosphopeptides from purified fl histone in synchronized CHO cells, we were able to demonstrate that dis- tinct regions and amino acids (Hohmann et al., 1975) within the fl molecule were phosphorylated at different stages in the cell cycle.
In these studies, the fl histone was first digested with trypsin, and the phosphopeptides released were resolved into four fractions (I-IV) by high-voltage paper electrophoresis (Hohmann et al., 1975). Two of these fractions ( H and III) were further resolved by a second electrophoretic step (Hohmann et al., 1975).
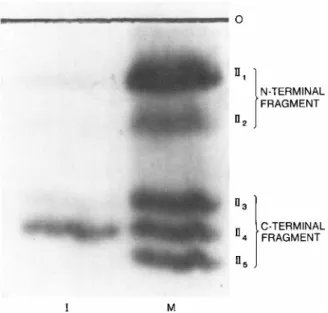
Figure 5 demonstrates that fraction II from mitotic CHO cells con- tains five phosphopeptides, while only one of these peptides
(II4) is found in interphase cells. Therefore, these results con- firm the general conclusions reached above that phosphorylation of f lM is more complex than phosphorylation of flQi or fig.
Experiments were then performed which allowed us to assign the phosphopeptides shown in Fig. 5 to distinct regions within fl molecule. The fl histone was first cleaved at the single tyrosine residue using N-bromosuccinimide (Bustin and Cole, 1969; Bustin et al., 1969), and the N-terminal and C-terminal fragments were separated by exclusion chromatography. These two large fragments were then digested with trypsin, and the various peptides were fractionated by electrophoresis. All the peptides in fraction II were assigned to the N-terminal and C-terminal regions of the fl molecule, as shown in Fig. 5. Other experiments (not shown) al-
lowed us to assign a total of 16 phosphopeptides to either the N- terminal or C-terminal fragment of the fl molecule (Hohmann, Tobey, and Gurley, in preparation). Due to ambiguous tryptic
FIGURE 5 Autoradiograph depicting histone fl tryptic fraction II phosphopeptides found in inter phase (I) and mitotic (M) cul- tures of CHO cells. Cells were pulse-labeled for a 2-hr period with 50 yCi of carrier-free 32P04 per liter of culture. Following purification of fl by ion exchange chromatography, tryptic frag- ments were prepared and resolved into four fragments by high- voltage paper electrophoresis. One of these tryptic fragments
(fraction II) (Hohmann et al., 1975) was further resolved into five phosphopeptides (ΙΙ1ψ_5) by an additional electrophoretic step, as described previously (Hohmann et al., 1975). Localiza- tion of tryptic fraction II phosphopeptides in the N-terminal or C-terminal portion of the fl molecule was accomplished in the manner described in the text.
cleavages, it is possible that many of the 16 phosphopeptides are related to each other (i.e., contain the same site). Thus, the number of phosphopeptides released is not a true indication of the number of sites. Precise determination of the number of sites must be derived ultimately from sequence analysis.
Our previous studies with CHO cells (Hohmann et al., 1975) demonstrated that threonine was phosphorylated more rapidly than serine in mitotic cells, while the reverse was true in interphase cells. Thus, the phosphopeptides from histone fl can be dis- tinguished not only by their position in the fl molecule and the time in the cell cycle when they appear but also by their content
ϋ U
Φ U
§
υ
φ rC - Ρ
β -Η U
Q CO 4->
β φ
>
w
β ο
•Η
- Ρ tö ιΗ >ι
è
ft COΟ
> <
I
• Η ^
/ Φ - 4->
' I
'Μ
ι ηχ id /
-μ \ υ ι
ι - Η -CO
rH
4->
β Φ
>
Φ
ϋ ϋ
Φ U
Φ - Ρ ί
υ
td β -Η
• r Φ 4->
Ό Φ 4->
id ιΗ >ι
&
ft
Ο
β Ο
•Η CP Φ
β ο
Φ
,β H
Φ
ι β
φ •Η β β
•Η 0
Φ Φ U CO
4 J Φ
•Η β β 0 Φ
.β
Φ
•Η β - - -β
0 Φ U
Φ β
·Η
Φ CO
Φ
•Η β
Φ CO
Φ β
•Η VI
Φ CO
Ό Φ 4->
ιΗ Id
>ι VI
&
2
ΡΑ
4->
β
Φ
•Η CO cd CO
•Η CO
r ß 4->
4->
Vi Ο
CO
C7>
• H pH
β
•Η
CO
4 J Ο ß CO Φ Τ 3 •Η
4->
ft Φ
ft
15
low level of this phosphorylation event. As the cells enter m i - tosis, phosphorylation occurs in the C-terminal region on both serine and threonine, and, for the first time, in the N-terminal region on both serine and threonine.
These results indicate that phosphorylation of histone fl in interphase CHO cells involves serine in the C-terminal fragment.
In contrast, serine and threonine residues are phosphorylated in mitotic cells in both C-terminal and N-terminal fragments. Thus,
interphase and mitotic phosphorylation events are both qualita- tively and quantitatively different.
V. CELL-CYCLE-SPECIFIC CHANGES IN CHROMATIN ORGANIZATION
Once it was demonstrated that the pattern of histone phos- phorylation changed during the cell cycle, the intimate associa- tion of histones and DNA in chromatin suggested that there might be corresponding cell-cycle-specific changes in the structure of chromatin during interphase as well as mitosis. To explore this notion, we initiated a study with the chemical agent, heparin (a natural polyanion), which interacts predominantly with the his- tone component of chromatin (Arnold et al., 1972). Treatment of chromatin or isolated nuclei with heparin causes histones to be removed in a well defined sequence (lysine-rich fl is released preferentially) (Hildebrand et al., 1975). Concomitant with the
HEPARIN CONCENTRATION at 5 0 % of MAXIMUM NUCLEAR DECONDENSATION (/ig/ml) H>-<H
LABELED FRACTION W HEPARIN CONCENTRATION at 5 0 % of MAXIMUM
NUCLEAR DECONDENSATION (/xg/ml)
LABELED K - ) o r DIVIDED W FRACTION
FIGURE 6 Cell-cycle dependence of heparin-mediated release from nuclei of prelaheled DNA. (A) Early interphase: cells synchronized by mitotic selection, and (B) late interphase: cells synchronized by mitotic selection/hydroxyurea treatment. Experi- mental details are described elsewhere (Hildebrand and Tobey, 1975).
removal of histones with heparin, the DNA is released in a highly decondensed state (Arnold et al., 1972). Thus, changes in the amount of heparin which will décondense a given amount of DNA in a specific time reflect alterations in the organization of chro- matin related to the arrangement of histones on the DNA.
The cell-cycle kinetics of chromatin structural changes were measured in CHO cells traversing early interphase by determining
the concentration of heparin required to release 50% of the DNA from nuclei during a 5-min incubation period (Fig. 6A) (Hilde- brand and Tobey, 1975). The resistance of chromatin to heparin- mediated DNA decondensation increased as the cells progressed
through G^ into S. Similarly, this resistance continued increas- ing through S and G2 but then fell abruptly when the cells di- vided (i.e., reentered G-, ) (Fig. 6B) . Taken together, the data
poral arrangement of biochemical events during the cell cycle (Fig. 7 ) . Our results strongly suggest that, in our cultured cell system, proliferation capacity depends on a complex series of coordinated events. That is, even cells grown in the artificial environment of tissue culture are subject to specific regulatory processes which ensure an orderly sequence of operations in prep- aration for DNA replication and cell division.
Inhibition of DNA replication does not necessarily prevent initiation of other preparative events, since the phosphorylation of histone f1 (Gurley et al., 1974b), the increase in lipoprotein- associated DNA (Hildebrand and Tobey, 1973), and the elevation in level of three of the deoxyribonucleoside triphosphates (Walters et al., 1973) are initiated sequentially in cultures traversing Gi in the presence of hydroxyurea. That is, those processes nor- mally prerequisite to initiation of genome replication are
"switched on" in proper order at the appropriate time, even when DNA synthesis is inhibited. Detailed discussions of the inter- relationships between events in the CHO cell cycle (Fig. 7) are presented elsewhere (Tobey et al., 1974, 1975).
DECREASE IN dCTP POOL SIZE
SYNTHESIS OF FINAL DIVISION ESSENTIAL PROTEIN
SYNTHESIS OF FINAL DIVISION- ESSENTIAL RNA
DISAPPEARANCE OF d T T P , dGTP AND dATP
TERMINATION OF DNA REPLICATION
PHOSPHORYLATION OF HISTONE f L
I
sINITIATION OF HISTONE SYNTHESIS INITIATION OF DNA REPLICATION
PHOSPHORYLATION OF
rH I S T O N E S f lM8 f 3
DEPHOSPHORYLATION OF HISTONES f l f i f \t
M M
CHROMOSOME DECONDENSATION
DECREASE IN HEPARIN EXTRACTABILITY
INCREASE IN DEOXYNUCLEOSIDE TRIPHOSPHATE POOLS
1 MICROVILLI T H E PREDOMINANT I C E L L SURFACE FEATURE
INCREASE IN - D N A - L I P O P R O T E I N
COMPLEX FORMATION PHOSPHORYLATION
"OF HISTONE f L
Gi
I MIXTURE OF MICROVILLI 8 1 BLEBS ON T H E CELL SURFACE
FIGURE 7 Temporal sequence of biochemical events in the CHO cell cycle.
VII. IMPLICATIONS
In 1963, Mazia (1963) speculated that the condensation of chromosomes observed during mitosis represented only a small, readily visible portion of a dynamic "chromosome cycle" which ex- tended throughout both interphase and mitosis. Recent studies utilizing chemical probes such as actinomycin and deoxyribonu- clease (Pederson, 1972; Pederson and Robbins, 1972), sarcosyl- M g+ + crystals (Hildebrand and Tobey, 1973; Yamada and Hanoaka, 1973), heparin (Hildebrand and Tobey, 1975; Hildebrand et al«, 1975), and ethidium bromide (Nicolini et al.r 1975) all tend to support the concept of a nonstatic structure of chromatin which
a mechanism for altering chromatin structure comes from the stud- ies of Louie and Dixon (1973) who correlated specific histone modifications with chromatin structural changes during spermato- genesis in trout. Also, the model studies of Adler et al. (1971, 1972) support this concept by demonstrating that specific multiple phosphorylations of fl alter the ability of fl to change the con- formation of DNA.
Our findings agree with this concept by demonstrating that changes in chromatin structure occur during interphase and mitosis and that, coincident with these changes, histones are phosphory- lated in a highly ordered manner, exhibiting cell-cycle specific- ity for both the amino acid residues and the sites phosphorylated.
Similar correlations have been made in studies by Marks et al.
(1973) and by Bradbury and his associates (1973, 1974) regarding histone fl phosphorylation and changes in chromatin structure.
In view of these studies and our own investigations, we consider the orderly progression of specific histone modifications to play an essential role in the structure and function of chromatin as cells progress through the proliferation cycle.
REFERENCES
Adler, A. J., Schaffhausen, Β., Langan, Τ. Α., Fasman, G. D., (1971), Biochemistry 10, 909-913.
Adler, A, J., Langan, Τ. A., Fasman, G. D., (1972), Arch. Biochem.
Biophys. 153, 7 6 9 - 7 7 7 .
Allfrey, V . G., (1971), in "Histones and Nucleohistones," (D. M.
Phillips, e d . ) , pp. 241-294, Plenum Publishing Co., New York.
Arnold, Ε. Α., Yawn, D, Η., Brown, D. G., Wyllie, R. C., Coffey, D. S., (1972), J. Cell Biol. 53, 737-757.
Baserga, R., (1968), Cell Tissue Kinet. 1, 167-191.
Bradbury, Ε. Μ., Crane-Robinson, C., (1971), in "Histones and Nucleohistones," (D. M. Phillips, e d . ) , pp. 85-134, Plenum Publishing Co., New York.
Bradbury, Ε. Μ., Carpenter, B. G., Rattle, H. W. Ε., (1973), Nature 241, 123-126.
Bradbury, Ε. M., Inglis, R. J., Matthews, H. R., (1974), Nature 247, 257-261.
Bustin, M., Cole, R. D., (1969), J. Biol. Chem. 244, 5291-5294.
Bustin, M., Rail, S. C., Stellwagen, R. H., Cole, R. D., (1969), Science 163, 391-393.
Engelberg, J., (1964), Exp. Cell Res. 36, 647-662.
Gurley, L. R., Walters, R. Α., Tobey, R. Α., (1973a), Arch. Bio- chem. Biophys. 154, 212-218.
Gurley, L. R., Walters, R. Α., Tobey, R. Α., (1973b), Biochem.
Biophys. Res. Commun. 50, 744-750.
Gurley, L. R., Walters, R. Α., Tobey, R. Α., (1974a), J. Cell Biol. 60, 356-364.
Gurley, L. R., Walters, R. Α., Tobey, R. Α., (1974b), Arch. Bio- chem. Biophys. 164, 469-477.
Gurley, L. R., Walters, R. Α., Tobey, R. Α., (1975), J. Biol.
Chem. 250, 3936-3944.
Hildebrand, C. Ε., Tobey, R. Α., (1973), Biochim. Biophys. Acta 331, 165-180.
Hildebrand, C. Ε., Tobey, R. Α., (1975), Biochem. Biophys. Res.
Commun. 63, 134-139.
Hildebrand, C. Ε., Gurley, L. R., Tobey, R. Α., Walters, R. Α., (1975), Federation Proc. 34, 581 (Abstract #2049).
Nicolini, C., Ajiro, Κ., Borun, T. W., Baserga, R., (1975), J.
Biol. Chem. 250, 3381-3385.
Pederson, T., (1972), Proc. Natl. Acad. Sei. U.S.A. 69, 2224-2228.
Pederson, T., Robbins, Ε., (1972), J. Cell Biol. 55, 322-327.
Petersen, D. F., Tobey, R. Α., Anderson, E. C., (1969), Federa- tion Proc. 28, 1771-1778.
Tobey, R. Α., (1973), in "Methods in Cell Biology," (D. M. Pres- cott, e d . ) . Vol. VI, pp. 67-112, Academic Press, New York.
Tobey, R. Α., Crissman, Η. Α., (1972a), Exp. Cell Res. 75, 460- 464.
Tobey, R. Α., Crissman, Η. Α., (1972b), Cancer Res. 32, 2726-2732.
Tobey, R. Α., Ley, K. D., (1971), Cancer Res. 31, 46-51.
Tobey, R. Α., Anderson, E. C., Petersen, D. F., (1967), J. Cell.
Physiol. 70, 63-68.
Tobey, R. Α., Gurley, L. R., Hildebrand, C. E., Ratliff, R. L., Walters R. A., (1974), in "Control of Proliferation in Animal Cells," (B. Clarkson and R. Baserga, eds.), pp. 668-679, Cold Spring Harbor Press, New York.
Tobey, R. Α., Gurley, L. R., Hildebrand, C. Ε., Kraemer, P. Μ., Ratliff, R. L., Walters, R. Α., (1975), in "Mammalian Cells:
Probes and Problems," (C. R. Richmond, D. F. Petersen, P. F.
Mullaney, Ε. C. Anderson, eds.), pp. 152-167, National Techni- cal Information Service, Springfield, Virginia.
Walters, R. Α., Tobey, R. Α., Ratliff, R. L., (1973), Biochim.
Biophys. Acta 319, 336-347.
Yamada, Μ., Hanoaka, F., (1973), Nature (New Biology) 243, 227- 230.