C H A P T E R 11
EXPERIMENTAL TECHNIQUES FOR RHEOLOGICAL MEASURE- MENTS O N VISCOELASTIC BODIES
John D. Ferry
I. I n t r o d u c t i o n 433 I I . Transient T e c h n i q u e s 435
1. Stress R e l a x a t i o n 435
2. C r e e p 437 I I I . D y n a m i c (Sinusoidal) T e c h n i q u e s 440
1. D i r e c t Measurements of Stress and Strain 443 2. R e s o n a n c e D e v i c e s with A d d e d Inertia 445 3. T r a n s d u c e r Measurements of Stress-Strain R a t i o s 449
4. W a v e P r o p a g a t i o n 453 5. Characteristic I m p e d a n c e Measurements 458
6. R e s o n a n c e V i b r a t i o n s 461 7. C o m p a r i s o n s of D y n a m i c T e c h n i q u e s 462
I V . Other T i m e - D e p e n d e n t T e c h n i q u e s 464 1. M o n o t o n i e Changes of Stress or Strain with T i m e 464
2. Impulse Measurements 464 3. N o n s i n u s o i d a l P e r i o d i c Changes 465
V . High-Stress T e c h n i q u e s 465 1. D y n a m i c Stress Superimposed on H i g h Static Stress 465
2. H i g h D y n a m i c Stress 466 V I . D e r i v e d Calculations 467
1. D i s t r i b u t i o n F u n c t i o n s of R e l a x a t i o n and R e t a r d a t i o n T i m e s 467 2. R e d u c e d Variables for D e s c r i b i n g Effects of T e m p e r a t u r e and C o n c e n t r a -
t i o n 470 N o m e n c l a t u r e 473
I. Introduction
In the rheology of viscoelastic bodies, interest centers primarily on a n o m - alies which depend u p o n time rather than u p o n stress. Indeed, the great majority of such studies deal with systems which approach linear visco- elastic behavior—i.e., in which the stress-strain ratio, though a function of time, is independent of stress, at least for the l o w stresses t o which these studies are restricted. T h e basic aim of rheological experiments on v i s c o - elastic bodies is, therefore, the measurement of stress-strain ratios under some kind of time-dependent loading pattern.
In principle, for a linear viscoelastic b o d y , the same information can b e derived from any time-dependent loading pattern—transient experiments
433
such as stress relaxation or creep; d y n a m i c experiments in which stress and strain vary sinusoidally with time, at different frequencies; or m o r e complicated experiments in which either stress or strain is increased linearly with time, or a nonsinusoidal periodic stress is imposed. Equations are avail- able for translating the results of one t y p e of experiment into those of an- o t h e r ,1 -5 though some of the transformations are so complicated as t o b e scarcely practical. In practice, transient and sinusoidal m e t h o d s are the most useful.
In studying stress relaxation, a strain is suddenly imposed and then held constant, while the stress required t o maintain it is measured as a function of time. I n studying creep, a constant stress is applied and the strain is measured as a function of time. T h e s e transient m e t h o d s are o b v i o u s l y m o s t appropriate for the long end of the time scale, and they also h a v e the ad- vantages of m u c h simpler apparatus and greater ease of obtaining a w i d e range of time scale. T h e y are treated in Section I I .
I n studying d y n a m i c properties, a stress which varies sinusoidally with time is imposed, and the resulting strain, which also varies sinusoidally but in general is out of phase with the stress, is measured as a function of fre- q u e n c y . In s o m e cases the stress-strain ratios are measured directly without knowledge of the individual magnitude of either. D y n a m i c m e t h o d s p r o - vide twice as m u c h direct experimental information as transients because at each frequency t w o independent measurements can and should b e m a d e . These are usually expressed b y the ratio of the stress c o m p o n e n t in phase with strain t o the strain and the corresponding out-of-phase ratio (the real and imaginary parts of a c o m p l e x m o d u l u s ) , as explained in m o r e detail subsequently. D y n a m i c measurements are o b v i o u s l y m o s t appropriate for the short end of the time scale. T h e y are treated in Section I I I .
T h e results from other types of loading patterns, which are briefly de- scribed in Section I V , are m o r e difficult t o analyze, especially if there is a n y departure f r o m linear viscoelastic behavior. Measurements under non- linear conditions are mentioned in Section V . Certain derived calculations from measurements of viscoelastic properties are described in Section V I .
Of the various transient and d y n a m i c techniques which are described below, some are adapted t o the study of " s o l i d s " and others t o " l i q u i d s . "
Strictly, such a classification is meaningless, since viscoelastic bodies are neither solid nor liquid; b u t for the purposes of this discussion a viscoelastic solid is considered t o b e one w h i c h supports its o w n weight without signifi-
1 T . Alfrey and P . D o t y , J. Appl. Phys. 16, 700 (1945).
2 B . G r o s s , J . Appl. Phys. 18, 212 (1947).
3 B . G r o s s , / . Appl. Phys. 19, 257 (1948).
4 B . Gross and H . Pelzer, J. Appl. Phys. 22, 1035 (1951).
6 R . Sips, Polymer Set. 5, 69 (1950).
E X P E R I M E N T A L T E C H N I Q U E S F O R V I S C O E L A S T I C B O D I E S 435 cant distortion under the experimental conditions, while a viscoelastic liquid flows and must b e confined. T h e magnitudes of the shear stress-strain ratios measured in those bodies called solid m a y range from 104 t o 1 011 d y n e / c m .2; in those called liquid, from 5 t o 1 010 d y n e / c m .2. T h e s e enormous ranges naturally require a wide variety of experimental m e t h o d s . S o m e aspects of experimental techniques for rheology of viscoelastic bodies h a v e been treated in several other review a r t i c l e s .6 - 10
II. Transient Techniques
1. ST R E S S RE L A X A T I O N
In a stress relaxation experiment, the stress is determined as a function of time either after sudden imposition of strain or ( m u c h less c o m m o n l y ) after cessation of steady-state flow, while holding the strain constant. T h e stress m a y d e c a y either t o an equilibrium value or t o zero, depending on the structure of the material. T h e stress is ordinarily measured b y some ele- m e n t of the apparatus w h i c h is strained in series with the sample under in- vestigation. If, per unit force, the deformation of the stress-measuring ele- m e n t is m u c h smaller than that of the sample (as w i t h a strain g a g e1 1) , the relaxation will occur t o a close approximation at constant strain if the over-all deformation is simply maintained constant. Otherwise, and for more accurate measurements, the stress must b e continuously adjusted either manually or automatically t o maintain constant strain of the sample.
Solid samples, in the great m a j o r i t y of cases, are studied in extension, b y stretching strips, fibers, or rings; less often, in unilateral c o m p r e s s i o n .1 1 , 12 Liquid samples h a v e been studied in shear between coaxial c y l i n d e r s .1 3'14 Results from extension (or unilateral compression) are readily intercon- vertible with those of shear w h e n the b u l k m o d u l u s far exceeds the shear modulus, as is the case for liquids and soft solids. T h u s , for a perfect elastic solid, the ratio of stress t o strain is d e n o t e d b y Y o u n g ' s m o d u l u s Ε in ex- tension and b y the shear m o d u l u s ( m o d u l u s of rigidity) G in shear; these moduli are related b y the equation E/G = 3 / ( 1 + G/3K), where Κ is the bulk modulus. W h e n G <£K, the stress-strain ratios differ simply b y a
6 F . R . Eirich, Proc. 1st Intern. Rheol. Congr., Scheveningen p . IV-3. (1949).
7 J. D . Ferry, W . M . Sawyer, and J. N . Ashworth, Polymer Sei. 2 , 593 (1947).
8 R . S. M a r v i n , Ind. Eng. Chem. 44, 696 (1952).
9 J. H . Dillon and S. D . Gehman, India Rubber World 115, 61-8, 76, 217-22 (1946).
1 0 A . J. Staverman and F . Schwarzl, in " D i e P h y s i k der H o c h p o l y m e r e n , " ( H . A . Stuart, ed.) V o l . I V , p p . 80-95. Springer, Berlin, 1956.
1 1 W . S. M a c D o n a l d and A . Ushakoff, / . Colloid Sei. 3 , 135 (1948).
1 2 S. L . D a r t and E . G u t h , Appl. Phys. 17, 314 (1946).
1 3 G . Stainsby and A . G . W a r d , Proc. 1st. Intern. Rheol. Congr., Scheveningen p . 11-108 (1949).
1 4 F . W . Schremp, J. D . Ferry, and W . W . E v a n s , J. Appl. Phys. 22, 711 (1951).
factor of 3, and this is true even for viscoelastic bodies under conditions of stress relaxation where the stresses are changing with time. Systems which c o m p l y with this condition are sometimes (though inaccurately) called in- compressible. H o w e v e r , when G and Κ are of the same order of magnitude, as in hard solids, stress relaxation in shear cannot b e related t o that in ex- tension w i t h o u t knowledge of the bulk modulus and the relaxation, if any, of bulk stresses within the experimental time scale.
I n any experimental arrangement, the direct measurements of load and deformation must b e converted t o stress and strain b y consideration of sample g e o m e t r y . A s a first approximation, this is a simple calculation;
b u t end effects, distortions and restraints due t o clamping, and other c o m - plications must b e taken into a c c o u n t t o obtain accurate absolute values.
Often absolute a c c u r a c y is limited b y the analysis of sample g e o m e t r y .6 , 15 Measurement of the load m a y b e accomplished b y a balance, either m o d i - fied from an ordinary analytical b a l a n c e16 or specially c o n s t r u c t e d ;1 7 , 18 b y deflection of light from a mirror m o u n t e d on a torsion wire, which is twisted either directly b y the torsion of the s a m p l e14 or b y another element of l o w compliance deformed in series with the s a m p l e ;19 b y a strain gage m o u n t e d on a l o w compliance é l é m e n t ;1 1»2 0 - 22 or b y a differential transformer which measures the deformation of a low-compliance element such as a stiff ring23 or a pair of bowed strips.24 For automatic recording, the torsion mirror deflection can be photographed, and the output from a strain gage or a differential transformer can be transcribed b y a recording potentiom- eter. Usually the time scale covered is from a few seconds to several hours or days. For a time scale of a few milliseconds to a few seconds, which re- quires a much more elaborate apparatus design,20 oscillographic recording has been employed.
Measurement of the deformation is simple if it is imposed b y extension to a fixed stop at a predetermined position. A dial gage has been used when the strain is rather small.24 In the case of stress relaxation after cessation
of steady-state flow, studied with a coaxial cylinder apparatus,14 it is not the strain but the rate of strain before relaxation that must be obtained; this can be done b y conventional tachometry.
1 5 W . T . Read, J. Appl. Mech. 17, 349 (1950).
1 6 A . M . Sookne and M . Harris, Research Natl. Bur. Standards 19, 535 (1937).
17 R . S. Stein and Α . V . T o b o l s k y , Textile Research J. 18, 302 (1948).
1 8 R . D . Andrews and Α . V . T o b o l s k y , J. Polymer Sei. 7, 221 (1951).
1 9 H . P . Lundgren, A . M . Stein, V . M . K o o r n , and R . A . O'Connell, Phys. &
Colloid Chem. 52, 180 (1948).
2 0 M . T . W a t s o n , W . D . K e n n e d y , and G . M . Armstrong, Phys. Rev. 82, 301 (1951).
2 1 W . J. Thorsen, Textile Research J. 24, 407, 899 (1954).
2 2 H . Hindman and G . S. Burr, Trans. Am. Soc. Mech. Engrs. 71, 789 (1949).
2 3 R . S. Stein and H . Schaevitz, Rev. Sei. Instr. 19, 835 (1948).
2 4 J. R . M c L o u g h l i n , Rev. Sei. Instr. 23, 459 (1952).
E X P E R I M E N T A L T E C H N I Q U E S F O R V I S C O E L A S T I C B O D I E S 437
F I G . 1 . Apparatus for stress relaxation measurements (from reference 1 7 ) . T h e sample is k e p t at constant strain b y adjusting the weight t o maintain the balance arm in equilibrium, as indicated b y electrical c o n t a c t s .
Temperature control is important because in some ranges of temperature and time scale the rate of stress relaxation is exceedingly temperature-sensi- tive. W i t h complicated equipment it is impractical t o control the tempera- ture of the entire a p p a r a t u s ;1 4 , 22 b u t in this case thermal leakage is unavoid- able unless insulating segments are placed in the mechanical system, and it m a y b e impossible t o maintain the sample at temperatures that are v e r y different from r o o m temperature. M o s t often the entire equipment is sur- rounded b y an air t h e r m o s t a t .1 7 , 23 Liquid thermostats are used for fibers which must b e immersed in a liquid of fixed c o m p o s i t i o n t o specify their mechanical b e h a v i o r .1 6 , 19
A n example of stress relaxation equipment for use with soft solids, de- scribed b y T o b o l s k y and collaborators, is shown in Fig. 1. A n example of stress relaxation data is shown in Fig. 2, taken from the w o r k of A n d r e w s and T o b o l s k y1 8 on polyisobutylene. T h e time scale extends over five powers of ten, and, as is customary, is plotted logarithmically.
2 . CR E E P
In a creep experiment, the strain is determined as a function of time after sudden imposition of stress, or (in creep r e c o v e r y ) after removal of stress. T h e strain m a y continue increasing indefinitely or m a y approach a
.001 .01 Ι » 10 100 H O U R S
F I G. 2 . Stress relaxation of p o l y i s o b u t y l e n e at various temperatures as indicated (viscosity-average molecular weight 6,600,000). T h e ordinate is stress d i v i d e d b y strain (multiplied b y a reduction factor 2 9 8 / Γ , where Τ is the absolute temperature;
this does n o t affect the general course of the r e l a x a t i o n ) . ( F r o m reference 18.)
constant value, depending on the structure of the material. T h e principles of such experiments h a v e been discussed at length in a treatise b y Leader- m a n .25 T h e y h a v e been w i d e l y applied t o the s t u d y of metals, and meth- ods for a p p l y i n g large stresses, determining v e r y small strains, and operat- ing o v e r w i d e ranges of temperature h a v e been described in several m o n o g r a p h s .2 6 , 2 7'2 8
A s in stress relaxation, solid samples are usually studied in extension, though occasionally in simple shear,29 torsion (of cylinders or, preferably, t u b e s3 0) , or c o m p r e s s i o n .3 1 - 33 L i q u i d samples are usually studied in shear
2 5 H . Leaderman, " E l a s t i c and Creep Properties of Filamentous Materials and Other H i g h Polymers,'* T e x t i l e F o u n d a t i o n , W a s h i n g t o n , 1943.
2 6 H . J. Tapsell, " C r e e p of Metals/'* Oxford U n i v . Press, N e w Y o r k , 1931.
2 7 A . H . Sully, " M e t a l l i c Creep and C r e e p R e s i s t a n t Alloys,*' B u t t e r w o r t h s , L o n - don, 1949.
2 8 E . G . Stanford, " T h e Creep of Metals and A l l o y s , " T e m p l e Press, L o n d o n , 1949.
2 9 Κ . E . V a n H o l d e and J. W . Williams, J. Polymer Sei. 11, 243 (1953).
3 0 W . Lethersich, J. Sei. Instr. 24, 66 (1947).
3 1 D . T . G r i g g s , J. Geol. 47, 225 (1939).
3 2 G . J. Dienes and H . F . K l e m m , J. Appl. Phys. 6, 458 (1946).
3 3 G . J. D i e n e s , Colloid Sei. 2 , 131 (1947).
E X P E R I M E N T A L T E C H N I Q U E S F O R V I S C O E L A S T I C B O D I E S 439
m m
B
F I G . 3. A p p a r a t u s for measurements of c r e e p in shear, for soft high p o l y m e r s (from reference 2 9 ) . T h e samples, A and A', are c l a m p e d b y blocks Β and B'', their thickness being c o n t r o l l e d b y spacers E. A horizontal force is applied b y the weight Η t o a thin plate F b e t w e e n the samples, and their shear deformation is determined b y measuring the displacement of scale J relative t o a fixed scale K.
between rotating coaxial cylinders or a rotating c o n e and plate.34 3 6>3 6a T h e same problems of sample g e o m e t r y arise in converting load and de- formation t o stress and strain. T h e case of compression is particularly c o m - p l i c a t e d3 2, 3 3' 6 because of changes in shape as the deformation proceeds.
Constant load is usually applied b y weights, acting either d i r e c t l y ,37 over p u l l e y s ,34 or on a balance b e a m .25 Friction must b e taken into a c c o u n t .34 F o r small deformations, or in shear even for larger deformations, constant load assures constant stress. F o r larger deformations in extension, h o w e v e r , the cross-section area changes with time and the load must b e continually adjusted t o maintain constant stress. Such adjustments can b e achieved automatically b y mechanical d e v i c e s3 8 - 40 or, m o r e simply, b y allowing the loading weight, suitably shaped, t o b e lowered into water with increasing d e f o r m a t i o n .4 1 , 42
3 4 J. D . F e r r y and G . S. Parks, Physics 6, 356 (1935).
3 5 H . L e a d e r m a n , R . G . Smith, and R . W . Jones, Polymer Sei. 14, 47 (1954).
3 6 L . J. Hastewell and F . J. U . R i t s o n , / . Sei. Instr. 29, 20 (1952).
3 6a H . M a r k o v i t z , L . J. E l y a s h , F . J. P a d d e n , Jr., and T . W . D e W i t t , Colloid Sei.
10, 165 (1955).
3 7 W . A i k e n , T . Alfrey, A . Janssen, and H . M a r k , J. Polymer Sei. 2, 178 (1947).
3 8 Ε . Ν . d a C . A n d r a d e and B . Chalmers, Proc. Roy. Soc. (London) A138, 348 (1932).
3 9 R . L . P e e k , Jr., / . Rheol. 3, 345 (1932).
4 0 W . L . H o l t , E . O . K n o x , and F . L . R o t h , J. Research Natl. Bur. Standards 41, 95 (1948).
4 1 Ε . N . d a C . A n d r a d e , Proc. Roy. Soc. (London) A84, 1 (1910); A90, 339 (1914).
4 2 C . A . D a h l q u i s t , J. O . H e n d r i c k s , and N . W . T a y l o r , Ind. Eng. Chem. 43, 1404 (1951).
T h e deformation m a y b e measured simply b y a scale or cathetometer t e l e s c o p e ,37 b y a dial g a g e ,32 or, in torsional t y p e s of apparatus, b y deflec- tion of a b e a m of light b y a mirror.35 I t m a y b e recorded b y perforating sparks,42 b y a pen recorder,35 or b y successive photographs of a scale. T h e m e t h o d s of temperature control are similar t o those used in stress relaxa- tion experiments.
Analysis of creep data is m o r e complicated than that of stress relaxation data because of the necessity of separating the elastic and viscous responses, as discussed in Chapter 1 of this v o l u m e .
A n example of apparatus for measurements of creep of soft solids in shear, described b y V a n H o l d e and W i l l i a m s ,29 is shown in F i g . 3. S o m e results on creep of a hard solid—a metallic alloy, at high temperatures—are shown in Fig. 4.
III. D y n a m i c (Sinusoidal) Techniques
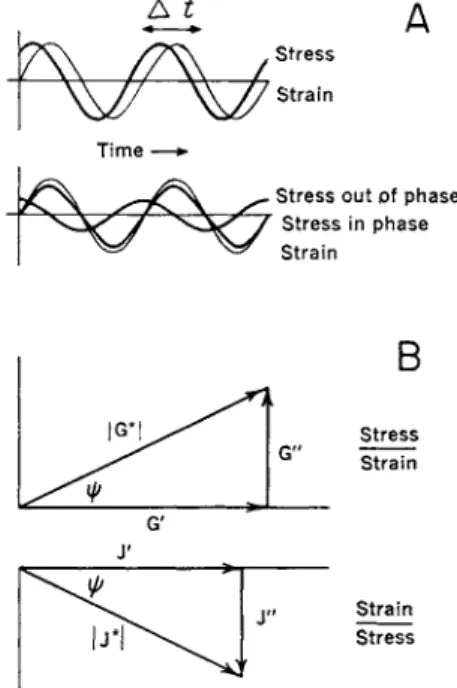
W h e n a linear viscoelastic b o d y is subjected t o a stress varying sinusoi- dally with time, its mechanical behavior at a single frequency must b e spe- cified b y t w o independent quantities. T h e s e m a y b e chosen in various w a y s . F o r example, the stress, which is generally n o t in phase with the strain (Fig. 5 A ) , m a y be separated into t w o c o m p o n e n t s , one in phase and the other 90 deg. out of phase, as illustrated in the figure. F o r deformation in shear, the c o m p o n e n t in phase divided b y the strain is the real part of a complex modulus of rigidity, G' ; the out-of-phase stress c o m p o n e n t divided
E X P E R I M E N T A L T E C H N I Q U E S F O R V I S C O E L A S T I C B O D I E S 441
b y the strain is the imaginary part G". T h e moduli Gf and G" m a y be added vectorially on a complex plane (Fig. 5 B ) t o give G * = G' + iG". T h e absolute modulus is |
G * | = \ Z ( ? '
2 + G "2 ; this is the ratio of peak stress to peak strain. T h e phase angle between strain and stress is ψ (Fig. 5 B ) . The two independent quantities used t o specify the dynamic behavior m a y be chosen as | G * | &ηάψ instead of G' and G". For a single cycle of deforma- tion at a given amplitude, the energy stored and recovered is proportional to G', and the energy dissipated is proportional to G". In extension, the corresponding quantities are E' and E'\ the real and imaginary parts (in- phase and out-of-phase components) of a complex Y o u n g ' s modulus E * .Alternatively, the strain m a y be separated into t w o components, one in phase with and the other 90 deg. out of phase with the stress. These c o m - ponents, each divided b y the stress, give (in shear) the real and imaginary parts of a complex compliance J * = J1 — iJ", which is also symbolized vectorially in Fig. 5 B . It should be emphasized that J'} the in-phase strain/
stress, is not simply the reciprocal of (?', the in-phase stress/strain; actually, J' = G'/(G'2 + G"2), and J" = G"/{G'2 + G"*). T h e phase angle ψ is the same in either case, and At = ψ/w = (tan"1 G"/G')/w.
Β
Stress Strain
Strain Stress
FIG. 5. Sinusoidally varying stress and strain and their in-phase and out-of-phase ratios. A, stress and strain plotted against time; the lower graph shows the stress separated into t w o components, one in phase and one 90 deg. out of phase with the strain. B , real and imaginary components of stress/strain and strain/stress.
Still another alternative, often used for liquids, is t o separate the stress into t w o c o m p o n e n t s , one in phase with and the other 9 0 deg. out of phase with the rate of strain (the latter being, for sinusoidal deformations, 9 0 deg.
out of phase with the strain itself). T h e s e stress c o m p o n e n t s , each divided b y the rate of strain, give the real and imaginary parts of a complex vis- cosity 77* = η — in". A l l these quantities are interrelated b y the follow- ing equations:
G " = ωη'; G' = c o t j " ;
I
G *I =
1/I
J *I = ω h * I ;
tan ψ = G"/G' = J"/J' = η'/η",
where ω is the circular frequency (2πν, if ν is the ordinary f r e q u e n c y ) . If G' and η' are chosen as the t w o independent quantities for characteri- zation, they m a y be visualized in terms of a mechanical model, representing a spring and dashpot in parallel (Voigt element) whose mechanical constants change with frequency. Similarly, a choice of Jf and ω J" m a y b e visualized as the reciprocals of a spring stiffness and dashpot viscosity in a series ar- rangement (Maxwell element), b o t h of which change with frequency. T h e s e visualizations should n o t b e confused, however, with the c o m m o n use of mechanical models whose constants are supposed t o be independent of frequency.
In some d y n a m i c experimental methods, the t w o quantities measured are less obviously related t o the mechanical properties of the material; for example, the velocity and attenuation of a sound w a v e , or a resonance vi- bration frequency and the width of the associated response peak. In all cases, however, there are t w o independent measurements. M o r e o v e r , in all cases the data can be converted t o the complex moduli Gf and G" (or Gr and η', or J' and J") in shear or Ef and E" in extension; so it has be- c o m e customary t o use the complex moduli as a basis for comparing data from diverse sources.
A basic classification of d y n a m i c techniques7 is based on comparing the size of the sample (for extension, length in direction of stretch; for shear, thickness perpendicular t o direction of slide) with the wavelength of elastic waves propagated at the frequency of measurement. Sections 1 t o 3 below treat techniques in which the critical dimension, i, is small c o m p a r e d with the wave-length; i.e., I <<C (G'/p)ll2/v in shear or I « (E'/p)ll2/v in extension, where ν is the frequency. Under these circumstances the inertia of the sam- ple can b e disregarded, though inertia of m o v i n g parts of the apparatus must usually be taken into account. Sections 4 and 5 treat techniques in which the critical dimension, I, is large compared with the wavelength. Under these circumstances, viscoelastic w a v e s are propagated. Finally, Section 6 treats
E X P E R I M E N T A L T E C H N I Q U E S F O R V I S C O E L A S T I C R O D I E S 443 techniques in which I is of the same order of magnitude as the wavelength.
Here resonance vibrations of various m o d e s are excited in the sample.
In m a n y types of apparatus it is necessary t o impose an additional static stress, which m a y or m a y not be in the same direction as the d y n a m i c stresses, t o attach the sample. E v e n if this stress does not relax, it can usually b e k e p t small enough t o a v o i d influencing the d y n a m i c response.
Under high static stresses, h o w e v e r , the time-dependent mechanical proper- ties m a y b e considerably altered, as mentioned in Section V .
1. DI R E C T ME A S U R E M E N T S O F ST R E S S A N D ST R A I N
W h e n the sample size, consistency, and frequency are such that inertia can b e neglected, following the criterion given a b o v e , the simplest w a y t o determine the in-phase and out-of-phase elastic responses is t o measure b o t h stress and strain as functions of time in sinusoidal deformations (Fig.
5 A ) . Such measurments can b e m a d e b y direct mechanical means if the sam- ple is strained in series with a stress-sensing element—a spring of some kind.
If the spring is stiff c o m p a r e d with the sample, a prescribed sinusoidally varying strain can b e applied t o the pair, which will be practically equal t o the strain of the sample ; the spring deflections are then proportional t o the stress. Alternatively, if the sample is stiff c o m p a r e d with the spring, a prescribed sinusoidally varying strain applied t o the pair is almost equal t o the strain of the spring and is therefore proportional t o the stress on the sample; the strain of the sample can be measured separately.
A straightforward example of the recording of t w o sine graphs of stress and strain against time is that of the apparatus of Lethersich,43 in which a tube of a moderately hard solid is subjected t o oscillating torsional deforma- tion through a small angle and the stress and strain are proportional t o de- flections of t w o light beams from mirrors. In the so-called autographic devices, the imposed strain and spring displacement trace graphical records, often at right angles t o form a stress-strain ellipse, usually for deformation of soft solids in c o m p r e s s i o n .4 4 , 45 In the popular apparatus of R o e l i g ,46 which also deforms in compression, the ellipse is traced b y a b e a m of light reflected from mirrors which are rotated at right angles. In the elegant apparatus of Philippoff for deformation of soft solids in shear,47 the t w o dis- placements proportional t o stress and strain are recorded b y differential transformers whose outputs, suitably amplified, are applied t o the hori- zontal and vertical plates of a cathode-ray oscilloscope; again an ellipse is
4 3 W . Lethersich, J. Sei. Instr. 27, 303 (1950).
4 4 D . M . D a v i e s , Brit. J. Appl. Phys. 3, 285 (1952).
4 5 L . M u l l i n s , Trans. Inst. Rubber Ind. 26, 27 (1950).
4 6 H . R o e l i g , Proc. Rubber Technol. Conf. p p . 821-829 (1938).
4 7 W . J. Philippoff, J. Appl. Phys. 24, 685 (1953) ; 25, 1102 (1954).
traced, and may be photographed. This device provides a very wide range of frequencies, from 10~5 to 10 c.p.s. In any of these methods, the t w o com- ponents of the complex elastic modulus can be calculated from the ellipse geometry. It should be remarked that ellipse geometry, never highly pre- cise, becomes quite inadequate for phase angles near 0 deg. or near 90 deg., and under such conditions some artificial phase shift must be introduced.
In an ingenious d e v i c e4 7a ·4 7b for hard solids, one end of a horizontal rod is clamped and rotated while a weight on the other end produces a flexural deformation. T h e weighted end undergoes both a vertical and a horizontal displacement which are related t o the in-phase and out-of-phase elastic responses.
In other types of apparatus, a prescribed strain is imposed b y a mechani- cal drive and the stress is recorded b y indirect means such as deflection of a beam of light, as in the device of Müller48 which deforms a strip in flexure.
In the shear apparatus used b y Blizard,49 the stress is prescribed b y an elec- tromagnetic drive and the strain is measured b y displacement of one plate of an electrical condenser.
It is easier, of course, t o measure only the peak stress and strain, instead of following their periodic changes in detail; this can be accomplished b y noting the width of a spot of light produced b y oscillatory motion of a narrow b e a m ,50 or the peak voltage generated b y a coil moving in a mag- netic field. T h e ratio of the t w o maxima gives the absolute value of the elastic modulus—in the case of shear, | G * | = ( G '2 + G, / 2)1 / 2— a n d some devices provide only this absolute m o d u l u s .5 0 , 51 T h e individual components G' and G", representing energy storage and energy loss, can be determined only if the phase angle, ψ, between the t w o m a x i m a is also k n o w n . In this case, as illustrated in Fig. 55,
G' = | G *
I
c o s ψ; G" =I
G *I
sin φ (1) A n example of a m e t h o d in w h i c h a phase angle is measured is the elaborateapparatus of M a r k o v i t z , D e W i t t , and a s s o c i a t e s ,5 2 , 53 in which a liquid sam- ple is sheared between t w o coaxial cylinders. T h e outer cylinder is rotated
4 7a B . J. Lazan, Trans. Am. Soc. Metals 4, 499 (1950).
4 7b B . Maxwell, Polymer Sei. 20, 551 (1956).
4 8 F . Η . Müller, Z. Elektrochem. 54, 204 (1950).
4 9 R . B . Blizard, J. Appl. Phys. 22, 730 (1951).
5 0 A . P . Aleksandrov and Y . S. Lazurkin, J. Tech. Phys. (USSR) 9, 1249-60, 1261- 66, 1267-79 (1939).
5 1 It has sometimes been erroneously stated that observation of such maxima provides G'.
5 2 H . Markovitz, P. M . Yavorsky, R . C . Harper, Jr., L. J. Zapas, and T . W . D e - Witt, Rev. Sei. Instr. 23, 430 (1952).
5 3 H . Markovitz, J. Appl. Phys. 23, 1070 (1952).
E X P E R I M E N T A L T E C H N I Q U E S F O R V I S C O E L A S T I C B O D I E S 445
r i ^
s l Ρ—^{ !
(â) (D
l
" ' 1
ί α
1
j
F I G . 6. A p p a r a t u s for measuring sinusoidally v a r y i n g stress and strain in v i s c o - elastic liquids (from reference 5 2 ) . T h e liquid is sheared b e t w e e n the t w o cylinders Β and C. T h e angular oscillations of the cylinders are measured b y alternating cur- rents generated in coils A and D.
through a small angle varying sinusoidally with time, and the coaxial inner cylinder is freely suspended from a torsion wire (Fig. 6 ) . F r o m the ratio of the peak amplitudes of rotation of the t w o cylinders and the phase angle between them, determined f r o m voltages generated b y attached coils located in magnetic fields, the individual c o m p o n e n t s G' and G" can b e calculated. It is necessary also t o k n o w the m o m e n t of inertia of the inner cylinder and the torsional stiffness of the wire; the details of the calcula- tions are t o o complicated t o b e given here.
2 . RE S O N A N C E DE V I C E S W I T H AD D E D IN E R T I A
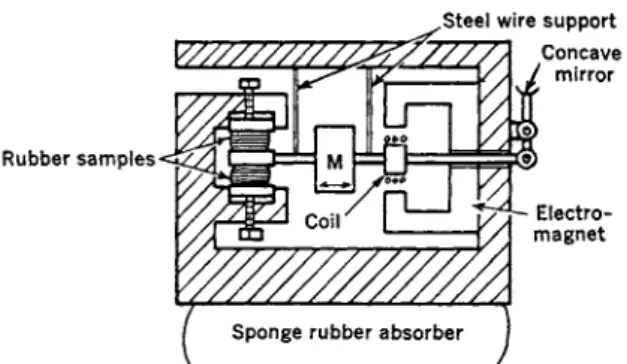
W h e n the applied sinusoidally varying force n o t only deforms the sample under investigation but also simultaneously oscillates a mass M, whose inertia is deliberately chosen t o b e large c o m p a r e d with that of the sample itself, there are simple relations at the frequency of mechanical resonance from which the d y n a m i c mechanical properties can b e calculated. T h i s t y p e of experiment usually i n v o l v e s less c o m p l i c a t e d apparatus than those of the preceding section, b u t at the sacrifice of a continuously variable fre- q u e n c y range; the measurement can be m a d e o n l y at the resonant fre- quency, whatever it happens t o be, and this can be altered only b y adjusting the added inertia or, t o a limited extent, the sample g e o m e t r y . A n example of such an apparatus for deformation in shear is s h o w n in Fig. 7.
V///////////^F7777/
Rubber samples
FIG. 7. Apparatus for measuring complex shear modulus at a resonance frequency determined b y apparatus inertia (from reference 9 ) .
ZM — - — V
If the oscillating motion is linear (the sample being strained in compres- sion, shear, flexure, etc.) the driving force m a y be represented as complex (f ), with a real part in phase with the rate of displacement (v) and an imaginary part in quadrature ; it is convenient to define a mechanical impedance,
RM + iXM = ^ - +
ÎLM
- - ^L.) (2)ω \ ω ω /
where R M and X M are the mechanical resistance and reactance, M is the moving mass, and SM° is the elastance, if any, associated with the appara- tus independently of the sample. (The mechanical resistance and reactance are the in-phase and out-of-phase ratios, respectively, of driving force to velocity, while the elastance of a spring is the ratio of force to elastic dis- placement) . T h e constant a, which has the dimensions of length, depends on sample geometry. It should be remarked that the geometry m a y involve unexpected complications, especially if there is bulging as shown in Fig. 7;
cf. Section 1 above. T h e coefficients G' and G" are the moduli which would be measured in shear, as in Fig. 7; in compression, extension, or flexure they would be replaced b y E' and E". If the oscillating motion is angular rather than linear, an equation similar to (2) can be written with f, v, and M replaced b y torque, angular velocity, and moment of inertia, respectively.
At constant peak force, \f | , either M or ω is adjusted until either maxi- m u m velocity, | ν | , or amplitude, | χ \, is observed; the difference between these two maxima will be small if RM ωϋί, as is usually the case. Subject to the latter restriction, at the observed resonance,
G' =
andG" =
a χ (3)so the resonance frequency specifies the in-phase and the absolute magni- tude of the peak response specifies the out-of-phase modulus. A n alternative
E X P E R I M E N T A L T E C H N I Q U E S F O R V I S C O E L A S T I C B O D I E S 447 way of obtaining G " is t o measure the response | χ | at various frequencies near resonance and n o t e the half w i d t h , Δ ω , of the response curve cor- responding t o the difference between the frequencies at which the response is half its m a x i m u m value. T h e n , if the curve is fairly sharp,
G" - W s ) ( 4
In this case neither | /1 nor | χ | requires an absolute calibration, b u t the measurements are m o r e laborious because a response curve m u s t b e c o n - structed at each frequency.
T h e frequency can be specified b y a mechanical d r i v e ,54 measured b y t a c h o m e t r y (in the case of a rotating c a m d r i v e ) , or, when the drive is elec- trical, read from an oscillator setting. I n the popular electromagnetic t y p e of d r i v e55 58 the p e a k force | /1 is measured b y the current drawn. T h e p e a k displacement | χ | m a y b e measured directly with a traveling m i c r o s c o p e taken from the w i d t h of a spot of light reflected b y a mirror, or determined b y c o n t a c t of the m o v i n g system with an adjustable micrometer s c r e w .55 T h i s t y p e of resonance m e t h o d has been applied t o soft solids in the l o w audio frequency region, strained in alternate extension and compres- s i o n5 4, 5 6'5 7 or in s h e a r .5 8 , 59 I t w a s also used for liquids in the classical ap- paratus of Philippoff,55 where the sample was strained in shear (with rather complicated h y d r o d y n a m i c s ) . U s u a l l y5 6 - 59 the m o v i n g parts are lightly hung from wires or leaf springs so that SM° is small c o m p a r e d with aGf and the elastic stiffness is dominated b y the sample. Otherwise55 it m a y be impossible t o calculate G', and o n l y the out-of-phase modulus can b e obtained.
L i q u i d samples m a y also b e studied b y shear between coaxial cylin- d e r s ;6 0, 61 the physical arrangements are similar t o those of the apparatus of M a r k o v i t z and D e W i t t ,52 but measurements are restricted t o the resonance frequency of torsional oscillations. F r o m the resonance frequency, the peak angular displacements of the t w o cylinders, and the torsional stiffness of the suspension of the inner cylinder, the t w o c o m p o n e n t s G1 and G " can be calculated. I n one m o d i f i c a t i o n61 the inner cylinder is suspended with negligible torsional stiffness.
5 4 C . W . K o s t e n and C . Zwikker, Physica 4, 221 (1937).
5 5 W . Philippoff, Physik. Ζ. 35, 884 (1934).
5 6 W . J. S. N a u n t o n and J. R . S. Waring, Trans. Inst. Rubber Ind. 14, 340 (1939).
5 7 S. D . Gehman, D . E . W o o d f o r d , and R . B . Stambaugh, Ind. Eng. Chem. 33, 1032 (1941).
5* J. H . D i l l o n , I. B . P r e t t y m a n , and G . L . Hall, J. Appl. Phys. 15, 309 (1944).
5 9 R . S. E n a b n i t and S. D . Gehman, Ind. Eng. Chem. 43, 346 (1951).
6 0 H . G o l d b e r g and O . Sandvik, Ind. Eng. Chem. Anal. Ed. 19, 123 (1947).
6 1 J. R . V a n Wazer and H . G o l d b e r g , / . Appl. Phys. 18, 207 (1947).
8. Exponentially d a m p e d sinusoidal free torsional vibration, traced against time (from reference 4 3 ) .
W h e n the elastic stiffness of the m o v i n g system is dominated b y the sample, resonance appears o n l y if the loss tangent G" IG' (or E"/E') is moderately small, and this imposes a restriction on the types of materials that can b e studied. Alternatively, the elastic stiffness can b e deliberately dominated b y the apparatus itself. In this case, G' is derived n o t from the absolute resonance frequency b u t from the difference between resonance frequencies with and without attachment of the sample. E x a m p l e s of this t y p e of resonance m e t h o d are the tuning fork apparatus of R o r d e n and G r i e c o62 for soft solids in shear at audio frequencies, also modified b y H o p k i n s6 3, 64 for liquids of fairly high viscosity, and the magnetostrictive rod device of N o l l e65 for solids in compression in the high kilocycle fre- q u e n c y range. A piezoelectric device has also been described for the high kilocycle r a n g e .66
All of the a b o v e resonance m e t h o d s are " f o r c e d " in the sense that a continuous oscillating force is applied during the measurements. Closely related are the " f r e e " resonance vibration m e t h o d s in w h i c h the m o v i n g system is displaced from equilibrium and then allowed t o oscillate freely.
F o r the same schematic arrangement as in Fig. 7, with a small initial displacement, the amplitude is an exponentially d a m p e d sinusoidal func- tion of the time. F r o m a trace of this function, or simply from observation of successive peak displacements, the logarithmic decrement Δ is obtained as the natural logarithm of the ratio of t w o successive displacements. Such a trace for free torsional vibrations is illustrated in Fig. 8. T h e in-phase modulus G' (or Ef) is related t o the resonance frequency t o a close approxi- mation as in equations ( 3 ) , and the out-of-phase m o d u l u s is calculated
6 2 H . C . R o r d e n and A . Grieco, J. Appl. Phys. 22, 842 (1951).
6 31 . L . H o p k i n s , Trans. Am. Soc. Mech. Engrs. 73, 195 (1951).
6 4 I. L . Hopkins, Appl. Phys. 24, 1300 (1953).
6 6 A . W . Nolle, Appl. Phys. 19, 753 (1948).
6 6 M . O . Kornfeld, Exptl. Theoret. Phys. (USSR) 13, 116 (1943).
E X P E R I M E N T A L T E C H N I Q U E S F O R V I S C O E L A S T I C B O D I E S 449
\
I
F I G . 9 . A p p a r a t u s for measuring d a m p e d free torsional v i b r a t i o n s (from reference 7 0 ) . T h e sample C is s u b j e c t e d t o torsional oscillations when the m o m e n t of inertia disc Β is turned t h r o u g h a small angle and released. T h e p e r i o d i c torques exerted on the lower sample c l a m p D are r e c o r d e d b y the differential transformer K} whose core J m o v e s t h r o u g h a v e r y small amplitude constrained b y the spring rods G.
from the relation
G"/G' (or Ε"/Ε') = Δ / τ τ ( 5 ) F o r a given experimental arrangement it m a y b e simpler t o calibrate b y sub-
stituting a spring for the sample than t o a t t e m p t t o determine the effective mass M from g e o m e t r y .
In the free vibration devices of Y e r z l e y67 and N o l l e ,65 soft solids are deformed in extension. T h e r e are m a n y examples of oscillating torsion balances for deformation of cylindrical or prismatic samples in torsion (shear) j6 8 - 7 0 8"4 3 one is shown in Fig. 9. Here m o m e n t of inertia and angular displacement are i n v o l v e d rather than mass and linear displace- ment. T h e m o t i o n m a y be followed b y a direct t r a c e ,67 microscopic o b - s e r v a t i o n ,65 a differential transformer,70 or displacement of a reflected b e a m of light. T h e general frequency range of such devices is from 0.1 t o 10 c.p.s.
3 . TR A N S D U C E R ME A S U R E M E N T S O F ST R E S S -ST R A I N RA T I O S
A n electromechanical transducer is a device for converting electrical into mechanical energy or v i c e versa, and in this sense some of the methods de-
6 7 F . L . Y e r z l e y , Ind. Eng. Chem. Anal. Ed. 9, 3 9 2 ( 1 9 3 7 ) .
6 8 M . M o o n e y and R . H . G e r k e , India Rubber World 103, N o . 4 , 2 9 ( 1 9 4 1 ) .
6 9 W . K u h n and O . Künzle, Helv. Chim. Acta 30, 8 3 9 ( 1 9 4 7 ) .
7 0 L . E . Nielsen, Rev. Sei. Instr. 22, 6 9 0 ( 1 9 5 1 ) .
7 0a J. Koppelmann, Kolloid-Z. 144, 1 2 ( 1 9 5 5 ) .
scribed a b o v e with electromagnetic d r i v e s56 or electromagnetic52 or electro- s t a t i c65 pickups for detection of amplitude possess transducer elements.
H o w e v e r , electromechanical converters can be utilized in a far m o r e power- ful w a y so that ratios of electrical voltage t o current are measured in place of mechanical ratios of stress t o strain. T h u s the actual measurements are of electrical resistance and capacity, which can easily b e m a d e with high precision. It is this t y p e of apparatus which will b e designated as a trans- ducer, in a more restricted sense, in the present discussion. I t has the ad- vantage, shared b y none of the other methods, that neither stress nor strain need be measured directly, and displacements can be kept exceedingly small; it also has the advantage, shared b y the direct stress-strain devices of Section 1, that the frequency can b e continuously varied. I n the m e t h o d s described in this section, as in b o t h the preceding sections, the sample de- formed is thin c ompa red with the wavelength of elastic waves, and the effect of its inertia can b e neglected, or at least reduced t o a small correction.
T h e experimental arrangement shown in Fig. 7 could b e used as an elec- tromagnetic transducer, preferably w i t h o u t the added mass. A current i passed through the coil will cause a force f t o b e exerted on the m o v i n g sys- tem, given b y f = Bli, where Β is the magnetic flux density and I the length of wire in the coil. T h e system will oscillate with a v e l o c i t y υ = f/ZM , where, as in equation ( 2 ) , ν is taken in phase with the real part of f and therefore written as real. T h e m o v i n g coil will generate a b a c k e.m.f.
given b y e = Blv. T h e applied e.m.f. is Z0i where Z0 is the electrical im- pedance of the coil at rest; the total e.m.f. is Z0i + e = Z i , where Ζ is the electrical impedance of the coil while in m o t i o n . T h u s
( Z - Z0) i = Blv = (Bl)2i/ZM (6)
T h i s is the fundamental equation of an electromagnetic transducer,71 which makes it possible t o calculate a mechanical impedance from the differ- ence between t w o electrical impedances. Separation into real and imaginary parts gives the following expressions for mechanical resistance and reac- tance:
τ ) _ (Bl)2(R — Rp) 7 s (
Km - KR - Ä . ) » + ( X - X o )2] ( ' Y = —{Bïf{X — XQ)
* M [{R — RoY + (X - Xo)2} U ;
Here R and R{) are the electrical resistances of the coil in motion and at rest, and X and X0 are the corresponding electrical reactances. If the coil is
7 1 W . P. Mason, "Electromechanical Transducers and W a v e Filters," Van N o s - trand, N e w Y o r k , 1942.
E X P E R I M E N T A L T E C H N I Q U E S F O R V I S C O E L A S T I C B O D I E S 451 placed in one arm of an i m p e d a n c e bridge, 2 these electrical quantities can be measured with high precision. T h e m o d u l i G' and G" can then b e o b - tained from RM and XM as indicated in equation ( 2 ) .
T h e characteristic feature of this t y p e of m e t h o d is that c o m p l e x stress- strain ratios are measured in terms of c o m p l e x voltage-current ratios, and neither stress, strain, voltage, nor current need be measured directly. If the deformations are small enough so that linear viscoelastic behavior holds, the electrical impedance is found t o b e independent of the driving current.
Strains as small as 1 0- 6 m a y b e e m p l o y e d .
T h e electrical measurements of RQ and X0 must b e m a d e with the m o v i n g system tightly clamped t o prevent the current from evoking m o t i o n . In practice, it m a y b e difficult or impossible t o m a k e such clamping absolute.
T h e r e are, therefore, modifications of the transducer m e t h o d in which t w o or more sets of electrical measurements are repeated at the same frequency in such a w a y that R0 and X0 cancel o u t or can b e determined b y solving simultaneous equations. F o r example, the mechanical impedance can b e modified b y attaching added masses; it is unnecessary t o k n o w their mag- nitude if three or m o r e different values are u s e d .72
In the t w i n7 3, 74 and d o u b l e75 transducers, t w o coils oscillate in separate magnetic fields, b o t h rigidly attached t o the m o v i n g system which deforms the material investigated. One coil m a y b e used as a driver and the other as a d e t e c t o r ,73 in which case potentiometer measurements can b e used t o find the relations between driving current and generated v o l t a g e with respect t o amplitude and phase. Determination of the phase requires s o m e tedious adjustments, however. Alternatively, driving current can b e sent through b o t h coils and the i m p e d a n c e of one coil measured for t w o dif- ferent ratios of the t w o driving currents.75 T h i s permits rapid and accurate determination of ZM without knowledge of Z0 ; the calculations are m o r e c o m p l i c a t e d than equation (6) but are based on the same relationships.
T h e transducer m e t h o d s h a v e been applied t o liquids in a limited fre- q u e n c y and temperature r a n g e72 and t o solids in the range from soft gels t o rather hard glasses.75 In the apparatus of Fitzgerald and F e r r y ,75 shown in F i g . 10, a pair of disc-shaped samples is sheared between a tube carrying the driving coils and a freely suspended h e a v y mass. T h e slight m o t i o n of the latter must b e taken into a c c o u n t in calculating ZM for the samples.
T h e frequency range is from 20 t o 5000 c.p.s. and the temperature can b e accurately controlled from —50 t o + 1 5 0 ° C . A n example of results76 o b -
7 2 T . L . Smith, J. D . Ferry, and F . W . S c h r e m p , J. Appl. Phys. 20, 144 (1949).
7 3 R . S. M a r v i n , E . R . Fitzgerald, and J. D . Ferry, J. Appl. Phys. 21, 197 (1950).
7 4 R . S. M a r v i n and F . Weiss, unpublished experiments.
7 5 E . R . Fitzgerald and J. D . Ferry, J. Colloid Sei. 8, 1 (1953).
7 6 Ε . R . Fitzgerald, L . D . G r a n d i n e , Jr., and J. D . F e r r y , Appl. Phys. 24, 650 (1953).
T T à-ζ.
INDUCT Awe ε TEST COIL 26
OPIV/NG COIL /a SHIELDING COIL I&
TT&-1
JmwurßOLr Oner 3mm.) TT2.-4-
COLLAR POA. MAHNET
TT2S
RlMtNAANET (ALM/COZ)
77Z-6
/nvcrtco Pole Piece
OVER PLATE
ΤΓ4-Ρ
Okiv/mg Tube TT&tt
FLOATING MASS MASS BEAA\/MSS
. ΓΓά-tà
Ρ ε MOVABLE PLATE SAMPLE CTL/NOER
TT£-/S
CYLINDER SPRING
(NOT SHOWN)
TTâ-l& Front End Plate Support 3olt Cover
y / J " — - |
F I G. 10. D o u b l e transducer for measuring complex shear modulus at audio fre- quencies. T w o disc-shaped samples are sheared between flat areas on the thin driving tube (TT2-9) and the flat ends of cylinders mounted in the floating mass (TT2-11).
B o t h m o v i n g parts are suspended from fine wires and essentially isolated from the b o d y of the apparatus. T h e driving tube is oscillated with a very small amplitude along its axis b y passing alternating currents through the driving coils (TT2-20, 22).
Electrical impedance measurements are made on coil TT2-20, after balancing out mutual inductance with coils TT2-21, 23. T h e entire apparatus is sealed for immersion in a liquid thermostat. (From reference 75.)
tained with this transducer is shown in Fig. 11, where the real part of the complex compliance is plotted against the frequency (with logarithmic scales) at numerous temperatures, for a sample of polyisobutylene.
Transducer methods m a y also be a p p l i e d7 6a ·7 6b t o measurements of the complex bulk modulus K * , whose real part is the reciprocal of the c o m - pressibility.
T h e inertia of the sample is almost always neglected in the methods de- scribed in Sections 1 t o 3 a b o v e . W h e n it is large enough t o influence the mechanical impedance slightly—when the sample thickness is of the order of a tenth of the wavelength of elastic waves—it m a y b e taken into a c c o u n t
73 in an approximate correction.
7 6» W. Philippoff and J. Brodnyan, J. Appl. Phys. 26, 846 (1955).
7 6b J. E . M c K i n n e y , S. Edelman, and R . S. Marvin, J. Appl. Phys. 27, 425 (1956).
E X P E R I M E N T A L T E C H N I Q U E S F O R V I S C O E L A S T I C B O D I E S 453
I ι ι i—l
to too tooo t0.000
FfiCQUENCr -CPS- (LOGARtTHM/C)
F I G . 11. R e a l part of c o m p l e x shear c o m p l i a n c e of p o l y i s o b u t y l e n e (J' = G' / (G'2 + G"2)) measured b y double transducer at 22 temperatures. (Viscosity-average molecular weight 1,350,000; from reference 76.)
4. WA V E PR O P A G A T I O N
W h e n the critical dimension of the sample is large c o m p a r e d with the wavelength of elastic waves propagated at the frequency of measurement, the inertia of the sample itself cannot b e neglected, and because of the presence of elastic w a v e s there is n o simple relation between applied load and observed displacement such as described in the preceding three sections. H o w e v e r , the mechanical characteristics of t h e sample can b e derived from observations of these w a v e s — f r o m their v e l o c i t y and at- tenuation. T h e v e l o c i t y of waves of distortion depends on the shear m o d u - lus alone, but the v e l o c i t y of waves of dilatation depends on b o t h shear and bulk moduli and also on the g e o m e t r y of the s a m p l e ,77 as discussed below.
Often conditions are chosen so that the w a v e approximates a one-di- mensional disturbance and the attenuation prevents perceptible reflection
7 7 H . K o l s k y , "Stress W a v e s in S o l i d s , " Oxford U n i v . Press, N e w Y o r k , 1953.
to'i 1 . r - i
from the far side of the sample opposite the source. In this case the w a v e is exponentially d a m p e d and m a y b e characterized b y its wavelength, λ, and the critical d a m p i n g distance, x0, within which its amplitude falls off b y a factor of 1/e (Fig. 1 2 ) .7 8' 79 T h e dimensionless ratio X/xo is a convenient index of the severity of d a m p i n g .78
F o r a shear w a v e (pure distortion), the c o m p o n e n t s of the complex m o d u - lus G' and G" are related t o the wavelength and attenuation as follows:
nt ω Υ ρ[ 4 π2 - (\/xo)2] ,s χ
G = [4r> + (X/xoYY m
,, 4ττω2λ2ρ(λ/χ0) / o 7 \
Here ρ is the density of the m e d i u m .
F o r a longitudinal w a v e in a sample of cross-section small c o m p a r e d with the wavelength, i.e., a fiber or thin strip, equations (8) yield the moduli Ef and E" rather than G' and G". F o r a bulk w a v e , a longitudinal w a v e in a sample large c o m p a r e d with the wavelength in all dimensions, the measure- ments are n o t related simply t o either G * or E * .
Shear w a v e measurements have been applied primarily t o liquids and v e r y soft s o l i d s ,7 8 , 8 0'8 1 the disturbance being created b y a plate oscillating in its o w n plane. T h e values of λ and x0 are m o s t conveniently measured b y taking advantage of the strain double refraction p r o d u c e d b y deforma- tion of m a n y viscoelastic systems. If the system is transparent and shows strain double refraction, stroboscopic illumination between crossed pola-
7 8 F . T . Adler, W . M . Sawyer, and J. D . Ferry, Appl. Phys. 20, 1036 (1949).
7 9 R . Sips, Polymer Set. 6, 285 (1951).
8 0 J. D . Ferry, Rev. Sei. Instr. 12, 79 (1941).
8 1 J. N . A s h w o r t h and J. D . Ferry, J. Am. Chem. Soc. 71, 622 (1949).
E X P E R I M E N T A L T E C H N I Q U E S F O R V I S C O E L A S T I C B O D I E S 455 rizers (at the frequency of the w a v e p r o p a g a t i o n ) shows a pattern of alter- nate dark and light bands. T h e axes of the polarizers must be parallel and perpendicular t o the direction of w a v e propagation. T h e transmitted in- tensity is proportional to sinV/2, where φ, the double refraction (phase difference), is in turn proportional t o strain amplitude. F r o m the periodic variations of intensity with distance in the direction of w a v e propagation, therefore, λ and x0 can be obtained. M o r e usually, a double quartz wedge is inserted in the optical path, with its axis inclined at a small angle t o the direction of w a v e propagation; the resulting pattern is a d a m p e d w a v e whose geometry is related t o the shear w a v e itself, and λ and x0 can be de- termined from direct observation or p h o t o g r a p h y of the pattern. A n ex- ample of such a photograph is shown in Fig. 13. T h e propagation of a
F I G . 1 3 . P h o t o g r a p h o f w a v e o f s h e a r - s t r a i n d o u b l e r e f r a c t i o n i n a 2 6 % s o l u t i o n of c e l l u l o s e t r i b u t y r a t e i n 1 , 2 , 3 - t r i c h l o r o p r o p a n e a t 4 0 ° C , f r e q u e n c y 5 0 0 0 c . p . s .
( d a t a o f R . F . L a n d e l ) . T h e d r i v i n g p l a t e , s e e n i n t h e c e n t e r , i s o s c i l l a t e d v e r t i c a l l y i n i t s o w n p l a n e . S h e a r w a v e s p r o p a g a t e d i n b o t h d i r e c t i o n s h o r i z o n t a l l y p r o d u c e p a t - t e r n s o f s t r a i n d o u b l e r e f r a c t i o n ; t h e v e r t i c a l d i s p l a c e m e n t s , p h o t o g r a p h e d h e r e s t r o b o s c o p i c a l l y , a r e p r o p o r t i o n a l t o t h e a r c t a n g e n t s o f t h e r e l a t i v e r e t a r d a t i o n ( p h a s e d i f f e r e n c e ) i n t h e c o m p o n e n t s o f p o l a r i z e d l i g h t p a s s i n g t h r o u g h t h e s t r a i n e d m e d i u m . T h e r e l a t i v e r e t a r d a t i o n i s a s s u m e d t o b e p r o p o r t i o n a l i n t u r n t o t h e s h e a r s t r a i n .
p h o t o e l a s t i c p a t t e r n c a n a l s o b e f o l l o w e d b y h i g h - s p e e d p h o t o g r a p h y .8 2
A n a l t e r n a t i v e m e t h o d f o r f o l l o w i n g s h e a r w a v e p r o p a g a t i o n , w h i c h h a s b e e n s u g g e s t e d7 b u t n o t u t i l i z e d , i s t h e o b s e r v a t i o n of s m a l l p a r t i c l e s i m - m e r s e d i n a t r a n s p a r e n t l i q u i d o r s o f t s o l i d . F r o m p h o t o g r a p h s w i t h a n d w i t h o u t s y n c h r o n i z a t i o n of stroboscopies i l l u m i n a t i o n , t h e w a v e p a r a m e t e r s c o u l d b e d e t e r m i n e d . T h e effects of t h e c o n t a i n e r A v a i l s h a v e b e e n i n v e s t i - g a t e d t h e o r e t i c a l l y ,78 b u t a r e u s u a l l y n o t t a k e n i n t o a c c o u n t .
L o n g i t u d i n a l w a v e s h a v e b e e n f o l l o w e d i n fibers a n d s t r i p s b y e l e c t r o - m a g n e t i c o r p i e z o e l e c t r i c p i c k u p d e v i c e s . 83 -8 4 - 65 *8 5 87 T h e d i s t u r b a n c e i s s e t u p a t o n e e n d , u s u a l l y b y a n e l e c t r o m a g n e t i c d r i v e , a n d t h e p i c k u p i s m o v e d a t a c o n s t a n t r a t e a l o n g t h e s a m p l e . A u t o m a t i c r e c o r d i n g d e v i c e s m a y p r o - v i d e g r a p h s f r o m w h i c h λ a n d Xo c a n b e o b t a i n e d ,6 5 a s i n d i c a t e d s c h e m a t i - c a l l y i n F i g . 14. R e f l e c t a n c e f r o m t h e p i c k u p m u s t b e a v o i d e d ; r e f l e c t a n c e f r o m t h e f a r e n d of t h e s a m p l e m a y b e t a k e n i n t o a c c o u n t ,8 8 t h o u g h u s u a l l y i t i s n o t .8 9 T h e effect of s u p e r i m p o s e d s t a t i c s t r a i n o r e v e n of a c o n - s t a n t r a t e of s t r a i n c a n b e i n v e s t i g a t e d .
F l e x u r a l w a v e s m a y a l s o b e e m p l o y e d . I n a m e t h o d d e v i s e d b y O b e r s t ,8 9a
a m a t e r i a l t o o s o f t o r w i t h t o o m u c h d a m p i n g f o r d i r e c t m e a s u r e m e n t i s l a y e r e d o n a t h i n m e t a l s h e e t ; f r o m t h e v e l o c i t y a n d d a m p i n g of flexural w a v e s i n t h e c o m p o u n d s y s t e m a n d t h e p r o p e r t i e s of t h e m e t a l , t h e c o m - p o n e n t s of E * f o r t h e a p p l i e d l a y e r c a n b e o b t a i n e d .
T h e m o d u l u s E * , m e a s u r e d b y l o n g i t u d i n a l w a v e p r o p a g a t i o n a l o n g a t h i n s a m p l e a s i n F i g . 14, m a y b e t h o u g h t of a s r e p r e s e n t i n g a c o m b i n a t i o n of s h e a r a n d b u l k c o m p r e s s i o n p r o p e r t i e s , s i n c e E * = 3 G * / ( 1 + G * / 3 K * ) , w h e r e K * i s t h e b u l k m o d u l u s ( w h o s e r e a l p a r t i s t h e r e c i p r o c a l of t h e c o m p r e s s i b i l i t y ) . F o r s o f t s o l i d s a t l o w f r e q u e n c i e s , G' « K', a n d t h e s h e a r p r o p e r t i e s of c o u r s e d o m i n a t e t h e b e h a v i o r . H o w e v e r , w h e n l o n g i t u d i n a l w a v e s a r e p r o p a g a t e d i n t o a w i d e s a m p l e ( b u l k w a v e s ) , t h e i r v e l o c i t y a n d a t t e n u a t i o n d e p e n d o n a d i f f e r e n t c o m b i n a t i o n of G * a n d K * ; e q u a t i o n s ( 8 ) , o r t h e i r e q u i v a l e n t , p r o v i d e t h e r e a l a n d i m a g i n a r y p a r t s of a c o m p l e x m o d u l u s K * + ( 4 / 3 ) G * . I n t h i s c a s e , t h e b u l k m o d u l u s d o m i n a t e s t h e b e - h a v i o r , a t l e a s t a s f a r a s t h e r e a l p a r t i s c o n c e r n e d ; f o r s o f t s o l i d s , a g a i n , K' » G'. H o w e v e r , u s u a l l y K" i s m u c h less t h a n G" a n d m a y b e zero w i t h i n e x p e r i m e n t a l e r r o r , s o t h e e n e r g y l o s s i s s t i l l d o m i n a t e d b y t h e s h e a r p r o p e r -
82 1 ) . G . C h r i s t i e , Trans. Soc. Glass Tech. 36, 7 4 ( 1 9 5 2 ) .
83 J . W . B a l l o u a n d S . S i l v e r m a n , Textile Research 14, 2 8 2 ( 1 9 4 4 ) .
84 J . W . B a l l o u a n d S . S i l v e r m a n , / . Acoust. Soc. Amer. 16, 113 ( 1 9 4 4 ) .
8 5 I I . S . W i t t e , Β . A . M r o w e a , a n d Ε . G u t h , J. Appl. Phys. 20, 4 8 1 ( 1 9 4 9 ) .
8 6 J . W . B a l l o u a n d J . C . S m i t h , ,/. Appl. Phys. 20, 4 9 3 ( 1 9 4 9 ) .
87 K . W . H i l l i e r a n d H . K o l s k y , Proc. Phys. Soc. (London) 62, 1 1 1 ( 1 9 4 9 ) .
88 K . W . H i l l i e r , H . K o l s k y , a n d J . P . L e w i s , ,/. Appl. Phys. 20, 2 2 7 ( 1 9 4 9 ) .
89 A . W . N o l l e , J. Appl. Phys. 20, 2 2 7 ( 1 9 4 9 ) .
8 9· ' Η . O b e r s t , Acusiica 4, B e i h e f t 1 , 4 3 3 ( 1 9 5 4 ) .