THE RHEOLOGY O F R A W ELASTOMERS M. Mooney
I . I n t r o d u c t i o n 1 8 1
I I . R h e o l o g i c a l T e s t i n g E q u i p m e n t I8 4
1. R o t a t i o n a l I n s t r u m e n t s 1 8 4 2 . E x t r u s i o n I n s t r u m e n t s 1 8 9 3 . C o m p r e s s i o n I n s t r u m e n t s 1 9 0
I I I . V i s c o m e t r i c T h e o r y 2 1 9
1. R o t a t i o n a l I n s t r u m e n t s 1 9 2 2 . E x t r u s i o n I n s t r u m e n t s 1 9 4 3 . C o m p r e s s i o n I n s t r u m e n t s 1 9 5
I V . E l a s t i c R e c o v e r y 1 9 6
V . Surface S l i p m
V I . E x p e r i m e n t a l R e s u l t s 0 2 0
1. T h e F l u i d i t y o r F l o w C u r v e 0 0 2
2 . T e m p e r a t u r e Effects 1 2 1
3 . C o m p a r i s o n of Different P l a s t o m e t e r s 2 2 i
4. T h i x o t r o p y 3 2 1
5 . E l a s t i c R e c o v e r y *4 2
6 . Surface Slip 7 2 1
7. R h e o l o g i c a l F l o w Units 8 2 1
V I I . T h e o r y o f t h e F l u i d i t y of E l a s t o m e r s 1 9 2
V I I I . P r o c e s s i n g 5 2 2
1 . General R e m a r k s 5 2 2
2 . B r e a k d o w n and M i x i n g 6 2 2
3 . F o r m i n g Operations 7 2 2
N o m e n c l a t u r e 2 2 3
I. Introduction
R a w elastomers, or rubbers, b o t h natural and synthetic, consist basically of long, chainlike p o l y m e r molecules h a v i n g hundreds of m o n o m e r units in a chain. A t r o o m temperature the elastomers are essentially viscoelastic solids.1 TChey are c a p a b l e of large elastic d e f o r m a t i o n and c a p a b l e also of slow c o n t i n u o u s d e f o r m a t i o n under m o d e r a t e stress, t h o u g h the c o n t i n u o u s deformation m a y b e so slow as t o b e u n o b s e r v a b l e b y ordinary means. A t a sufficiently high stress the material breaks or tears. A t higher temperatures,
1 If the s e c o n d - o r d e r transition t e m p e r a t u r e , T3 , of a high p o l y m e r is a b o v e r o o m temperature, t h e p o l y m e r is generally classed as an elastomer, n o t a plastomer, e v e n if it exhibits t y p i c a l elastomeric properties at temperatures a b o v e Ts .
1 8 1
such as 50° C . or more, elastomers are capable of continuous shear at any imposed rate without rupture; or, if rupture occurs, the material is suffi- ciently t a c k y that it will form a single coherent mass w h e n the ruptured pieces are pressed firmly together.
In order t o prevent the flow or permanent deformation of commercial rubber articles it is necessary t o cure the raw elastomer. Curing consists of forming chemical b o n d s , usually of sulfur, between the chain molecules at occasional points, thus forming a three-dimensional tangled n e t w o r k . I n preparation for the curing operation the curative agents, together w i t h powdered fillers and other c o m p o u n d i n g ingredients, must first b e thor- oughly mixed with the raw rubber. T h e raw mixed s t o c k is then p u t through a forming operation, perhaps built into a c o m p o s i t e structure such as a tire or a shoe, and then cured b y heating in a m o l d or, in s o m e cases, in an autoclave.
I n the mixing and forming operations the rheological properties of the raw elastomer are of primary importance and must b e held within estab- lished limits for successful processing. A s suggested b y the opening para- graph, the processing temperature must b e considerably a b o v e r o o m temper- ature; b u t even so, the viscosity of the raw rubber usually must b e reduced b y reducing its molecular weight, or b y "breaking the rubber d o w n . "
T h i s is accomplished b y mechanical mastication, usually assisted b y a limited a m o u n t of oxidation. T h e mastication m a y b e carried out in a Plasticator, which operates on the principle of a m e a t grinder; or in a B a n b u r y , which consists of a pair of h e a v y curved knives rotating in a closed chamber; or on a rubber mill, which consists of a pair of rotating parallel steel rolls with a small clearance, or nip, through which the rubber is passed repeatedly.
After sufficient breakdown, mixing is begun, usually in a B a n b u r y . T h e sulfur is often omitted in the first mixing step, in order t o avoid premature curing at the high temperatures attained in the B a n b u r y . T h e practice with regard t o subsequent mixing operations varies. Remilling one or m o r e times, with further reduction in viscosity, m a y b e necessary t o obtain satisfactory results in the later forming operation. T h e rheological properties are pro- foundly affected also b y the kind and a m o u n t of c o m p o u n d i n g ingredients that are used in the stock—carbon blacks of different kinds, plasticizers, rubber-soluble oils, oxidizing chemicals, pigments, and dozens of different powdered fillers.
F o r m i n g operations are usually carried out with a screw extruder or with a calender. T h e screw extruder, like the Plasticator, operates like a meat grinder except that a forming die is substituted for the chopper. T h e p r o d u c t is extruded as a continuous rod with a cross section corresponding t o the shape of the die. A calender, consisting of three or more parallel steel rolls,
passes the stock in a continuous sheet on successive rolls t o the final nip, whence it is delivered as a formed sheet or pressed into a fabric which is fed continuously with the rubber into the last nip. I n b o t h extruder and calender the s t o c k is subjected t o severe mechanical working before the final forming action occurs. T h e stock is thereby warmed up, its thixotropic structure is broken d o w n , and it is therefore reduced temporarily t o a more plastic condition c o n d u c i v e t o precise forming. E v e n so, allowance must always b e made for some longitudinal shrinkage and lateral expansion re- sulting from the elastic recovery of the stock.
T h e injection processing m e t h o d , which is coming into some use at the present time for solid rubber articles, succeeds in by-passing the forming operation b y injecting under high pressure directly into a closed m o l d .
I t is o b v i o u s l y a difficult p r o b l e m t o maintain adequate processing con- trols when dealing with materials that are highly thixotropic, n o n - N e w - tonian and elastic, undergo changes during processing, and are likely t o cure in the processing equipment if the temperature, increased b y the mechanical w o r k of processing, gets out of control. A s aids in this control work, a large number of rheological tests for raw elastomers have been de- veloped.
Rheological testing equipment, like the processing equipment, is operated at elevated temperatures, usually within the range from 70 t o 100° C . Nevertheless, the viscosity is so high that gravitational forces can produce but little flow, and either mechanical force or air pressure must b e em- p l o y e d . In rheological instruments of the rotational t y p e the sample must b e confined in order t o keep it from climbing out of the instrument under the secondary forces that d e v e l o p within the sample.
T h e marked t h i x o t r o p y of elastomers requires consideration in the design and interpretation of rheological tests. A s will later b e shown, the initial viscosity when deformation begins m a y b e ten times greater than the later, steady-state viscosity. Such thixotropic behavior makes it impossible t o interpret reliably any test in which the deformation is limited. On the other hand there is a certain difficulty that arises when any a t t e m p t is made t o attain in a rotational viscometer a state of true thixotropic equilibrium.
This difficulty is that, in addition t o the rapid b r e a k d o w n of recoverable thixotropic structure, there is usually a slow, permanent softening of the elastometer if the test m e t h o d involves extensive and continuous deforma- tion. Consequently, a strictly steady state of viscosity m a y n o t b e attain- able; and if a single figure is t o b e reported as "the v i s c o s i t y , ' ' an arbitrary criterion must b e adopted as t o when the viscosity is changing slowly enough t o be considered essentially steady.
Elastomers always exhibit considerable elasticity, even when raw, hot, and reduced t o a state of m i n i m u m thixotropic structure. W h e n released
from an imposed deformation, they snap b a c k and then slowly creep further toward their last previous form. T h i s elastic recovery makes precise forming of elastomers impossible and often causes difficulty in holding even t o the liberal tolerances which the rubber technologist allows himself. Measure- ment of elastic r e c o v e r y is therefore of practical importance and must b e included with a viscosity measurement for the best processing control.
I n a screw extruder there must b e s o m e slippage of the raw mixed s t o c k over the s m o o t h metal surfaces of the barrel, screw, throat, and die. If this were n o t the case the n o n m o v i n g stock in c o n t a c t with the metal w o u l d , at the existing temperatures, sooner or later cure and w o u l d then interfere with the s m o o t h operation of the extruder. O n the other hand, the slippage, while important, is normally quite slow; so slow, in fact, that it has p r o v e d difficult t o obtain direct evidence of slippage or a n y measurement of it. A few rough measurements of this kind h a v e been published o n l y recently.
I n the following sections the principal t y p e s of rheological testing instru- ments for raw elastomers will b e described and the related rheometric equa- tions will b e stated; various rheological test results will b e reviewed; a new theory of the viscosity of an elastomer will b e briefly presented; and the chapter will close with a discussion of the applications of rheological tests in processing c o n t r o l .
II. R h e o l o g i c a l Testing Equipment 1 . RO T A T I O N A L IN S T R U M E N T S
In rheological instruments of the rotational t y p e a sample can b e main- tained indefinitely in a state of continuous shear until a steady or quasi- steady state is attained. T h e earliest such instrument suitable for rubbers was the rubber rheometer, d e v e l o p e d b y M o o n e y .2
Essential details of the apparatus are shown in Figs. 1 and 2 . T h e outer cylinder, or stator, 1 and 2 , is in the form of a split b l o c k , which opens u p for easy insertion of the sample. T h e inner cylinder, or rotor, 7 , is m o u n t e d on a hollow shaft, 8 , which is driven b y weights (not s h o w n ) connecting b y steel cables with the sheave, 2 3 . B o t h inner and outer cylinder surfaces are covered with fine, longitudinal V - g r o o v e s t o prevent slippage of the sample.
Besides the sample proper, located in the narrow space between the t w o cylinders, additional sample material is placed in the annular channels, 1 6 and 1 7 . T h e pressure rings, 1 4 and 1 5 , faced with cured rubber, are b r o u g h t to bear against this reserve sample in the channels; and the weights, 1 2 and 1 3 , operating on the pressure rings, maintain the sample under pressure and keep it from working out of the test space. T e m p e r a t u r e is maintained b y means of h o t oil which flows under gravity through the hollow shaft and under pressure through cavities (not s h o w n ) in the outer cylinder b l o c k s .
2M . M o o n e y , Physics 7, 413 (1936).
F I G . 1. T h e rubber rheometer of M o o n e y , vertical section. [From M . M o o n e y , Physics 7, 413 (1936).]
T h e angular v e l o c i t y of the rotor is measured with a stop w a t c h at slow and moderate speeds. A t high speeds a spark record is obtained on a sensi- tive chart on the circular table, 30, m o u n t e d on the rotor shaft. T h e driving weight in this instrument turns the rotor revolutions before it hits the floor, after which the weight must b e lifted and adjusted for the next driving period. I n this rest period the sample always recovers thixotropic structure, which must b e broken d o w n again during the next driving period.
T h e initial rotor v e l o c i t y during a n y driving period is therefore always l o w . T h e rotor v e l o c i t y of significance for a steady-state rheological flow curve is the constant v e l o c i t y observed during the latter part of a driving period.
If a constant v e l o c i t y is n o t attained the terminal v e l o c i t y lacks signifi- cance.
F o r making elastic r e c o v e r y measurements the sheave, 23 can b e thrown free of the clutch plate, 24, while the rotor is still m o v i n g under the torque of the driving weight. T h e subsequent m o v e m e n t of the rotor under the elastic restoring force of the sample can b e recorded b y means of the stylus, 31, which is pulled radially across the chart at the right m o m e n t and at an
F I G . 2 . T h e rubber rheometer of M o o n e y , horizontal section. [From M . M o o n e y , Physics 7 , 4 1 3 ( 1 9 3 6 ) . ]
appropriate speed. T h e mechanical gadgets on the instrument also include an arrangement for stopping the rotor suddenly and then releasing it after a short time lapse.
T h e rubber rheometer, though useful as a research tool, is t o o slow in operation t o be satisfactory for routine control tests. F o r this purpose there was developed another rotational instrument,3 in which the rotor is a flat disk and the stator a shallow cup enclosing the disk.4 A s shown in Fig. 3, the stator of this instrument is split along a central plane parallel t o the face of the disk; and the hand-closing mechanism, involving a double lever system, is sufficiently powerful that it can cut and shape the sample without appreciable delay, except with v e r y tough, cold samples.
T h e rotor has a split shaft which engages with the key, 10, in the spindle, 9, which is driven b y a synchronous m o t o r through the w o r m , 12, and w o r m gear, 13. T h e w o r m shaft floats in its bearings and is forced b y the reaction of the sample t o press against the spring, 15. T h e deflection of the spring, measured on the gage, 17, thus indicates the viscous force developed in the sample under the imposed continuous shear. Temperature is usually main- tained b y electric heaters. T h e plungers, 5 and 6, b a c k e d b y the steel springs, 7 and 8, are forced up b y the sample as the instrument is closed.
T h e y later c o m e b a c k d o w n t o some extent, keeping the sample under pressure in spite of slight leakage of rubber and trapped air from the chamber.
3 M . M o o n e y , Ind. Eng. Chem. Anal. Ed. 6, 1 4 7 ( 1 9 3 4 ) .
4 As m a n y in the rubber industry k n o w , this rotating disk v i s c o m e t e r is n o w gen- erally referred t o as the ' ' M o o n e y v i s c o m e t e r . " T h e present writer decries the use of proper names instead of descriptive names t o identify a test apparatus or m e t h o d . In the present instance he argued for retention of the name " d i s k v i s c o m e t e r ; " b u t it was a losing battle.
F I G. 3. T h e shearing disc, or M o o n e y , v i s c o m e t e r . [From M . M o o n e y , Ind. Eng.
Chem. Anal. Ed. 6, 147 (1934).]
A few M o o n e y viscometers h a v e been m a d e in which the w o r m gear en- gages the spindle through a clutch which, when disengaged, permits the rotor t o reverse and show the elastic r e c o v e r y of the sample. T h e reverse rotation registers on a dial at the side of the instrument case.
T h e usual operating temperature of the viscometer is 100° C . W h e n o p - erated at somewhat higher temperatures it can b e used t o measure s c o r c h ,5, 6 or incipient cure of a c o m p o u n d e d stock. Scorching is indicated b y a steep rise in the viscosity-time curve observed during the viscosity test. A rotor of less than standard diameter is usually e m p l o y e d in the scorch test, in order t o a v o i d overloading the driving mechanism.
A n interesting variation of the disk viscometer has been introduced b y Piper and S c o t t ,7 w h o substituted a biconical rotor for the flat disk. T h e biconical form, shown in Figs. 4 and 5 , has the advantage that the rate of shear in the sample is uniform over the face of the rotor, which is n o t the case with the disk rotor. H e n c e , the biconical rotor permits theoretically a calculation of the true viscosity at a k n o w n , single rate of shear, except for edge effects; while the flat disk rotor gives only an average viscosity over a
5 J. V . W e a v e r , Rubber Age Ν. Y. 48, 89 (1940).
6 R . W . W h o r l o w , India Rubber J. 125, 214 (1953).
7 G . H . P i p e r and J. R . S c o t t , J. Sei. Instr. 22, 206 (1945).
Scale:inche*
F I G. 5. T h e shearing-cone plastimeter of Piper and S c o t t ; horizontal section through center of r o t o r . [From G . H . Piper and J. R . S c o t t , / . Sei. Instr. 22, 206 (1945).]
range in rate of shear. O n the other hand, if the rheological curve is desired, then the advantage of the biconical rotor is n o t so great; for such a curve can b e obtained with either rotor from data covering a range in rotor speeds.
This point, and also the question of edge effects, will b e discussed later.
F I G. 6. T h e extrusion plastometer of M a r z e t t i . [From B . Marzetti, India Rubber World 6 8 , 776 (1923).]
Other rotational instruments of cylindrical form h a v e been used b y H a m m8 and b y E c c h e r .9 H a m m ' s viscometer was of the same form essen- tially as M o o n e y ' s except that the pressure rings were omitted. T h i s omission reduced friction b u t limited the rotational speeds at which meas- urements could b e m a d e . E c c h e r e m p l o y e d t w o independent rotors of different lengths in a c o m m o n stator. E n d effects were thus eliminated b y taking the difference between the torques of the t w o rotors at the same speed. Instead of pressure rings t o keep the instrument filled, E c c h e r e m - p l o y e d a forced continuous feed into the space between the rotors.
2 . EX T R U S I O N IN S T R U M E N T S
T h e extrusion t y p e of viscometer is of historical interest, because this was the t y p e used b y M a r z e t t i ,10 the pioneer in rheological testing in the field of rubber t e c h n o l o g y . His instrument, shown in Fig. 6, consisted of a cylinder with a conical b o t t o m terminating in a hole through which the sample was extruded b y compressed air. A loose fitting piston on t o p of the sample prevents the air from channeling through t o the delivery hole. T h e required heating period of one-half hour is a disadvantage of this t y p e of viscometer.
T h e extrusion rates e m p l o y e d b y Marzetti were quite slow; and the c o n - ical shape of the exit makes accurate c o m p u t a t i o n of true viscosity im- possible. Nevertheless, the instrument served t o obtain a considerable b o d y
8 G . G . H a m m , Thesis, N a a m l o z e V e n n o c t s c h a p , W . D . Meinema, Delft (1946).
9 S. Eccher, Ind. Eng. Chem. 43, 479 (1951).
1(> B . Marzetti, India Rubber World 6 8 , 776 (1923).
F I G. 7. T h e extrusion plastometer of Dillon. [From J. H . Dillon, Physics 7, 73 (1936); Rubber Chem. and Technol. 9, 496 (1936).]
of relative quantitative data on the viscosity of various raw rubbers and mixes in various stages of processing.
A number of other extrusion viscometers have been used b y other in- vestigators.1 1"14
T h e m o s t elaborate, and at the same time the m o s t practical plastometer in m a n y w a y s is the D i l l o n14 extrusion plastometer, shown in Fig. 7. All mechanical m o v e m e n t s are p o w e r e d with compressed air, including the operation of charging the hemispherical extrusion chamber with the sample.
Electric switches on the extrusion ram automatically record the time of extrusion of a fixed v o l u m e .
T h e M c K e e W o r k e r v i s c o m e t e r15 has the advantage that, unlike other extrusion instruments, it can bring the sample essentially t o a state of thixotropic b r e a k d o w n . T h i s is accomplished b y pushing the sample b a c k and fourth any number of times through one or several holes in a plate dividing the extrusion cylinder into t w o halves. T h e pistons, one in each half of the cylinder, are mechanically driven at a controlled speed, the re- quired force being observed.
3. CO M P R E S S I O N I N S T R U M E N T S
In the viscometers of the compression t y p e , a sample, initially in the form of a small pellet, is pressed between flat plates under a given load. T h e
1 1 R . W . Griffiths, Trans. Inst. Rubber Ind. 1, 308 (1926).
12 J. Behre, Kautschuk 8, 2, 167 (1932); Rubber Chem. and Technol. 6, 244 (1933).
1 3 J. H . Dillon and N . Johnston, Physics 4, 225 (1933); Rubber Chem. and Tech- nol. 7, 248 (1934).
1 4 J. H . Dillon, Physics 7, 73 (1936); Rubber Chem. and Technol. 9, 496 (1936).
1 5 S. A . M c K e e and H . S. White, J. Research Natl. Bureau Standards 46, 18 (1951).
thickness of the sample after a given compression time is generally taken as a measure of its plasticity.
T h e Williams p l a s t o m e t e r16 was the first instrument of this t y p e t o b e used extensively. I t consists essentially of a flat base plate and a 5-kg.
weight m o u n t e d o n guides t o hold it straight. T h e standard procedure a d o p t e d b y Williams was t o use a 2 - c c m . sample which was preheated and then pressed for 5 min. at 100° C . I n order t o keep the sample from sticking t o the plastometer plates the sample is usually placed between sheets of rice paper or other thin sheet material. G a r n e r17 has reported slight slippage in some cases when the sample was in direct c o n t a c t with the plates.
Elastic r e c o v e r y is measured b y the height of the sample a minute or more after removal from the plastometer. A test is n o t considered satis- factory if the compressed height and the recovered height are n o t b o t h considerably less than the initial sample height.
M a n y minor variations of the Williams plastometer have been devel- o p e d ,1 8"21 and there is another series of compression instruments2 2"25 in which a small table or a pair of small plates is used with a sample of initial di- ameter equal t o or greater than the table or plate diameter. I n these designs the deforming pressure remains constant during the test. D e V r i e s26 reports difficulties with this test because of variability in the behavior and effects of the ring of extruded sample around the edge of the table.
T w o i n v e s t i g a t o r s2 5 , 26 have described compression plastometers with accessories which permit converting into various forms at will.
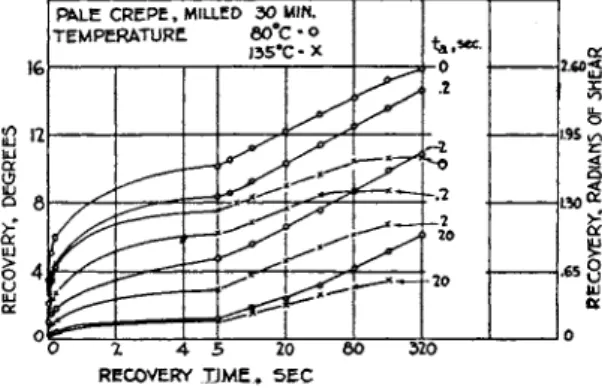
A variation in testing procedure, the D e f o m e t h o d , m u c h used in Ger- m a n y involves t w o or more tests with different compressing loads which permit interpolation t o that load required t o compress the sample t o the standard compressed thickness in the standard time. T h e details, as given b y B a a d e r25 are: Sample form, circular cylinder 1 c m . in diameter and 1 c m . in height; compressed t o 0.4 c m . in height in 30 sec. at 80° C . Preheating period 20 min. R e c o v e r y height measured at 30 sec. after release. A more
1 6 I. Williams, Ind. Eng. Chem. 16, 362 (1924).
1 7 T . L . Garner, India-Rubber J. 78, 20 (1929).
1 8 J. Hoekstra, Physics 4, 285 (1933); Rubber Chem. and Technol. 7, 136 (1934).
1 9 R . H o u w i n k and P . N . Heinze, Ind. Eng. Chem. Anal. Ed. 10, 689 (1938).
2 0 H . Hagen, Kautschuk 14, 203 (1938).
2 1 W . Ν . K e e n , India Rubber World 110, 174 (1944).
2 2 W . de Wisser, " T h e Calender Effect and the Shrinkage of Unvulcanized R u b - b e r . " C r o s b y L o c k w o o d & Son, L o n d o n , 1926.
2 3 A v a n R o s s e m and H . v a n der M e i j d e n , Kautschuk 3 , 369 (1927); Rubber Chem.
and Technol. 1, 393 (1928).
2 4 E . Karrer, J. M . D a v i e s , and E . O . Dieterich, Ind. Eng. Chem. Anal. Ed. 2 , 96 (1930); Rubber Chem. and Technol. 3 , 295 (1930).
2 5 T . Baader, Kautschuk 14, 223 (1938).
*6 O. de Vries, India-Rubber J. 75, 429 (1928).
detailed description and critical analysis of the D e f o plastometer has been published b y W h o r l o w .27
T h e p r o b l e m considered here is that of c o m p u t i n g viscosities from the raw data of observation given b y the three types of testing instruments described in the previous section.
1. RO T A T I O N A L IN S T R U M E N T S
F o r a coaxial rotating cylinder viscometer of small intercylinder clear- ance, the well-known formulas are:
where g is the rate of shear, r the shearing stress, Ri and J?2 the radii of the inner and outer cylinder, respectively, L their length, Ω the angular rotor v e l o c i t y , and C the driving torque. T h e viscosity is
T h e rubber rheometer lends itself also t o another rheological measure- ment. T h e autographic traces of the elastic r e c o v e r y show at the beginning a few rapidly d a m p e d oscillations superimposed on the recovery curve.
F r o m the frequency and damping rate it is possible t o calculate the d y - namic shear modules and viscosity for the observed frequency and ampli- tude. T h e reader is referred t o the published article2 for the theoretical formulas for d y n a m i c viscosity and m o d u l u s .28
2 7 R . W . W h o r l o w , J. Rubber Research 18, 51 (1949).
2 8 D i l l o n and C o o p e r29 have criticized the use of these equations in this application on the grounds that the equations assume constant v i s c o s i t y although the sample shows large variations in v i s c o s i t y with rate of shear. In reply t o this criticism it can be said that the v i s c o s i t y variation is established for c o n t i n u o u s , unidirectional shear;
b u t whether the v i s c o s i t y of H e v e a rubber varies under shear oscillations of small amplitude is n o t k n o w n . D a t a reported b y M a r v i n30 on p o l y i s o b u t y l e n e show c o n s t a n t v i s c o s i t y in oscillation in the frequency range 0.0016 t o 16 c.p.s. at 25° C . T h e fre- q u e n c y in the author's oscillation test was a p p r o x i m a t e l y 100 c.p.s. On the basis of our present limited k n o w l e d g e , the assumption of c o n s t a n t v i s c o s i t y of H e v e a in shear oscillations at the frequency concerned is p r o b a b l y as g o o d as any that can b e suggested.
2 9 J. H . D i l l o n and L . V . C o o p e r , Rubber Age Ν. Y. 41, 306 (1937).
3 0 R . S. M a r v i n , N a t i o n a l Bureau of Standards, Interim R e p o r t on the C o o p e r a - t i v e P r o g r a m on D y n a m i c T e s t i n g (1951).
III. Viscometric Theory
g = Ω fi22 + FIX2
Ä22 - Ä L2
(D
( 2 )
T h e viscometric theory of the disk and the biconical rotor viscometer is complicated b y the geometry of the b o u n d a r y conditions. A s a practical procedure it is convenient t o assume the P o r t e r - R a o p o w e r law of fluidity,
9 = fr" ( 3 )
where g is the steady rate of shear, Τ the shearing stress, and / and η are material constants. On this basis Piper and S c o t t7 have analyzed the bi- conical viscometer, their results being expressible in the form
where C is the driving torque, Ω the rotor angular v e l o c i t y , λ is R1/R2 and a, p, Ri and R2 are as indicated in Fig. 5.
If it is found experimentally that C is proportional t o Ω1 /η the a b o v e equation then serves t o determine / and n. H o w e v e r , if the logarithmic p l o t of C v s . Ω is n o t strictly linear, a more elaborate c o m p u t a t i o n procedure is required t o obtain the true g — Τ relationship.
If w e identify g as Ω / α , then the a b o v e equation is equivalent t o
9 = Ω
(5)
7 " 47ΓΡ3 / ~ _ 1
N o w for any chosen value of Ω the local value of η can b e determined graphically from the logarithmic C — Ω plot. T h e corresponding stress, r, can then b e c o m p u t e d from equation ( 5 ) , and a point on the rheological curve is thereby determined. T h e c o m p u t a t i o n can b e repeated for other values of Ω, and the complete experimental g — τ curve is thus obtained.
A n analysis of the disk viscometer b y the m e t h o d of Piper and S c o t t leads t o the torque equation
C = 3 1 1 - X - η
(6)
where Ri is the rotor radius, R2 the stator radius, λ is R1/R2, b is the rotor thickness, and h is the clearance, t o p or b o t t o m , between rotor and stator.
Corresponding t o equations (5) w e have in this case
9 h
C ( 7 )
r 47Γβΐ' 4:wnbRih
3
+ i
n
1 ' 1 - λ2η
C o m p u t a t i o n of the g — τ curve w o u l d proceed in the manner described in connection with equations ( 5 ) .
W i t h regard t o the fluidity p o w e r law stated b y equation ( 3 ) , the point is sometimes made that the law is p r o b a b l y not valid in the limit as the stress approaches zero. N o d o u b t , this criticism is correct. H o w e v e r , from a practical point of view it is n o t important; for the absolute error in the postulated fluidity at l o w stress is small and has a v e r y small or negligible effect in the computations outlined a b o v e .
2 . EX T R U S I O N IN S T R U M E N T S
Several extrusion plastometers have been used with dies which were of conical form or were short in comparison with their diameters. T h e vis- cometric theory of such instruments will n o t b e attempted, the theory which follows being limited t o dies or delivery tubes of uniform circular section and of considerable length.
T h e published data on the extrusion of rubbers usually cover variations in pressure, sometimes variations in temperature, but only rarely d o they cover variations in tube diameter and length. T h i s is regrettable, because measurements that have been m a d e with t w o or m o r e tube lengths show that the entrance pressure d r o p in the extrusion of rubbers is v e r y high, sometimes as m u c h as half the total extrusion pressure. Consequently, the pressure d r o p within the extrusion tube remains u n k n o w n when only a single tube length is used ; and viscosities cannot b e accurately c o m p u t e d from such limited data. In particular it m a y b e noted that if a pressure- efflux curve has a positive intercept on the pressure axis, it cannot b e con- cluded that the flowing material within the extrusion tube has a yield point.
I t is more likely that the rubber is thixotropic and has a yield point for initial flow within the extrusion chamber.
F o r the flow in the lower section of an extrusion tube within which there is n o further thixotropic or elastic change, the viscometric equation can be obtained for any liquid, N e w t o n i a n or n o n - N e w t o n i a n . T h e equation, first published b y R a b i n o w i t s c h3 1, can b e written in the form
(8)
3 1 R . R a b i n o w i t s c h , Z. physik. Chem. A145, 1 (1929).
where g is the rate of shear at the tube wall, τ is the shear stress at the tube wall, Ε is the reduced efflux, Q/πα8, Q being the v o l u m e of flow per unit time, and a the tube radius, τ is given b y the well-known expression aP/2L, Ρ being the pressure d r o p in the tube and L the t u b e length.
3. CO M P R E S S I O N PL A S T O M E T E R S
In all the published theories of the compression plastometer, in either the plate or table form, t h i x o t r o p y is neglected; it is assumed that at all points in the sample at all times the stress-rate of strain relationship is that cor- responding t o a steady state of continuous deformation at the instantaneous local rate. T h i s is a highly questionable assumption when the deformation is so limited and is so variable in time and space. Other, m o r e acceptable, assumptions are, first, that there is n o slip of the sample on the compressing surfaces and, second, that the vertical c o m p o n e n t of the v e l o c i t y can b e neglected except insofar as it requires and determines the net radial flow as a function of the radius.
F o r a N e w t o n i a n liquid in a plate plastometer Stefan32 d e d u c e d the formula
I _ JL =
S t M^ (Q)¥ Ao
43iy7*
V ;where h0 is the initial height of the sample, h its height at time t, M is the compressing weight, g the acceleration of gravity, η the viscosity, and V the sample v o l u m e .
In application t o the table form of compression plastometer with a con- stant sample area, M a r t i n33 quotes a formula for a N e w t o n i a n liquid derived b y T a y l o r .34
I -
λ =d o )
h2 h02 3τα*η v
where a is the diameter of the table.
I n m o r e recent analyses P e e k35 and S c o t t36 have derived equations based on the assumed flow law
(ID
where F , n, and η0 are material constants. T h e equations are c o m p l i c a t e d and have n o t been frequently used. F o r the case Y = 0 S c o t t36 has m o r e
3 2 M . J. Stefan, Sitzber. Akad. Wiss. Wien. Math. Naturw. Kl. Abt. II 69, 713 (1869).
3 3 G . Martin, Trans. Inst. Rubber Ind. 6, 298 (1930).
3 4 G . S. T a y l o r , Proc. Roy. Soc. (London) 108, 12 (1925).
3 5 R . L . Peek, Jr., J. Rheol. 3 , 345 (1932).
3 6 J. R . S c o t t , Trans. Inst. Rubber Ind. 10, 481 (1935); Rubber Chem. and Technol.
8, 587 (1935).
recently published the theoretical results in a simplified form and has included curves of s o m e parametric functions required in c o m p u t a t i o n s .
All these theoretical equations are usually ignored b y those w h o use compression plastometers, their results normally being reported simply as the sample height or as certain height ratios after a given compression time.
I V . Elastic R e c o v e r y
M o s t rheological testing devices used for elastomers permit s o m e kind of measurement of elastic r e c o v e r y after the sample is released, b u t the rubber rheometer is the only one that yields a figure representing the degree of recovery in a simple, h o m o g e n e o u s r e c o v e r y deformation. T h e figure is the simple shear r e c o v e r y
y
*
= (>rW^R?
(12)where 0r is the observed reverse rotation of the rotor, and Ri and R2 are as defined for equation ( 1 ) .
T h e Piper and S c o t t7 biconical viscometer, if used in r e c o v e r y tests, would give an approximate value for simple shear r e c o v e r y . There is some error arising from t w o facts. First, the edge effect, represented b y the last term in equation (4) is not small, and, second, the rate of shear in the edge region is n o t uniform.
A measurement closely related t o elastic r e c o v e r y has been used b y B l o w and Schofield37 with the M o o n e y viscometer. After completing a viscosity test and stopping the m o t o r , they leave the sample in the instrument and observed the d e c a y of stress in the sample as indicated b y the falling of the dial reading. T h e figure which they use as significant is the ratio V/R, where V is the standard viscosity reading and R is the d e c a y e d reading at 60 sec. after stopping the m o t o r . T h i s ratio is inversely related t o elastic recovery as directly measured.
Elastic recovery in an extrusion test, or extrusion swell, is measured b y the diameter of the extruded w o r m relative t o the diameter of the delivery tube. Extrusion swell has been analyzed b y Spencer and D i l l o n ,38 b u t the t y p e of shearing deformation they assume t o exist in the sample at exit could only lead t o a telescopic elastic deformation after exit, n o t t o longi- tudinal contraction and diametric swell. Their agreement with experi- mental results must b e fortuitous or, more likely, result from relationships a m o n g some factors in the extrusion test that are n o t y e t understood.
37 C . M . B l o w and J. R . Schofield, Rubber Chem. and Technol. 23, 601 (1950); "Prin- ciples of R h e o l o g i c a l M e a s u r e m e n t , " published for the British R h e o l o g i s t s C l u b , N e l s o n , L o n d o n .
3 8 R . S. Spencer and R , E . D i l l o n , J. Colloid Sei. 3 , 163 (1948).
T h o s e w h o use compression plastometers use different m e t h o d s for ex- pressing the elastic r e c o v e r y in terms of the data of observation. Since the recovery, like the deformation, is nonuniform, a n y compression r e c o v e r y figure is an average value.
V . S u r f a c e S l i p
In the Introduction it was indicated that slippage of raw stocks on h o t metal surfaces is k n o w n t o occur b u t is slow and difficult t o measure. T w o different experimental approaches t o this p r o b l e m have recently given posi- tive results. One approach involves such a series of test conditions as t o apparatus dimensions that it b e c o m e s possible t o distinguish between the effects of the shearing deformation and the surface slip on the total o b - served m o v e m e n t . T h e other approach involves paired measurements with the same apparatus dimensions b u t with s m o o t h and roughened surfaces, respectively, in c o n t a c t with the test material.
A n application of the first m e t h o d , i n v o l v i n g extrusion measurements with dies of different lengths and diameters, was mentioned in the paper b y M o o n e y and B l a c k .39 T h e theory of the slip calculations has been published b y M o o n e y .4 0
A s an example of the second m e t h o d of measuring slip, recent data b y D e c k e r and R o t h4 1 m a y be cited. Measurements were m a d e with a standard serrated rotor and with a s m o o t h rotor in the M o o n e y viscometer. L o w e r torque readings with the s m o o t h rotor when observed can b e attributed t o surface slip.
T h e c o m p u t a t i o n of absolute slip v e l o c i t y requires experimental data over a range of rotor speeds. T h e theory has been d e v e l o p e d b y the present writer, b u t n o t y e t published. Here, h o w e v e r , the results will b e stated. T h e theory assumes that the slip v e l o c i t y o b e y s a p o w e r law similar t o equation (3) ; thus
ν = srp
where ν is the slip v e l o c i t y , r is the surface shearing stress, <and s and ρ are material constants characteristic of the elastomer and the surface on which it is slipping.
T h e c o m p l e x g e o m e t r y makes a solution in closed form impossible. T w o different p o w e r series solutions are d e v e l o p e d , t o the first approximation only, one value for small slip and the other for large slip. F o r the inter- mediate range, where the slip v e l o c i t y is of the order of the displacement v e l o c i t y associated with shear, n o solution of satisfactory precision has been obtained. T h e solutions for the t w o extreme cases are:
3 9 M . M o o n e y and S. A . B l a c k , J. Colloid Sei. 7, 204 (1952).
4 0 M . M o o n e y , J. Rheol. 2, 210 (1931).
4 1 G . E . D e c k e r and F . L . R o t h , India Rubber World 128, 339 (1953).
(i) for small slip velocity,
nRMCo - C)Fi
SC0F2 (14)
4irÄi3
F1 =
F , =
A =
λ =
P . + , +
1) Γ ΐ + + _ L 2nRi&n+1)
\
l+&>+»+^«""-\
L 2nRi 3n + 1
2nh
(15)
(1 - X2» ) ß !
R2
Ri, # 2 , b, and Ω are as defined for equations ( 1 ) . C and C0 are the o b - served torques at rotor velocity Ω with and without slip, respectively; that is, with the s m o o t h and the serrated rotors, respectively.
(it) for large slip velocity
= Ä O ( I - £ F , )
3CFU 4TTÄI8
(16)
3p + 1
Ί +
3p 3p + η + 1 I J_
1 1 + 3 W 1 + (3p + 1)6
X
2 p ß i (17)
1 + ( 2 ρ + η + 1 ) ( 1 - λ2 η) 6
ipnh 1 + (3n + 1 ) & Α1 /η
2nRt
1 +
F4 =
1 + J £ (3p + 1)6
2pÄi
1.4
.41 1 1 1 2 4 6 8
τ ι
F I G . 8 . T h e slip v e l o c i t y c o m p u t a t i o n factor Fi of equations ( 1 4 . 1 ) and ( 1 5 . 1 ) for small slip v e l o c i t y , μ = p/n — 1. ρ and η are the e x p o n e n t s in the slip v e l o c i t y and the fluidity p o w e r laws, r e s p e c t i v e l y .
Ω and Ω0 are the rotor velocities at torque C with and without slip, re- spectively.
The values of η and ρ can be determined from logarithmic plots of o b - servable data. Thus, according t o equations n o t included in this summary,
for n o slip C = const Χ Ω1 /η
for small slip C0 - C = const X ti(p+1)/n (18) for large slip C = const Χ Ω1 /ρ
For convenience in c o m p u t i n g slip, Figs. 8 t o 11 give in graphical form the values of the F-I actors in equations (15) and (17) for a limited range of the parameters η and ρ and for the instrument dimensions of the standard M o o n e y viscometer.
A n analysis similar t o the one summarized here can b e made also for the
•8
F
2.7
2 4 6 8
T L
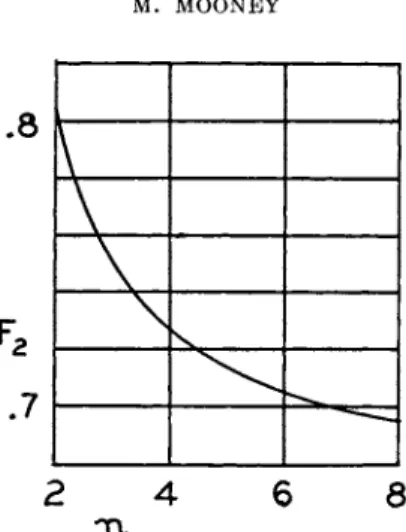
F I G . 9. T h e shear stress c o m p u t a t i o n f a c t o r F2 of e q u ations ( 1 4 . 2 ) and ( 1 5 . 2 ) f o small slip v e l o c i t y , η is the exponent in the fluidity p o w e r l a w .
bioconical rotor of Piper and Scott, b u t in slip measurements the biconical form loses its advantage relative t o the disk f o r m .
V I . E x p e r i m e n t a l Results
1. TH E FL U I D I T Y O R FL O W CU R V E
M a n y rheological measurements on rubbers have been reported which consist of single observations under arbitrarily chosen test conditions. Such measurements are inadequate for determining the viscosity function of a non-Newtonian liquid.
T h e first published data giving rheological curves for elastomer are those obtained b y M o o n e y2 in measurements on H e v e a rubbers in the rubber rheometer. A s was explained a b o v e in Section I I I , 1, there is thixotropic recovery during the rest periods in this weight-driven instrument; and the initial rotor v e l o c i t y within a driving period is l o w . Figure 12 shows a curve of v e l o c i t y v s . angle of rotation after the driving weight starts falling. I t is seen that in this case the initial v e l o c i t y is only i/fn of the final, constant velocity.
Figure 13 shows in curve A, the rheological curve of the steady-state rate of shear v s . shearing stress for a sample of slightly milled H e v e a Pale Crepe tested at 100° C .4 2 In addition t o this curve obtained b y M o o n e y , several other curves are shown which were obtained b y H a m m ,8 S c o t t and W h o r - l o w ,43 Saunders and T r e l o a r ,44 and E c c h e r .9 All of these investigators used rotational instruments which yielded absolute flow data.
4 2 A slight revision has been made here t o c o r r e c t a scale error in M o o n e y ' s original c u r v e .
I — I — I — I — I — I — 2 LOO
2 4 6 8 Π
F I G. 10. T h e slip v e l o c i t y c o m p u t a t i o n factor Fd of equations (16.1) and (17.1) for large slip v e l o c i t y , μ = p/n — 1. ρ and η are the exponents in the slip v e l o c i t y and the fluidity power laws, respectively.
T h e s e various curves are in fair agreement as t o general form except at stresses b e l o w 104 d y n e s / c m .2 where the slopes of the t w o curves extending so far are quite different. M o o n e y ' s limiting slope is roughly 2, while S c o t t and W h o r l o w ' s43 is roughly 1. S c o t t and W h o r l o w attribute this difference t o the friction of the pressure collars in M o o n e y ' s apparatus; b u t this is an incorrect conclusion. I t apparently results from M o o n e y ' s failure t o state clearly that when using the smaller driving weights the pressure collars 14 and 15 (Fig. 1) were r e m o v e d from c o n t a c t with the rotor. T h e bearing frictions that remained are t o o small t o explain the discrepancy between the curves in Fig. 13. I n v i e w of the different milling treatments of the t w o samples concerned, it is probable that the samples are truly different in their rheological curves.
I t is necessary t o refute also another criticism of M o o n e y ' s results offered b y S c o t t and W h o r l o w ,43 based on their c o m p u t a t i o n of the temperature rise caused b y energy dissipation b y viscosity in the sample. Their c o m p u - tation is for the steady-state temperature rise after constant rotation for an
4 3 J. R . Scott and R . W . W h o r l o w , Proc. 2nd Rubber Technol. Conf., London p . 244 (1948); Rubber Chem. and Technol. 23, 683 (1950).
4 4 D . W . Saunders and L . R . G . Treloar, Trans. Inst. Rubber Ind. 24, 92 (1948).
.75
.70
2 4 6 8 τ ι
F I G. 11. T h e shear stress c o m p u t a t i o n factor F4 of equations (16.2) and (17.2) for large slip v e l o c i t y , η is the e x p o n e n t in the fluidity p o w e r l a w .
3 0 0 1 1 1 1 1
0 2 0 0 4 0 0 6 0 0 Θ, 0
F I G . 1 2 . Angular r o t o r v e l o c i t y , 0 , versus angle of r o t a t i o n , 0 , in the rubber rheometer. H e v e a Pale Crepe, milled 5 min., tested at 1 0 0° C . Shear = . 1 6 2 0 ° . indefinite period. H o w e v e r , in M o o n e y e measurements at the higher rates of shear the driving weight hits the flow long before a steady temperature could be reached. If we assume that there is temperature equilibrium when the driving weight begins t o fall, and none of the heat generated is lost b y conduction, then the c o m p u t e d temperature rise under 100 lb. driving load is 6° C . after one rotor revolution b y which time the rotor velocity has be- c o m e constant. In view of the relatively low temperature coefficient of viscosity and the l o w experimental precision under the conditions con- sidered here, this temperature rise does not require any significant correction t o the published data.
T h e continuously increasing slope of the rate of shear curves at high stresses in Fig. 13 suggests the possibility of an upper limit t o the stress that can b e sustained b y the test material. A weight-driven instrument is n o t so well suited t o test this point as is an instrument with controlled, imposed speed and a measured stress.
. 8 0
u bJ
</> m
Ο Ο
3 4 5 6 7 L O G τ , d / C M *
F I G . 1 3 . L o g a r i t h m i c steady state flow c u r v e s , rate of shear, g, s e c .- 1, vs. shear stress, τ, d y n e s / c m .2.
1. S m o k e d sheet passed 6 0 times through tight mill, tested at 8 0 ° C . ( E c c h e r ) 2 . S m o k e d sheet milled 6 0 min. 1 0 0 ° C . (Piper and S c o t t )
3 . S m o k e d sheet milled, 1 0 0 ° C . (Saunders and T r e l o a r ) 4 . Pale crepe milled 1 2 m i n . 9 0 ° C . ( H a m m )
5 . Pale crepe milled 3 0 m i n . 1 4 0 ° C . ( M o o n e y ) 6 . Pale crepe milled 5 min. 1 0 0 ° C . ( M o o n e y )
These requirements are met b y a M o o n e y viscometer with a multispeed drive, as used b y D e c k e r and R o t h .4 1 T h e curves obtained with H e v e a , G R - S and G R - I rubbers of various viscosities are reproduced in Figs. 14 and 15. F o u r of these curves, N o . 1 G R - I and N o s . 1, 2, and 3 Hevea, h a v e apparently reached an upper limit of M o o n e y torque reading at a rotor speed of 1 r.p.m.
I t is true that the M o o n e y reading represents an average viscosity or average shear stress; b u t even so, the leveling of these curves still proves that in the samples referred t o there is an upper limit t o the shearing stress that the sample can develop under any rate of shear. I t is t o be noted, on the other hand, that other curves in Figs. 14 and 15 fail t o reach a m a x i m u m within the range of the measurements; and if stress maxima exist for these other samples they must lie at higher stresses and rates of shear.
For a M o o n e y reading of 100, the mean shear stress on the rotor surface is 2 m e g a d y n e s - c m .2. T h e upper limit of the shear stress for the samples in Fig. 14 is therefore in g o o d agreement with the upper limit indicated b y M o o n e y ' s curve in Fig. 13.
A question might b e raised regarding heat dissipation and temperature rise in the sample at the higher rotor speeds in the M o o n e y viscometer.
D e c k e r and R o t h4 1 d o n o t discuss this p o i n t ; b u t similar curves have been obtained in the writer's laboratory b y a procedure in which the viscosity at high speeds is read as quickly as possible, before the sample has had time t o heat u p appreciably. Thus, at the highest speed of a b o u t 40 r.p.m. the reading can b e m a d e in 2 t o 3 sec. Presumably, some such procedure was used b y D e c k e r and R o t h .
S o m e recent rheological curves for H e v e a published b y W h o r l o w45 s h o w minor differences in the form of the curves, depending on the previous treat- ment of the sample. Cold-milled rubbers showed smaller slopes of log stress
4 5 R . W . W h o r l o w , Research Assoc. Brit. Rubber Mfrs. Research Rept. N o . 68, (1952); Rubber Chem. and Technol. 27, 20 (1954).
L o g rotor speed in R . R M .
F I G. 15. M o o n e y viscosity reading vs. rotor r.p.m., 100°C. Curves 1 and 2 are for pale crepe and smoked sheet as taken from the b a l e ; 3 is for slightly masticated smoked sheet; 4 is for x-603 G R - S mill-massed according t o the procedure given in the 1'Specifications for Government Synthetic R u b b e r s ; " and 5 is for well masticated pale crepe. [From G . E . D e c k e r and F . L . R o t h , India Rubber World 128, 339 (1953).]
vs. log strain rate, with numerous crossovers w h e n such curves were plotted on the same graph with curves for hot-milled rubbers.
T h e effect of temperature o n the fluidity of H e v e a is shown in the family of curves in Fig. 16, obtained b y M o o n e y .2 T h e irregularities and slight maxima in some of the curves might seem t o b e the spurious results of ex- perimental error, b u t t h e y h a v e been observed with other rubbers also, particularly w i t h rubbers of high viscosity and l o w tack. I t appears that such rubber exhibit a p h e n o m e n o n at given stress and temperature w h i c h might well b e described as partial failure b y internal tearing. T h e p h e n o m - enon disappears at a higher temperature because of the resulting increase in tack. T h i s v i e w is supported b y experimental results in t a c k testing.
B e c k w i t h et αΖ.,46 and B e a v e n et al*7 h a v e found that the m a x i m u m ad-
4 6 R . K . B e c k w i t h , L . M . W e l c h , J. F . Nelson, A . L . Chaney, and E . A . M c C r a c k e n , Ind. Eng. Chem. 41, 2247 (1949).
4 7 E . W . Beaver, P . Q. Croft-White, P . J. Garner, and G . R o o n e y , Proc. 2nd Rubber Technol. Conf. London, p. 224 (1948) ; Rubber Chem. and Technol. 23, 719 (1950).
hesion of a t a c k y surface does not d e v e l o p immediately on contact but re- quires a measurable time.
S m a l l w o o d48 has analyzed the data of Fig. 16 in terms of Eyring's non- linear theory of viscosity. T h e energy of flow activation is found t o b e 10.2 k c a l . / m o l . Other features of S m a l l w o o d ' s theoretical w o r k will b e dis- cussed in a later section.
Rheological curves have been published for relatively few of the m a n y synthetic elastomers n o w in commercial use. A number of unpublished curves obtained in the author's laboratory have the same general shape as the curves for H e v e a ; and some of them show similar irregularities in the variations with temperature and stress. G R - S , however, gives at least in some cases a curve of a different character in that the logarithmic plot of the flow data within the experimental range yield a straight line. T h u s these curves agree with the fluidity p o w e r law of equation ( 3 ) . T h i s was found b y T r e l o a r ,49 whose results are shown in Fig. 17 for a range of tem- perature and rate of shear. T h e value of η for all temperatures is approxi- mately 4.0. T h e heat of activation is 10.0 t o 10.5 kcal., showing a slight variation with the applied shear stress. Similarly in Fig. 15, the G R - S data
4 8 Η . M . S m a l l w o o d , J. Appl. Phys. 8, 505 (1937).
4 9 L . R . G . T r e l o a r , Trans. Inst-Rubber Ind. 26, 167 (1949) ; Rubber Chem. and Tech- nol. 23, 347 (1950).
<
8*
Λ
....
_ c — ^
/ ,+ r / ' '
s / x>
/ / 9
Ο / /
\
/ / /
Y c/ r/
y / n Ci ο r f
' / /
/
f
5-4 5-6 5-8 6-0
//.
6-2l o g J s h e a r s t r e s s , d y n e s / c m2]
F I G . 1 7 . Logarithmic flow curves for G R - S . [From L . R . G . Treolar, Trans. Inst, Rubber Ind. 25, 1 6 7 ( 1 9 4 9 ) ; Rubber Chem. and Technol. 23, 3 4 7 ( 1 9 5 0 ) . ]
give a straight line, the value of η being 3.8 in this case. T h e curves in Fig.
15 are n o t true rheological curves; b u t if a graph is straight in this Figure the corresponding rheogram also must b e straight.
I t must b e added, however, that some unpublished data b y the present author on G R - S shows curvature at higher rates of shear, in conformity with other elastomers. Furthermore, data on G R - S obtained b y Bestul et al.50 show a slight b u t continuous curvature. T h e fact that their data are plotted as viscosity instead of shear rate against shear stress cannot a c c o u n t for the curvature. W e must conclude that while some G R - S samples follow the fluidity p o w e r law within a limited range in the test conditions, this law cannot b e considered valid for all G R - S samples or for all test conditions.
Of the m a n y published flow curves obtained with extrusion viscometers, only those published b y M o o n e y and B l a c k39 make allowance for the en- trance pressure d r o p ahead of the delivery t u b e and give the true stress within the tube. T w o sets of curves for H e v e a and G R - S from this report are shown in Figs. 18 and 19. T h e materials tested were H e v e a s m o k e d sheet, broken d o w n t o M o o n e y viscosities 48 and 18; G R - S of M o o n e y vis- cosity 40 at 250° F., and a group of G R - S mixes with four different fillers.
5 0 A. B . Bestul, G . E . D e c k e r , and H . S. W h i t e , Research Natl. Bur. Standards
46, 2 8 3 ( 1 9 5 1 ) .
ΜΛ-2Ι 2E
200°
CBRW
^ 2 5 ?
— '
— S —
^ 8
"3 E
Te XTRUSIO NPERATU N
RE
li
100 1000 10000CHARACTERISTIC EFFLUX. EC
F I G. 18. Shear stress, τ , in m e g a d y n e s / c m .2, vs. characteristic efflux, fr11/(η + 3) for smoked sheet. [From M . M o o n e y and S. A . B l a c k , / . Colloid Sei. 7, 204 (1952).]
CURVE 2 CURVE 3
3 30 300 3000
6.7 7 . 2 5.0
CURVE 1 F 1.3 X 10~40 2.6 X 10~43 7.9 X 10~30
4 . 4 7.7 8.8
F 3.2 X 10~26 2 . 2 Χ 10~46 3.9 X 1 0 -62
3.2 4.9 6.2 6.9
F 2 . 2 Χ 1 0 "17 1.9 X 10~28 2.7 Χ 10~36 8.3 Χ 1 0 "40
T h e shearing stress at the wall is in the range from 1 t o 7 m e g a d y n e s / c m .2. I t thus overlaps and extends b e y o n d the stresses d e v e l o p e d in the rotational viscometer measurements presented a b o v e . T h e rates of shear at the wall are considerably higher, reaching values a b o v e 104 r a d . / s e c . T h e rate of shear itself is n o t shown b y the graphs; b u t it can b e c o m p u t e d from the indicated characteristic efflux b y means of equation ( 8 ) .
I t is clear that the data give in m o s t cases roughly straight lines; b u t as the authors p o i n t out, η generally increases slightly with increasing efflux.
T h e H e v e a curves of Fig. 18 are in rough agreement in the region of overlap with those of Figs. 13 and 16. T h e over-all value of η for G R - S with n o filler, 4.2, is in agreement with the values found b y T r e l o a r49 and b y D e c k e r and R o t h .41 T h e absolute shear rates, on the other hand, are n o t in g o o d agree- ment, the rate at 1 m e g a d y n e / c m .2 for curve 1 of Fig. 15 being 3 times the corresponding rate in Fig. 13.
T w o investigations, those of E c c h e r9 and Bestul et al.b0 have established agreement between the extrusion m e t h o d and the rotation m e t h o d , in spite of failure t o allow for the entrance pressure d r o p in extrusion; but in b o t h cases the rubber shortly before extrusion had been subjected t o large, fairly rapid deformations. T h e agreement obtained in these t w o investigations supports the v i e w that the large entrance pressure d r o p found b y M o o n e y and B l a c k39 was largely due t o t h i x o t r o p y .
Nearly all published data on rubbers obtained with compression plastom- eters consist of single-point measurements of compressed thickness and recovered thickness after a single standardized procedure. T h e viscosity can
10,
2
^ ^ ^ ^ ^
10 100 1000 C h a r a c t e r i s t i c E f f l u x , Ec
F I G. 19. Shear stress, r, in m e g a d y n e s / c m .2, vs. characteristic efflux, / τη/ ( η + 3 ) , for G R - S with various fillers. [From M . M o o n e y and S. A . B l a c k , J. Colloid Sei. 7, 204 (1952).]
C u r v e Feature M L- 4 250° η f
1 N o Filler 40 4 . 2 4 . 0 X 10~26
2 K o s m o s 40 Black 44 3.5 2 . 5 Χ 10~22
3 Shawinigan Black 49 6.4 5.1 X 10~22
4 Celite 322 50 3.5 2.8 Χ 10"22
5 Gilder's Whiting 36 3.6 1.1 X 10~22
b e c o m p u t e d from such data only if the test material is N e w t o n i a n . Ho\v- ever, a few investigations have been reported in which the compression-time curves were obtained. N o t a b l e a m o n g such investigations are those reported b y M a r t i n ,33 S c o t t ,51 and the Research Association of British R u b b e r M a n u - facturers.52 Martin, using data obtained b y V a n R o s s e m , showed that a particular sample of H e v e a at 70° C . followed closely T a y l o r ' s equation (10), based on N e w t o n i a n viscosity. S c o t t , using the plate plastometer, found that m u c h of his data required a more general equation, based on the plasticity p o w e r law of equation ( 1 1 ) . H o w e v e r , the existence of a positive yield value, Y, is later questioned, at least for unmixed rubbers, in the general discussion of plasticity measurements b y S c o t t and W h o r l o w .43 I t seems that thixotropic effects, discussed a b o v e in Section I I I , 3, were m o r e important in S c o t t ' s measurements than was realized at the time. In the a n o n y m o u s report for the Research Association of British R u b b e r M a n u - facturers52 data are reported which, when plotted, agree well in m o s t cases with equation (11) with Y = 0, that is, with equation ( 3 ) . T e s t temperature was 100° C . T h e values of the exponent η v a r y from 1.1 and 1.2, for mas- ticated H e v e a of M o o n e y viscosities 8.5 and 30, respectively, u p t o 7.2 for a G R - S carbon b l a c k mix. T h e l o w values indicate almost N e w t o n i a n b e - havior.
A m o n g the samples here referred t o is a sample of H e v e a "masticated 15
5 1 J. R . S c o t t , Trans. Inst. Rubber Ind. 7, 169 (1931).
52 Research Assoc. Brit. Rubber Mfrs. Rept. N o . 216 (1944); Rubber Chem. and Technol. 18, 877 (1945).
m i n . " of M o o n e y viscosity 54. In order to compare the rheological data on this sample with the curves of Fig. 13, the values of Y and η in the fluidity power law were c o m p u t e d b y Peek's t h e o r y .34 T h e corresponding linear graph is shown b y the dotted line in Fig. 13. T h e agreement with the curve b y S c o t t and W h o r l o w43 is g o o d ; b u t the agreement is perhaps fortuitous, since it is doubtful that the t w o samples concerned were closely alike, the milling treatments being considerably different.
T w o different studies have been reported on the viscosity of polyiso- butylene at v e r y l o w shear stresses as a function of mean molecular weight.
F o x and F l o r y53 used a coaxial falling-cylinder viscometer, while V a n H o l d e and W i l l i a m s54 used a sandwich shearing viscometer. In either of these instruments the extent of deformation is extremely limited. After allowing for elastic deformation, the observed flow was found t o be N e w t o n i a n for low molecular weight and high temperature, and non-Newtonian for high molecular weight and l o w temperature; b u t in the latter case the viscosity data extrapolated easily to a limiting finite viscosity at zero shear stress.
Results obtained in the t w o investigations were in g o o d agreement, as is shown b y Fig. 20, taken from the V a n H o l d e and Williams report. T h e vis- cosity data are best fitted b y an equation p r o p o s e d b y Leaderman et α/.55
log η = - 1 4 . 4 4 + 3.14 log Mw + .504 X 10ß/T2 (19) where Mw is the weight average molecular weight and Τ is the temperature.
T h e range in Mw is from 105 t o 106.
T h e m a n y results that have been reviewed here on the form of the flow curves for raw elastomers can be summarized in the following statements:
(1) Elastomers are non-Newtonian when examined over a wide range in rate of shear.
(2) G R - S o b e y s the fluidity p o w e r law, with n ~ 4, for shear stresses from 0.3 t o 1.5 m e g a d y n e s / c m .2 b u t shows an increase in n at higher stresses.
(3) T h e chosen samples of H e v e a show a nearly constant slope, or n, in the stress range from 3 Χ 103 t o 3 Χ 105 d y e s / c m .2, b u t a slope that increases more and more rapidly with stress at higher stresses.
(4) There are indications that H e v e a of moderate or high M o o n e y vis- cosity has an infinite slope at a finite shear stress ; and an upper limit t o the shear stress it can support.
(5) T h e heat of activation of viscous flow for H e v e a or G R - S is approxi- mately 10 k c a l . / m o l .
0 3 T . G . F o x , Jr., and P . J. î ^ o r y , Am. Chem. Soc. 70, 2384 (1948).
6 4 K . E . Van Holde and J. W . Williams, J. Polymer Sei. 11, 243 (1953); Rubber Chem. and Technol. 27, 393 (1954).
5 5 H . Leaderman, R . G . Smith, and R . W . Jones, Natl. Bur. Standards Rept. 1317, Tech. Rept. N o . 7 to Office of Naval Research Rheology of Polyisobutylene (1951).