Conductometric Analysis
B Y
Η. T. S. BRITTON
Professor of Chemistry, Washington Singer Laboratories, University College of the South West of England, Exeter
CONTENTS
Page
1. Theory and Technique 52 1.1. Electrical Conductance 52
1.1.1. Platinizing Electrodes 55 1.1.2. Removal of Platinum Black 55 1.2. Sources of Alternating Current 55
1.2.1. The Induction Coil 55 1.2.2. Vacuum Tube Oscillators 55 1.3. Conductometric Titration Cells, Cell Constants 56
1.3.1 Calibration 56 1.4. Conductivity and Equilibrium Water 58
1.5. Measurement of Conductance 59 1.5.1. Wheatstone Bridge 59 1.5.2. Null-Point Indicators 60 1.6. Special Methods of Measurement 61
1.6.1. A. C. Galvanometer Method: Thermo-Cross 61
1.6.2. Vacuum Tube Methods 61 2. Conductometric Titrations of Acids and Bases 63
2.1. Conductometric Titrations: Basic Principles 63 2.1.1. Acidimetry and Alkalimetry 63 2.1.2. Titration of a Strong Acid with a Strong Pase 65
2.2. Errors in the Titration of Strong Acids 66
2.3. Theory of Titration 66 2.3.1. Influence of Ionic Mobilities 68
2.4. Conductometric Titrations of Acids of Different Strengths with Strong
Bases 69 2.4.1. Moderately Strong Acids 71
2.4.2. Weak Acids 72 2.4.3. Very Weak Acids 72 2.5. The Titration of Weak Acids with Weak Bases 73
2.6. Titration of Mixtures of Acids and of Di- and Tribasic Acids 74
2.7. Replacement Titration Reactions 77 2.8. The Titration of Carbonic Acid 79 2.9. The Titration of Phenols in Aqueous-Alcohol Media 80
2.10. Conductometric Titration of Alkaloids and Their Salts 81
2.11. Titration of Bases with Acids 84 51
52 Η . Τ . S. B R I T T O N
Page 2.12. Conductometric Titration of Acids and Mixtures of Acids in Acetone-
Water Media 85 3. Conductometric Titrations Involving Precipitations 87
3.1. Precipitation Reactions: Theory 87 3.2. Selection of Titrant and Angle at Equivalence Point 89
3.3. Errors in Precipitation Titrations 93 3.4. Precipitants Containing Precipitating Cations 93
3.4.1. A g N 03 93
3.4.2. P b ( N 03)2 94
3.4.3. Ba(OOCCH3)2 and BaCl2 95
3.5. Estimation of Sulfate in Drinking Water 96 3.6. Estimation of Free and Combined Sulfurous Acid in Calcium Bisulfite
Solutions 96 3.7. Precipitants Containing Precipitating Anions 97
4. Conductometric Titrations with Mercuric Perchlorate 98
References 102
1. T H E O R Y A N D T E C H N I Q U E
1.1. Electrical Conductance
If two platinum electrodes of the same size a n d shape are placed immediately opposite to one another in a solution of an electrolyte they will enclose a volume of solution, the electrical resistance, R ohms, of which will be determined b y :
(i) t h e distance, I cm., between the electrodes, (ii) the area, a sq. cm., of one electrode, (iii) the concentration, c of the electrolyte,
(iv) the degree of ionization and the ionic mobilities, (v) the temperature.
T h e true resistance, R = ρ -> where p, the proportionality factor is the a
specific resistance, i.e., the resistance of a unit cube, 1 c c , of the solution when electricity passes directly through it from face to face. According to Ohm's law, the current, i, is equal t o E/R} Ε being t h e potential difference (volts) between the two electrodes. Confining our a t t e n t i o n to the unit centimeter cube of resistance, ρ ohms, and letting t h e potential difference between t h e two opposite faces be 1 volt, we find t h a t t h e current which passes through t h e cube is 1/p amperes. This is t h e specific conductance, κ, i.e., κ = 1/p amperes. As specific conductance is the reciprocal of t h e specific resistance, it is therefore only necessary t o measure the specific resistance, the reciprocal of which gives the specific conductivity in amperes. As the specific resistance is measured directly
1
in ohms, the specific conductivity is assigned the unit ^ Qyim 0 Γ 1 reciprocal ohm, 1 r.o., 1 mho. These units are actually amperes.
CONDUCTOMETRIC ANALYSIS 53
T h e equivalent conductivity, Ac = KE X 1000
Ι where K C is t h e specific c
conductivity of a solution which contains c gram-equivalents of elec
trolyte per liter. I t was originally introduced to give t h e specific con
ductance of a solution in each cubic centimeter of which 1 gram-equivalent of electrolyte is dissolved. Kohlrausch, however, found t h a t t h e equiva
lent conductivity varies with t h e concentration, so t h a t Ac indicates t h e specific equivalent conductivity computed from t h e observed specific conductivity, K C, of a solution of concentration, c.
According t o t h e Arrhenius t h e o r y of incomplete ionization, which, although largely discredited still provides a satisfactory basis for t h e Ac s t u d y of conductometric titrations, t h e degree of ionization, a = —
Λ0
where A0 is t h e so-called equivalent conductance a t infinite dilution, or zero-concentration, which is found b y extrapolation of t h e equivalent conductance a t low concentrations b y means of t h e Kohlrausch square root law.
F o r an electrolyte, Β A ^± B+ + A~y Kohlrausch's law of independent migration holds, i.e.,
where lB- a n d 1* represent t h e equivalent conductivities of t h e respective ions, B' a n d A', b u t which are more generally known as ionic mobilities.
According t o t h e Arrhenius theory these ionic mobilities are independent of t h e concentration, b u t though this is n o t quite true, their slight varia
tions will n o t invalidate t h e fundamental theory of conductometric titrations.
I n a t t e m p t i n g t o measure t h e resistance of a solution b y passing direct current t h r o u g h it, substantial sources of error m a y arise owing t o t h e polarization of t h e electrodes through t h e occurrence of electrolysis a n d the consequent setting u p of cathodic a n d anodic processes which m a y even involve electrodeposition or electrodissolution. T o minimize this risk, Kohlrausch employed a n alternating current of high frequency.
According t o Kohlrausch a n d Holborn (39), t h e passage of an alternating current, i, between t h e electrodes is determined b y :
and therefore
Ao = IB- + IA'
Ac — α(1β' 4- ΙΑ')
Eo sin pt - Ri + PJidt where Ε ο = maximum e.m.f. applied,
Ρ = the polarization e.m.f. and
^- = the frequency of the alternations.
54 Η. Τ. S. BRITTON
F r o m this expression, it can be shown t h a t the a p p a r e n t resistance is equal to
so t h a t if t h e m e t h o d of measurement can be arranged such t h a t P2/p2R2 becomes negligible when compared with unity, t h e n t h e apparent resist
ance becomes equal t o the t r u e resistance, R. T o do this the polarization, Ρ, m u s t either be eliminated altogether or else reduced to a m i n i m u m ,
ρ
a n d t h e frequency, ^ m u s t be as high as possible.
T o reduce t h e polarization to negligible dimensions: (1) high fre
quencies are necessary, b u t if t h e y are increased m u c h beyond 1000 c.p.s. errors due t o capacity a n d inductance m a y become appreciable;
(2) relatively large electrodes are an a d v a n t a g e . T h e y m a y be m a d e effectively larger b y depositing on t h e m adherent coatings of either p l a t i n u m or palladium black, the l a t t e r being preferred b y some when dealing with solutions of high concentrations. Kohlrausch a n d Holborn consider t h a t polarization effects become negligible when t h e resistance t o be measured is less t h a n 5 0 / ( a r e a of t h e platinized electrode) ohms.
T o obtain an accuracy of 0 . 1 % with bright unplatinized p l a t i n u m elec
trodes t h e limiting resistance, R, is given b y 2500/(area of electrode).
I t is i m p o r t a n t t h a t , if t h e specific conductance of t h e solution should be less t h a n 4 Χ 10~4 r.o., polarization m u s t be avoided, as its presence will lead to a poor a n d indistinct null point. If a telephone be employed the m i n i m u m noise will extend over a considerable range of t h e W h e a t - stone bridge wire a n d even when the point of m i n i m u m noise is located t h a t point will not be t h e same as the one obtained when polarization is absent.
P a r k e r (51) maintains t h a t the distance between t h e electrodes is a m a t t e r of importance a n d suggests t h a t the expression:
should be satisfied in the case of platinized platinum electrodes in the construction of conductivity cells.
I n some solutions t h e use of p l a t i n u m black on the electrodes has deleterious effects which m a y be caused b y (a) catalytic activity, though this is reduced b y using high frequencies, (b) adsorption, (c) errors produced b y t h e retention of electrolytes of previous solutions, while in conductometric titrations such retention might cause a lag in t h e indica
tion of accurate conductances which, with dilute solutions, m a y be R = 160 Vdistance (cm.)
area of electrode (cm.2)
CONDUCTOMETRIC ANALYSIS 55 appreciable. I n ordinary titrimetric work adsorption errors are usually very small. T o minimize such errors Whethago. advocates t h e use of gray p l a t i n u m electrodes which are prepared b y heating p l a t i n u m black electrodes t o dull redness (76).
1.1.1. Platinizing Electrodes. T h e bright p l a t i n u m electrodes are thoroughly cleaned in a w a r m solution of potassium dichromate and concentrated sulfuric acid, followed b y several washings with distilled water. T h e platinizing solution (Lummer a n d K u r l b a u m , 1895) contains 3 g. platinic chloride a n d 0.02-0.03 g. lead acetate per 100 cc. water. T h e electrodes are placed in t h e solution in an inclined position t o enable bubbles of gas t o leave t h e electrodes as soon as t h e y are formed, and electrolysis is allowed t o occur, using two lead accumulators and a resistance adjusted t o permit a m o d e r a t e evolution of gas only. T h e current is reversed every half m i n u t e a n d electrolysis is allowed to proceed for 10-15 minutes, when a good black velvety coating of platinum black should h a v e been deposited on each electrode.
Adsorbed substances, e.g., chlorine, are removed from the electrodes by electrolyzing in either dilute sulfuric acid solution or one of sodium acetate for £ hour, reversing every m i n u t e .
T h e electrodes are washed with distilled water a n d finally with
" c o n d u c t i v i t y w a t e r " a n d k e p t therein until required. T o test t h e electrodes it is advisable t o use t h e m in repeated determinations of t h e conductance of " c o n d u c t i v i t y w a t e r " until reproducible d a t a are obtained.
1.1.2. Removal of Platinum Black. This is best done by electrolysis in a q u a regia for a few minutes, with current reversal every m i n u t e until bright* surfaces are obtained.
1.2. Sources of Alternating Current
1.2.1. The Induction Coil, Although t h e induction coil h a s been used extensively in t h e past, it is being superseded b y v a c u u m t u b e oscillators. I t is noisy a n d m u s t be placed some distance from t h e measuring a p p a r a t u s if induction effects are t o be avoided. T h e noise can be reduced b y inserting a resistance in its p r i m a r y circuit. T h e chief disadvantage of the induction coil is t h a t t h e alternations produced are unsymmetrical a n d possess a definite unidirectional component. T h e induction coil described b y Kohlrausch consists of a soft iron core, 8 cm. b y 1 cm., a p r i m a r y of 200 t u r n s of 0.5 m m . copper wire a n d a secondary of 2000 t u r n s of 0.25-mm. copper wire. I t is fitted with a Neeff h a m m e r , t h e contacts of which should be of platinum.
1.2.2. Vacuum Tube Oscillators. These are now generally available a n d can be obtained from scientific i n s t r u m e n t makers. T h e y h a v e been
5 6 Η. Τ. S. BRITTON
widely adopted for conductometric titrations. T h e y h a v e t h e distinct a d v a n t a g e t h a t t h e frequency of t h e A.C. can be varied a t will while making conductance measurements. If polarization of t h e conductivity cell has been eliminated, t h e n t h e observed resistances should be inde
pendent of t h e frequencies of t h e A.C. used a n d t h e oscillator t h u s makes it possible t o prove a t a n y time t h a t t h e measuring a p p a r a t u s is in good working order. Oscillators should be thoroughly screened a n d grounded.
Sometimes it is found t h a t interchanging t h e connections from an oscilla
tor to a W h e a t s t o n e Bridge m a y result in a change in t h e position of balance. T h i s m a y be caused b y differences in capacity between t h e oscillator a n d its leads t o g r o u n d ; if this should be so t h e error can be eliminated b y inserting a small variable condenser between one lead wire a n d ground a n d varying t h e capacity until no difference in t h e null point occurs whichever w a y t h e oscillator is connected t o t h e bridge. When an oscillator is used for highly resistant solutions, e.g., dilute nonaqueous solutions, it will be necessary t o balance accurately not only t h e resist
ances b u t t h e capacities in t h e W h e a t s t o n e bridge circuit. E x c e p t for titrimetric work in nonaqueous media this will usually be unnecessary.
F o r details of constructing oscillators t h e original literature m u s t be consulted (14, 24, 25, 28, 34, 36, 59, 60, 70, 77).
1.8. Conductometric Titration Cells, Cell Constants
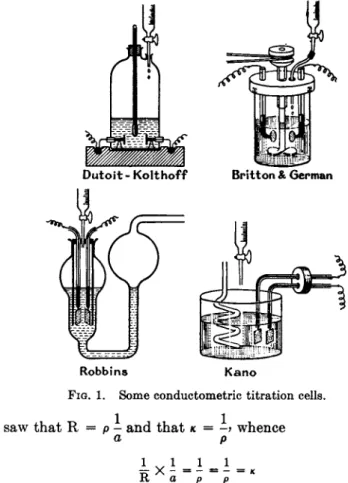
I n m a k i n g cells it is essential t h a t vessels of insoluble glass, viz., borosilicate glass of t h e Pyrex or J e n a t y p e , should be used a n d t h e two electrodes, each a b o u t 1 sq. cm. in area, should be securely placed a t a suitable distance apart. Larger electrodes m a y be used with a d v a n t a g e . T h e distance between t h e electrodes is determined b y t h e conductance of t h e solutions t o be t e s t e d ; if t h e conductance is low t h e electrodes should be closer t o one another t h a n when highly conducting solutions are involved. I n a n y case t h e p l a t i n u m electrodes should be sufficiently thick t o be rigid, a n d t h e y should be so m o u n t e d t h a t t h e distance between t h e m is absolutely fixed a n d is n o t affected b y a n y mechanical agitation of t h e solution. A m e t h o d of m a k i n g electrodes rigid is t o back a n d m o u n t t h e m on glass plates. T y p e s of conductometric titration cells are illustrated in Fig. 1 (9,18, 37, 40, 63, see also 57).
1.8.1. Calibration. I n t h e foregoing discussion we h a v e said nothing a b o u t t h e precise dimensions of t h e electrodes a n d their exact distance a p a r t . Instead, we use electrodes of such size a n d in such relative positions t h a t lead t o t h e most accurate conductivity measurements.
Provided the electrode system is of rigid construction it is possible to calibrate t h e cells b y inserting in t h e m accurately prepared solutions of potassium chloride, t h e specific conductances of which h a v e been deter-
CONDUCTOMETRIC ANALYSIS 57
Dutoit - Kolthoff Britton & German
Rob bins K a n o FIG. 1. Some conductometric titration cells.
We saw t h a t R = ρ - a n d t h a t κ = -J whence a ρ
is, α ρ p
As I and a are of a n y convenient m a g n i t u d e a n d are, moreover, probably incapable of precise measurement, - is p u t equal to C, t h e cell constant,
a
i.e., ^ X C = κ whence C = κ X R. If, therefore/ one of t h e KC1 solutions given in Table I is inserted in the cell, t h e resistance, R, of the volume of solution between t h e electrodes can be directly measured, and as the specific conductance, κ, is known, the cell constant, C, can be calculated. If t h e electrode system remains undisturbed a n d a solution of u n k n o w n conductance is placed in t h e cell, it follows t h a t t h e recip- mined b y Kohlrausch, P a r k e r a n d P a r k e r (52) a n d Jones a n d Bradshaw (35) with exceptional precision.
Table I records t h e specific conductances reported b y P a r k e r and Parker.
5 8 Η. Τ. S. BRITTON
rocal of its resistance multiplied b y t h e cell constant will give its specific conductance. F o r analytical work a knowledge of t h e cell constant m a y not be needed, b u t it will be required when it is desired t o interpret t h e precise conductivities prevailing during a conductometric titration.
TABLE I
Specific Conductances of Solutions of KCl at Various Temperatures
G. KCl in 1000 g. H20 76.6276 7.47896 0.746253 Sp. g. of solution at 0°C. 1.0480 1.00489 1.00037 Temperature, °C. Specific conductances, κ mhos.
0 0.06510 0.007130 0.0007728 5 0.07388 0.008206 0.0008920 10 0.08289 0.009316 0.0010151 15 0.09213 0.010460 0.0011422 18 0.09779 0.011164 0.0012202 20 0.10161 * 0.011639 0.0012731 25 0.11132 0.012852 0.0014079 30 0.12127 0.014100 0.0015466
I n determining t h e cell constant it is advisable t o select a K C l solution which has a specific conductance comparable with those of solutions undergoing test.
1.4- Conductivity and Equilibrium Water
F o r conductometric work involving strong electrolytes, solutions prepared with good distilled water will be satisfactory, b u t if weak electrolytes are involved, a purer water will be desirable. T h e chief impurity in distilled water is carbon dioxide, although water exposed to the air of chemical laboratories will often contain ammonia a n d possibly hydrogen chloride a n d sulfur dioxide, while water stored in soda-glass vessels will contain traces of alkali. W a t e r so contaminated is generally unsuitable.
According t o Kendall (38) water having a specific conductance of ca.
0.8 X 10~e m h o a t 25° m a y be regarded as a solution of carbon dioxide t h a t is s a t u r a t e d under the partial pressure of carbon dioxide normally present in the atmosphere. W a s h b u r n (73) calls such water "equilibrium water" whereas t h e κ of "ultra pure conductivity water" is less t h a n 0.1 X 10~6 mho. F o r conductometric work "equilibrium w a t e r "
should be used. Stills for the preparation of equilibrium water h a v e been described (2, 3, 4, 48, 66, 71, 72, 75).
CONDUCTOMETRIC ANALYSIS
1.5. Measurement of Conductance
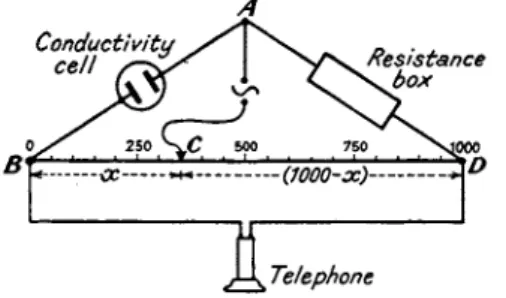
1.5.1. Wheatstone Bridge. F o r general conductometric analysis t h e simple W h e a t s t o n e meter bridge with which a low resistance earphone is used as the null-point indicator will be satisfactory. T h e earphone indicator is necessary because A.C. h a s t o be employed (Fig. 2). If increased accuracy is needed t h e m e t e r wire can be effectively lengthened b y inserting a resistance coil a t each end, preferably wound with t h e same wire as t h a t used in t h e construction of t h e bridge wire; t h e resistance of each coil being exactly 4^ times t h a t of t h e bridge wire. T h e effect of inserting these two coils will be t o convert t h e length of t h e bridge from 1 meter to 10 meters a n d in so doing each millimeter of t h e extended wire
A
Telephone
FIG. 2. Wheatstone bridge method of measuring electrical conductance.
will correspond to one-tenth of t h e resistance indicated b y t h e same length when t h e extension coils are omitted. As T a b l e I shows, t e m p e r a t u r e has a considerable effect on conductivity so t h a t when a conductometric titration is t o be performed for purely analytical reasons, it will suffice if it is carried out in a room in which t h e t e m p e r a t u r e is sensibly constant, b u t if it is desired t o interpret t h e precise conductivities set u p a t different stages of t h e titration, t h e conductivity cell should be inserted in a carefully controlled t h e r m o s t a t .
B y removing a resistance plug from t h e box in t h e a r m AD which is of similar m a g n i t u d e t o t h a t of t h e cell, r, a n d t h e n moving t h e sliding contact, C, m i n i m u m noise will be heard in t h e earphone when C is some
where near t h e middle of t h e wire BD. If BD is of uniform resistance t h r o u g h o u t its whole length, then
Resistance of conductivity cell _ £ _ BC _ χ Resistance in box R ~ CD ~~ 1000 — χ
where χ is the n u m b e r of scale divisions represented b y BC, BD represent
ing 1000 divisions. Hence t h e " a p p a r e n t " specific conductance _ 1 _ 1000 - χ 1
" r " χ R
59
60 Η. Τ. S. BRITTON
and as the cell-constant is C, t h e t r u e specific conductance, 1000 - χ „ C
K χ R
F o r analytical work only, it is unnecessary t o calculate κ for each addition of t i t r a n t , b u t merely t o plot (it being directly propor-
*c tional t o κ) against t h e volume of t i t r a n t added.
If t h e m i n i m u m noise given b y t h e earphone is easily detectable, it can be safely assumed t h a t errors, which m a y enter into conductivity measurements, h a v e been eliminated.
I t is i m p o r t a n t t h a t t h e smallest current should be employed. Large currents, especially if t h e electrodes are close t o one another, are a p t t o heat t h e enclosed liquid a n d t h e r e b y lead t o errors, a point which h a s to be borne in mind when visual i n s t r u m e n t s are used as null-point indicators.
Capacity effects m a y interfere with t h e location of t h e balance point.
T h e y can be largely eliminated b y connecting a variable condenser across either the conductivity cell or t h e resistance box, i.e., in parallel, and varying its capacity in conjunction with t h e sliding contact until the least sound is heard. Usually this is an unnecessary refinement.
A direct m e t h o d of measuring t h e resistance, r, of t h e conductivity cell is to use two fixed equal resistances, say 100 ohms, in place of t h e two sections of t h e meter wire a n d t o dispense with t h e sliding contact. In the third a r m of t h e W h e a t s t o n e bridge network, place t h e conductivity cell, a n d in t h e fourth arm, a resistance box having four rheostats, viz., 0-12 ohms, g r a d u a t e d in t e n t h s ; 0-10 ohms, g r a d u a t e d in o h m s ; 0-100, in 10 ohm steps; and 0-1000 in 100 ohm steps. T o balance the bridge the pointer of the first rheostat is set at, say, 6 ohms a n d t h e pointers of the other rheostats rotated until minimum noise is heard; the balance is then completed by rotating t h e first dial until the true minimum noise is obtained. T h e resistance indicated by the dials of the resistance box m u s t be t h a t of t h e cell (62).
1.5.2. Null-Point Indicators: a. Earphones. T h e telephone is prob
ably t h e most accurate null-point detector in t h a t with it t h e smallest currents can be used t o operate t h e W h e a t s t o n e bridge, t h e r e b y avoiding m a n y errors t h a t are inherent in t h e employment of larger currents. I t s sensitiveness can be enhanced if t h e frequency of its diaphragm is t h e same as t h a t of t h e A.C. used, preferably 1000 c.p.s. T u n a b l e earphones m a y be obtained commercially. B y using a t u b e amplifier, Jones a n d Josephs (36), were able t o measure resistances u p t o 60,000 ohms. Loud
speakers h a v e also been employed (25).
CONDUCTOMETRIC ANALYSIS 61 b. A.C. Galvanometers. These i n s t r u m e n t s necessitate t h e use of appreciable alternating currents b u t t h e y h a v e nevertheless received m u c h a t t e n t i o n during the last sixty years. J a n d e r a n d Schorstein (33) have, however, applied t h e m t o conductometric t i t r a t i o n s successfully.
1.6. Special Methods of Measurement
Various m e t h o d s h a v e been devised b y which t h e alternating current, which ordinarily passes through t h e indicating i n s t r u m e n t of t h e W h e a t - stone bridge, m a y be rectified a n d t h e n m a d e t o operate D . C . instru- m e n t s . T h u s a crystal detector (31) h a s been used t o operate a D . C . galvanometer a n d a copper-cuprous oxide-lead rectifier (27) has been used in conjunction with a microammeter. Another ingenious m e t h o d of J a n d e r a n d Pfundt (32), is one in which t h e p r i m a r y coil of a t r a n s - former takes t h e place of t h e earphone. T h e secondary coil is connected with t h e two ends of a short constantin wire a t t h e middle of which is a t t a c h e d a n iron wire in t h e form of a cross which is enclosed in an atmosphere of hydrogen. A sensitive galvanometer is connected t o t h e constantin a n d iron wires, t h e galvanometer circuit t h u s including t h e constantin-iron junction. As t h e h e a t generated in t h e constantin wire is proportional t o t h e square of t h e current, it follows t h a t when t h e bridge is nearly balanced, very little h e a t will be developed a n d so t h e Thermo-Cross (as it was designated b y J a n d e r a n d Pfundt) is not very sensitive in t h e region of t h e null point. I n consequence, bridge readings on each side of t h e balance point are t a k e n a t points t h a t give equal deflections of t h e galvanometer; t h e null point is assumed t o be t h e m e a n of these t w o values.
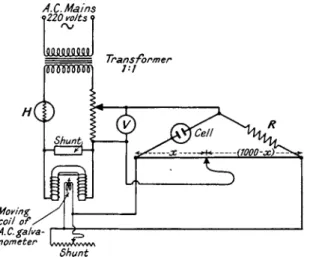
1.6.1. A.C. Galvanometer Method: Thermo-Cross. T h e circuit used by J a n d e r a n d Schorstein is given in Fig. 3. T h e m e t h o d m a k e s use of t h e exceedingly sensitive A.C. galvanometer described b y Weibel (74) a n d Gollnow (26).
B y varying t h e comparison resistance, R, b o t h well-conducting a n d poorly-conducting solutions m a y be t i t r a t e d . As a source of A.C. t h e main supply is connected directly t o t h e p r i m a r y coil of a 1:1 transformer a n d t h e alternating current in t h e secondary is reduced t o 110 volts b y passing t h r o u g h a n " i r o n - h y d r o g e n " resistance. I t t h e n excites t h e electromagnet of t h e A.C. galvanometer across which a s h u n t is placed.
T h e A.C. to operate t h e W h e a t s t o n e bridge is t a p p e d off from a poten- tiometer which is inserted in t h e lead from t h e secondary coil a n d regu- lated b y m e a n s of a voltmeter, V.
1.6.2. Vacuum Tube Methods. As a rule these m e t h o d s are based on t h e principle employed b y Treadwell a n d J a n e t t (68) in 1923 t o carry out conductometric titrations of alkaloids with hydrochloric acid.
62 Η. Τ. S. BRITTON
T h e y used t h e W h e t h a m c o m m u t a t o r for the dual purpose of passing A.C. through the conductivity cell a n d rectifying t h e A.C. therefrom in order t o a c t u a t e a millivoltmeter. T h e c o m m u t a t o r gave alternations of 4 - 8 per second and the current was a few milliamperes with an e.m.f.
of 8 volts.
FIG. 3. Jander and Sehorstein's method of conductometric titration using an alter
nating current galvanometer.
I n 1925 Treadwell and Paoloni (69) substituted a v a c u u m t u b e for the c o m m u t a t o r and placed the conductivity cell in t h e grid circuit t h r o u g h which A.C. from t h e mains \vas passed. Figure 4 depicts Callan a n d Horrobin's (15) modification of their circuit in which a step-down t r a n s -
FIG. 4 . Treadwell-Callan-Horrobin's circuit for conductometric titrations, using vacuum tube and millivoltmeter.
former is placed across t h e main supply in order t o give A.C. at 8 volts.
Sufficient negative grid bias is provided t o bring t h e variation in voltage t o the " b e n d " in t h e characteristic curve of t h e valve and away from t h e straight section of t h e curve. T o bring t h e readings during a titra
tion within t h e range of t h e millivoltmeter in t h e anode circuit either
A.C. Mains 9220 volts ?
Moving / \ coil o f / J I A.C.galva- I 1 nometer lwwXww\
Shunt
C O N D U C T O M E T R I C A N A L Y S I S 63 the resistance, R, or t h e resistance, R2, m a y be adjusted, or else t h e steady anode current t h r o u g h t h e millivoltmeter m a y be. balanced out initially and t h u s allow only t h e variations caused b y t h e changing resistance of t h e conductometric cell in t h e grid circuit t o be indicated b y t h e milli
voltmeter (cf. 21).
Circuits which employ crystal detectors a n d dry rectifiers instead of valves (15, 56) have also been described.
An a p p a r a t u s embodying a W h e a t s t o n e bridge circuit with v a c u u m t u b e amplification-in which a cathode-ray tube, k n o w n as the " m a g i c eye," is incorporated as t h e null-point indicator is now available com
mercially. I t is particularly serviceable in conductometric titrations.
2. C O N D U C T O M E T R I C T I T R A T I O N S O F A C I D S A N D B A S E S
2.1. Conductometric Titrations: Basic Principles
2.1.1. Acidimetry and Alkalimetry. If t o a solution of a strong acid, a solution of a n alkali is added in small volumes a n d after each addition either t h e specific conductance or some other q u a n t i t y ^e.g., ~ — ~ — which is directly proportional t o t h e specific conductance) be measured, it will be found t h a t t h e conductance will rapidly fall t o a m i n i m u m value a n d t h a t immediately afterwards each fresh addition of alkali will cause a further increase in conductance. T h e alkali which produced t h e m i n i m u m conductance will be t h a t required t o neutralize t h e a m o u n t of acid originally present in t h e solution. B u t unless special precautions h a v e been t a k e n regarding the concentrations of t h e acid a n d alkali solutions used, neither t h e initial decrease in conductance nor t h e sub
sequent increase will be represented b y straight lines when the con
ductance is plotted against t h e volume of titrant added. Lack of recti- linearity would t h u s render it difficult t o locate t h e position of t h e end point b y producing t h e initial a n d final curves t o t h e point of intersection.
F o r this purpose, then, it is imperative t h a t wherever possible in con
ductometric analysis, changes in conductance should be represented b y straight lines.
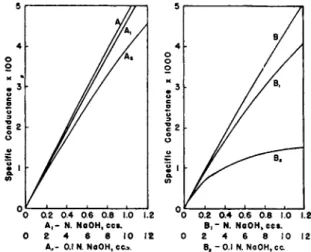
Figure 5 shows t h e relationship a t 25°C. between t h e specific con
ductance and concentration (in gram equivalents per liter) of three typical strong electrolytes from 0 t o 0.1 ΛΓ, which is the range of con
centration usually encountered in titrimetric work. I t will be noticed t h a t the graphs are almost rectilinear, from which it follows t h a t t o obtain straight line relationships it will be necessary t h a t each addition of t i t r a n t should be m a d e in such a way t h a t t h e volume added is directly proportional t o t h e concentrations of t h e acid a n d t h e salt formed in t h e first p a r t of the titration, a n d to those of t h e salt a n d t h e excess of alkali
64 Η. Τ. S. BRITTON
added after the end point h a s been passed. I n Fig. 6 curve A represents the specific conductances of solutions of sodium hydroxide t h a t contain the volumes of sodium hydroxide indicated b y t h e abscissae in each 100 ml. As t h e final volume is t h e same in each case, then t h e volumes of
4 0
ο § 3 0
5 2 0 r
10 -
1 1 1
0.02 0 . 0 4 0 . 0 6 0 . 0 8 0. 1 Concentration: Gm. Equivalents/Lltor
FIG. 5. The approximate rectilinear relationship between specific conductance and concentration.
normal sodium hydroxide (or 0.1 iV N a O H ) are directly proportional to the respective concentrations a n d consequently A is a straight line. T o keep t h e total volume constant during a single titration, however, is not
A ,- N . NoOH.cc». Β , - N . NoOH.ccs.
0 2 4 β 8 1 0 1 2 0 2 4 6 8 1 0 1 2
A ,- 0. 1 Ν. NaOH, cc> . B ( - 0. 1 N . NaOH, c c
FIG. 6. To show that the rectilinear relationship can be maintained by using a titrant of a suitable concentration.
practicable. T h e nearest approach t h a t can be m a d e is t o carry out t h e titration with a relatively large volume of a dilute solution a n d t o use a concentrated solution of t h e t i t r a n t so t h a t t h e total volume of t h e
CONDUCTOMETRIC ANALYSIS 6 5
reacting solutions change b u t little as t h e titration proceeds. Curve Ai shows t h e effect of adding 1.3 ml of Ν N a O H to, 100 ml. of water, the volume thereby changing from 100 t o 101.3 ml. Curve A2 refers t o t h e addition of t h e same weight of caustic soda t o 100 ml. of water, b u t being added as 0.1 Ν N a O H , 13 ml. were necessary, whereby t h e volume changed from 100 t o 113 ml. Whereas Ai is straight, A2 is slightly curved. I n t h e case of A2, owing t o t h e progressively large increase in total volume, t h e volume of 0.1 Ν sodium hydroxide added is n o t propor
tional t o t h e concentration of alkali in t h e resulting solution.
Curves B, Bi a n d B2 are comparable with t h e exception t h a t they refer t o 10 ml. instead of 100 ml., as for t h e A curves. T h u s B i refers t o
ο ι NaOH, Equivalents
FIG. 7. Conductometric titration of a very dilute solution of hydrochloric acid with a concentrated solution of sodium hydroxide.
t h e addition of 1.3 ml. of 1 Ν sodium hydroxide to 10 ml. of water, a n d a consequent change in volume from 10 ml. t o 11.3 ml., an increase of 13%, whereas B2 refers t o t h e addition of 13 ml. of 0.1 Ν sodium hydrox
ide t o 10 ml. of water b y which t h e t o t a l volume increases b y 130%, i.e., from 10 t o 23 ml. Curves B i a n d B2 are appreciably curved, t h e curva
ture of B2 being greater t h a n t h a t of Bi owing t o t h e greater increase in volume. In general, the concentrations of the reactants should be so chosen that the increase in volume of the mixed solutions should not exceed 5%.
2.1.2. Titration of a Strong Acid with a Strong Base. Figure 7 illus
trates t h e t y p e of conductometric graph obtained b y t i t r a t i n g 100 ml.
of approximately 0.01 Ν hydrochloric acid with 1 Ν sodium hydroxide;
the endpoint being reached when ca. 1.0 ml. of alkali h a s been added.
For the complete titration only 2 ml. of alkali are required, so t h a t t h e effect of dilution becomes negligible. B u t so small a titer can be accu
rately found only b y using a good microburet. An accurate b u r e t having
66 Η . Τ . S . Β Μ Ί Τ Ο Ν
1 ml. scale divisions 5-cm. a p a r t , a n d reading t o 0.01 ml. is necessary.
F u r t h e r m o r e , it is essential t h a t t h e solution undergoing titration be thoroughly stirred before each conductance reading is m a d e .
2.2. Errors in the Titration of Strong Acids
a. Dilution. Righellato a n d Davies (62) point out t h a t if the usual assumption be accepted regarding t h e graphical extrapolation of the end point when t h e concentration of the t i t r a n t is 10 times t h a t of t h e solution being t i t r a t e d t h a t t h e end point in conductometric titrations m a y occur 2 % too early. T h u s if 100 ml. of 0.01 Ν hydrochloric acid were t i t r a t e d with 0.1 Ν sodium hydroxide t h e end point would occur a t a b o u t 9.8 ml. instead of a t 10 ml. T h a t such an error might arise becomes obvious from the lack of rectilinearity of A2 in Fig. 6, for if the alkali curve obtained after passing the end point of the titration were considered to be straight in such circumstances, a n d then produced t o intersect t h e neutralization line, a n d the end point were assumed to be indicated b y the point of intersection, t h e titer would certainly be too low. Working on the assumption t h a t , within the range of concentra
tions involved in a titration t h a t necessitates a 1 0 % dilution, the specific conductance is directly proportional t o t h e concentration they correct for dilution b y multiplying each observed conductance b y the factor:
Total volume of the solution corresponding to that measurement Initial volume of the solution to be titrated
Such a correction is sufficient for practical purposes, despite the fact t h a t it ignores a n y slight changes in ionic mobilities due to t h e diffusion of the ionic atmospheres as postulated b y D e b y e a n d Huckel.
b. Presence of Carbon Dioxide. If "equilibrium w a t e r " is used and the alkali is free from carbon dioxide, errors will, of course, not be caused b y carbon dioxide. B u t if carbon dioxide be present P o e t k e (55) states t h a t such errors will be negligible in the titration of a strong acid with a strong base, b u t t h a t when carried out in t h e reverse m a n n e r t h e end point will appear too early a n d in place of a sharp " b r e a k " t h e titration graph will be curved in the vicinity of the end point. I n titrating weak acids with alkali, carbon dioxide will lead to too high titers a n d to too low titers when the titration is carried out in the reverse way.
2.8. Theory of Titration
As the sodium hydrochloride is added to the hydrochloric acid the hydrogen ions are progressively replaced by sodium ions:
H- + CI' -f Na- + OH' -> Na* + CI' + H20
so t h a t when the equivalence point is reached the replacement is complete
CONDUCTOMETRIC ANALYSIS 6 7
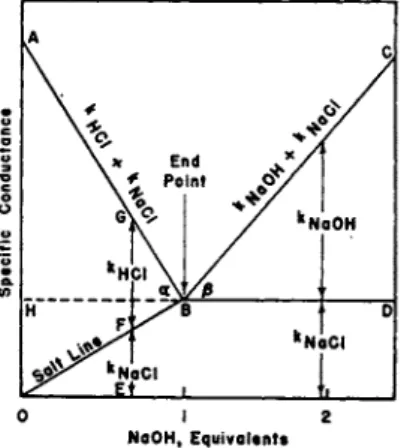
a n d only t h e ions of sodium chloride remain. T h e line OB, called t h e
" s a l t l i n e " represents t h e increase in conductance due t o the increasing concentration of sodium chloride whereas t h e vertical distance between A Β a n d OB corresponds t o t h e conductance caused b y t h e decreasing concentration of hydrochloric acid. BD indicates the contribution b y the sodium chloride t o t h e t o t a l conductance after t h e end-point, B, is passed, whereas BC represents t h e contribution t o t h e conductance m a d e b y t h e excess of sodium hydroxide.
T h e diminution in conductance, indicated b y AB, is caused b y t h e removal of t h e highly mobile hydrogen ions a n d t h e substitution of t h e m u c h less mobile sodium ions. T h u s t h e equivalent conductance, AC e, of a solution of hydrochloric acid containing Ca gram equivalents per liter is related to t h e ionic mobilities, ZH- a n d ZC1,:
. lOOOKq / / . I N
= —C— = A"H* ' ^
κα being t h e specific conductance a n d a the degree of ionization. As the solutions t h a t are conductometrically t i t r a t e d are preferably very dilute, we can p u t a = 1, whence
K a = ϊϋδο x ^H *c l
Similarly for sodium chloride solutions, . 1000κ8
Ac. = — £ — = a(tNa* + tci') so that Ka = J Q 5 Q X (Z NB* + hi')
As both acid a n d salt are present during neutralization, t h e concentration of acid, C0, will decrease a n d t h e r e b y produce a decrease in its specific conductance, κα, while t h a t of t h e salt formed, C8, will increase with a corresponding increase in κ8, as shown b y t h e " s a l t line." A t a n y point, E, the observed specific conductance κ will be equal to κα + κ8, i.e., to EG =GF + FE in Fig. 7. Hence
Κ = Κα + Κ, = (In' 4" Id') 4" ( W "f 2C»')
= j^QQ ( WH- + WN . - + (Ca 4- Ce).fcl'I
If the initial concentration of t h e hydrochloric acid be C, a n d if we can ignore the small dilution that occurs in a titration, t h e n C = Ca + C8) so t h a t when the fraction of hydrochloric a n d neutralized is x, t h e n C8 = xC, a n d Ca = (1 — x)C, whence it follows t h a t
6 8 Η. Τ. S. BRITTON
showing t h a t t h e difference, AH, between t h e specific conductance observed a t t h e beginning of a titration a n d a t t h e end point, i.e., when χ = 0 a n d χ = 1, is equal t o
C
1000 X (In' — JNa' )
T h e slope of the neutralization graph A S is t a n a = jj^> a n d if t h e AH titer, 01, ( = Η Β) be expressed in t e r m s of t h e concentration, C, t h e n
t a n « = ( i H - - W ) - i ^ / c = ^ - Z - T h e slope of t h e alkali graph, BC, is
^Na* 4" low
1000
tan β =
1000
i.e., provided t h a t the dilution is negligible a n d t h e extended " s a l t line,"
BD, remains horizontal t o t h e x-axis, the increase in conductance t h e n resulting from t h e increasing excess of alkali added. If appreciable dilution occurs BD will slope downwards towards t h e rc-axis a n d t h e slope of BC will be accordingly reduced.
2.3Λ. Influence of Ionic Mobilities. As ionic mobilities, or more precisely, the equivalent conductances of ions, are of fundamental importance in conductometric titrations, Tables I I a n d I I I are inserted to show t h e magnitudes of the mobilities of ions a n d their great depend
ence on t e m p e r a t u r e .
TABLE II
Ionic Mobilities at 18 and 25°
Rations Anions
Ion
Temperature
Ion
Temperature Ion
18° 25°
Ion
18° 25°
H" 316.6 349.7 OH' 175 196
Li* 33.3 38.7 CI' 65.5 76.6
Na* 43.5 50.1 Br' 67.6 77.7
κ · 64.4 73.5 Γ 66.1 —
N H4 64.4 74.8 CNS' 56.5 —
Ag' 54.4 61.9 N 03' 61.8 71.4
JCa" 51 61 i S O / ' 68 80
JSr" 51 61 JC2O4" · 63.0 73.5
iBa" 55 65 J C O 3 " 70.0 83.3
JPb- 60.8 71.2 HCXV 40.5 47.0
iMg" 45 53 Ο Η 3 θ Ο Ο/ 35.0 40.8
| Z n - 46 54 K > 04" 72 —
C O N D U C T O M E T R I C A N A L Y S I S 69 TABLE III
Ion 0° 18° 25° 50° 100°
Η" 229 317 350 465 633
Na* 26 44 50 82 155
κ · 40 64 74 115 206
Ag* 33 54 62 101 188
iBa'" 33 55 65 104 200
OH' 105 175 196 284 439
c r 41 66 77 116 207
§ S 04" 41 68 80 125 234
These figures reveal t h a t a t all t e m p e r a t u r e s the mobilities of the hj'drogen a n d hydroxyl ions are very much higher t h a n those of a n y other ions a n d it is this fact of which use is m a d e in acid-base conducto
metric titrations.
2.4- Conductometric Titrations of Acids of Different Strengths with Strong Bases
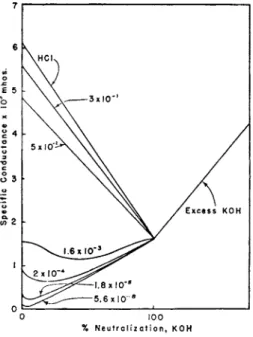
W e h a v e seen in t h e previous p a r a g r a p h t h a t , owing to the high mobility of t h e hydrogen ion, t h e exceptional conductance of a solution of an acid is to be a t t r i b u t e d t o t h e concentration of t h e hydrogen ions which it yields t h r o u g h dissociation. I n t h e case of a strong acid the ionization is almost complete. Moreover when its ionization is regarded from t h e classical theory of Arrhenius, it is found t h a t the variation in the degree of dissociation with concentration cannot be accounted for b y the law of mass action. On t h e contrary, t h e ionization of weak acids and bases a t varying concentrations is in remarkable accordance with both the Arrhenius theory a n d t h e law of mass action. I t is true t h a t dis
sociation constants of weak acids, computed on t h e basis of the Arrhenius theory, display a tendency to decrease for solutions of increasing dilution, b u t t h e extent is insufficient t o discard the Arrhenius theory for our present purpose. Fig. 8, which is diagrammatic only, gives the conductometric graphs of weak acids (0.0156 N)} having the dissociation c o n s t a n t s indicated, with potassium hydroxide (1 N). Proceeding downwards from t h e u p p e r m o s t graph, which for the sake of comparison is t h a t of hydrochloric acid, t h e curves are those of acids of diminishing strength, viz., trichloracetic acid, Κ = 3 Χ 1 0- 1; dichloracetic acid, Κ = 5 X 10~2; monochloracetic acid, Κ = 1.6 Χ 1 0- 3; formic acid, Κ = 2 X 10~4; acetic acid, Κ = 1.8 Χ 10~5; and paranitrophenol, Κ = 5.6 X 10~8. I n constructing this diagram the d a t a h a v e been so plotted t h a t t h e specific conductances of the solutions of the salts of
70 Η. Τ. S. BRITTON
each acid, formed a t the end points, were identical. T h r o u g h the small differences between t h e ionic mobilities of t h e anions of the various acids this is not quite t h e case.
I t will be observed t h a t as the strength of t h e acids decreases the specific conductances become lower a n d the neutralization curves d e p a r t from the rectilinearity of the strong acid. T h o u g h the curvature of t h e neutralization graphs of t h e acids, of which Κ = 3 Χ 10""1 a n d 5 Χ 1 0- 2, is not large, t h a t of the weaker acids become increasingly great until t h e acids become so weak, as is t h e case with acetic acid, Κ = 1.8 Χ 10~5,
% N e u t r a l i z a t i o n, K O H
FIG. 8. The effect of the dissociation constant of an acid on its conductometric graph during neutralization with a strong base.
t h a t a slight curvature is produced in the initial section of the curve while the final section is practically straight. F o r yet weaker acids t h e curvature becomes less and the final straight section becomes longer.
A very slight initial bend is just perceptible in t h e paranitrophenol (K = 5.6 Χ 1 0- 8) graph. T h e curves for still weaker acids, such as boric acid, Κ = 6 Χ 1 0- 1 0, arsenious acid, Κ = 5.5 Χ 1 0- 1 0 a n d phenol Κ = 6 Χ 1 0- 1 0, are perfectly straight. As in Fig. 7 t h e straight line joining the origin to the point of intersection of t h e acid-alkali graphs is the " s a l t line." T h e weakest acids, e.g., boric, are incapable of pro
ducing sufficient concentrations of hydrogen ions to affect t h e specific conductances of their solutions. On neutralization, however, t h e y form
CONDUCTOMETRIC ANALYSIS 71
Owing to the alkali salts which render their solutions increasingly conducting until the acids are completely neutralized, e.g., arsenious acid, H A s 02 + K O H —»
K* + A s 02' + H20 ; t h e result being t h a t their neutralization graphs coincide with their respective salt lines.
T h e neutralization graphs of the stronger acids, for which Κ is of t h e order of 10~3 a n d 10~4, in showing t h a t t h e specific conductances first fall, then pass through minima, a n d finally t e n d t o approach t h e " s a l t l i n e s / ' are interesting in t h a t t h e y reveal the gradual depression of t h e ionization of t h e diminishing concentration of unneutralized acid_by t h e increasing concentration of t h e anions of t h e sodium salt formed as the neutralizations proceed. Bruni and coworkers (13) h a v e shown t h a t the location of these minima depend on the ionic mobilities, t h e dissoci
ation constants of t h e acids, a n d their concentrations.
24.1. Moderately Strong Acids. Κ = Ι Ο ^ - Ι Ο "4 comparatively large curvature of t h e neutraliza
tion graphs of t h e stronger acids, Κ = 1 0- 3, especially when t i t r a t e d a t certain concentra
tions, the exact location of the equivalence-point is sometimes difficult. T h u s in curve A in Fig.
9, which represents the conductometric titration of 100 ml. of 0.01 Ν salicylic acid with 0.56 Ν N a O H , the precise end point is not easily located.
T o find the end point Kolthoff (41) constructs t h e " s a l t line," B, b y adding 0.05 Ν sodium salicylate t o 100 ml. of water a n d determining the conductances. T h e point indicated b y the arrow is t h e true end point. T h e difficulty a b o u t KolthofPs m e t h o d is t h a t it presupposes t h a t t h e acid being t i t r a t e d is known. Righellato a n d Davis (62) therefore, devised two methods which obviate this requirement; one of which
will be described. A conductometric titration of the acid is first performed with ammonia, a n d a second one on a solution of t h e
A - 0 . 5 6N Sodiu m Hydroxide,ccs.
B-0.56N Sodiu m Salicylate,cc$.
FIG. 9. Location of the titration end point of a moderately strong acid.
a second one on a
acid of the same concentration is carried out with potassium hydroxide of exactly t h e same concentration as t h a t of t h e a m m o n i u m hydroxide previously used. As t h e a m m o n i u m a n d potassium ions h a v e almost the same mobilities the neutralization graphs will be nearly coincident u p to t h e end point. Thereafter, t h e excess of potassium hydroxide will give an oblique straight line, whereas t h e excess of a m m o n i u m hydroxide will be represented b y a straight line parallel with the z-axis, owing t o t h e a m m o n i u m ions, originating from t h e a m m o n i u m salt, depressing the trifling ionization of t h e free a m m o n i u m hydroxide. T h e point of
72 Η. Τ. S. BRITTON
intersection of t h e potassium hydroxide a n d a m m o n i u m hydroxide lines denotes t h e titer of t h e acid.
2.4.2. Weak Acids. Κ < 1 0- 5. As already shown, t h e final p a r t of t h e neutralization graph is straight a n d is coincident with t h e " s a l t line." B u t when this straight portion is not sufficiently long t o produce it with certainty so as to intersect t h e "alkali l i n e " produced, t h e precise determination of the end point m a y not be easy a n d this difficulty is aggravated b y t h e large angle between these two lines which m a y inter
fere with accurate extrapolation. Another point to remember is t h a t in t h e final stage of t h e neutralization of a weak acid some hydrolysis of t h e alkali salt occurs, thereby giving slightly higher conductances t h a n would be caused b y t h e salt alone. This leads t o a rounding of t h e titration curve in t h e vicinity of t h e end point. Unless t h e acid be very weak, this curvature a t t h e end point does n o t create insurmountable difficulties.
Kolthoff suggests t h a t a t least one-quarter of t h e neutralization graph should be straight for the satisfactory extrapolation of the end point. As already stated, during t h e process of neutralization of an acid, = K«ait + *acid> a n d b y assuming t h a t t h e neutralization graph will begin a t 7 5 % neutralization t o coincide with t h e salt-line when Ka c i d is equal t o κ^/ΙΟΟ, Kolthoff arrives a t t h e expression:
Κ = 6 . 7 Χ ΙΟ"» X C,
giving t h e relationship which m u s t exist a t 25° between the dissociation constant, K, a n d t h e initial concentration of t h e acid, C, for this to occur.
Hence to t i t r a t e a decinormal solution of a n acid a t 25°, i.e., C = 0.1 N, t h e dissociation constant m u s t be equal to, or less t h a n 6.7 X 10~4; a centinormal solution, C = 0.01 N, K< 6.7 X 10~5; a millinormal solu
tion, C = 0.001 N, K< 6.7 Χ ΙΟ"6. A t 18° for 0.1 Ν acid, Κ < 5 Χ 10~4; 0.01 Ν acid, Κ < 5 Χ 1 0 "5; a n d for 0.001 Ν acid Κ < 5 Χ 10"6.
24.8. Very Weak Acids. Κ < 10"7. T h e difficulty in conducto- metrically titrating very weak acids with strong bases arises from the relatively large a m o u n t s of hydrolysis of the alkali salts, resulting in enhanced conductances, t h a t m a y occur when insufficient free acid remains in the solution to prevent their hydrolytic decomposition from becoming appreciable. Hydrolysis will cause the neutralization graph to diverge from the " s a l t l i n e " as soon as it is sufficient, b y substituting t h e highly conducting O H ' ions for the much less mobile acid anions, to raise the conductance b y 1 % above t h a t due to t h e salt formed. I t can be shown t h a t the neutralization graph of a centinormal solution of an acid will coincide with the " s a l t l i n e " during t h e first half of the neutrali
zation if Κ > 5 X 1 0 ~1 0; for three quarters of the neutralization if
CONDUCTOMETRIC ANALYSIS 7 3
Κ > 1.1 Χ Ι Ο "9 a n d for 9 0 % of t h e neutralization if Κ > 2.6 Χ 10"9. These figures show t h a t it is possible t o t i t r a t e very weak acids con- ductometrically having dissociation constants as small as 10~1 0. This brings very weak acids, e.g., phenol, boric, a n d arsenious acid, within t h e scope of conductometric titration in a m a n n e r which is more accurate t h a n either potentiometric or volumetric methods. Their conductometric graphs consist simply of " s a l t l i n e s " a n d "alkali l i n e s " and production of the initial straight sections of the salt lines t o intersect t h e alkali lines produced renders it easy t o locate t h e end points. Provided t h a t a weak base is capable of neutralizing the very weak acid in question, a more satisfactory angle between t h e " n e u t r a l i z a t i o n l i n e " a n d t h e
"excess base l i n e " is obtained, in t h a t it facilitates t h e location of t h e end point (cf. Fig. 10).
2.5. The Titration of Weak Acids with Weak Bases
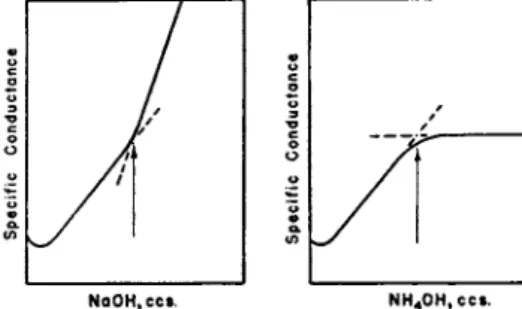
Cases h a v e already been cited in which t h e titrations of acids with a m m o n i u m hydroxide lead to more satisfactory " b r e a k s " corresponding
NaOH, ccs . N H 40 H , c c s.
FIG. 10. Location of the end point of a titration of a weak acid (acetic) with (a) NaOH,, (b) NH4OH.
with t h e end points. This is clearly d e m o n s t r a t e d b y the titration graphs of acetic acid in Fig. 10. B u t t h e strength of the weak base used as t h e t i t r a n t m u s t be t a k e n into consideration for it m a y h a p p e n t h a t t h e hydrolysis of t h e resulting salt m a y be so large a n d t h e graph m a y there
fore become so curved in t h e vicinity of t h e end point t h a t t h e accurate extrapolation of t h e end point m a y become impossible. As Fig. 10 shows, this is not t h e case when acetic acid is t i t r a t e d with a m m o n i a although it is t h e case when m u c h weaker acids, such as boric, arsenious, a n d hydrocyanic, are titrated.
I t can be shown t h a t t h e p H range within which 1 t o 99 % of a weak acid can be neutralized is p Ka — 2 to p Ka + 2, whereas t h e p H range for t h e neutralization of a weak base (1 — 9 9 % ) is given b y p Kw — p K0 + 2 t o p Kw — ρΚδ — 2 ; Ka being t h e dissociation constant of t h e
74 Η . Τ. S. B R I T T O N
weak acid; Khj t h a t of a weak base, and Kw, t h e ionic product of water (6). T h u s the dissociation constant of acetic acid is 1.8 Χ 1 0- 5, a n d therefore p Ka = 4.74, so t h a t in order to neutralize acetic acid with a p H range of p H 2.74 to p H 6.74, it is necessary t h a t the base shall be able to set u p a p H somewhat higher t h a n p H 6.74 when the base itself is a t least 99 % neutralized. As Kb of a m m o n i u m hydroxide is 1.8 X 10~~5, i.e., pKb = 4.74, and as pK«, = 14, it follows t h a t a m m o n i u m hydroxide is 1 % neutralized a t p H 9.24 and 99 % neutralized a t p H 7.24.
I n t h e neutralization of acetic acid with a m m o n i u m hydroxide, the formation of a m m o n i u m acetate necessitates t h a t b o t h conditions, regarding t h e neutralization of the weak acid a n d of t h e weak base, shall simultaneously be satisfied. These conditions are satisfied in this particular titration, for acetic acid is 9 9 % neutralized a t p H 6.74 and a m m o n i u m hydroxide is 9 9 % neutralized at p H 7.25. Some hydrolysis of the a m m o n i u m acetate occurs before, at, and after the end point as shown b y Fig. 10. Soon after t h e end point, t h e hydrolysis is depressed a n d so is the ionization of the a m m o n i u m hydroxide which has been added in excess b y the a m m o n i u m acetate already formed. This is manifested b y the fact t h a t the excess of t h e weak base causes no change in conductance.
T h e conductometric titration graph of boric acid with a m m o n i u m hydroxide exhibits no '1 b r e a k " a n d is so curved t h a t graphical extrapola
tion of t h e end point is not possible.
H B 02 + NH4OH ^± NH4* + B O / + H20
T h e p Ka of boric acid is 9.24 so t h a t for 9 9 % neutralization the a t t a i n m e n t of p H 11.24 is required, whereas the p H when only 1 % of a m m o n i a is neutralized is 11.25. This means t h a t N H4B 02 can only exist in solution when the ratio of the excess of ammonia to the ammonium borate is in the molecular ratio of 9 9 : 1 ; this large excess being needed t o depress the hydrolysis of t h e a m m o n i u m borate. Under such conditions con
ductometric titration is clearly impossible. T h e use of ammonia as a t i t r a n t is therefore restricted to strong a n d weak acids, t h e dissociation constants of the latter being not much less t h a n 1 0- 5.
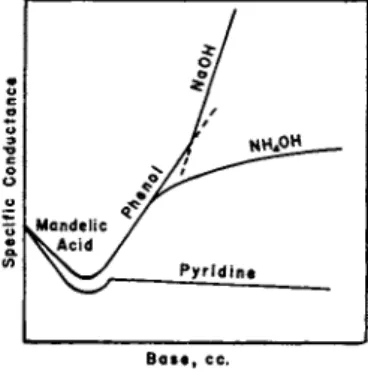
2.6. Titration of Mixtures of Acids and Di- and Tribasic Acids Pyridine, Kb = 1.2 X 1 0_ 9, p K6 = 8.9, is a weak base and is often used in conductometric analysis for the simple reason t h a t it is too weak to react with very weak acids, e.g., phenol, p Ka = 10, boric acid, p Ka = 9.24, b u t is sufficiently strong to neutralize strong a n d moderately strong acids. I t is therefore used to determine conductometrically such acids in mixtures of very weak acids.
C O N D U C T O M E T R I C A N A L Y S I S 7 5
Figure 11 illustrates t h e titration of a mixture of mandelic acid, Ka = 4.3 X 10~4, a n d phenol, Ka = 10~1 0, with (i) sodium hydroxide, (ii) a m m o n i u m hydroxide (iii) pyridine. I n t h e sodium hydroxide graph the mandelic acid neutralization curve merges into the phenol section without giving a n y definite " b r e a k " although t h e end of the neutraliza- tion of t h e mixed acids is clearly defined. T h e a m m o n i u m hydroxide graph shows t h a t ammonia is able p a r t l y to neutralize t h e phenol, while in the pyridine graph a " b r e a k " indicates the complete neutralization of the mandelic acid only, pyridine being m u c h too weak to react with phenol. T h e composition of the mixture can t h u s be found from t h e
Of •*7
I /
'^^^"^
.Mandelic / V A c id /
Pyridine
B a s e, cc .
FIG. 11. Use of a very weak base (pyridine) to determine the end point of the neutralization of a moderately strong acid in the presence of a very weak acid.
sodium hydroxide and pyridine titrations. Calculation shows t h a t 99 % neutralization of pyridine is only possible in acid solutions of p H 3.1, whereas phenol requires a p H of 12.0 for 9 9 % neutralization. Hence pyridine cannot neutralize phenol, b u t is able to neutralize the com- paratively strong acids.
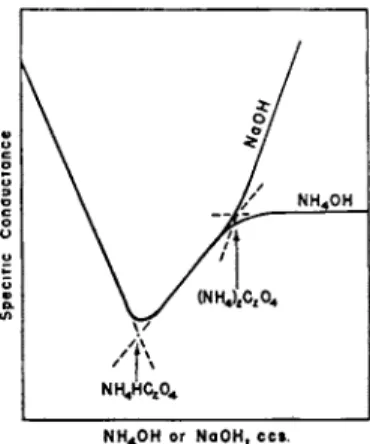
If t h e mixture consists of a strong acid a n d a weak acid, it is sometimes possible t o extrapolate t h e end point of the neutralization of the strong acid b y producing t h e strong acid a n d weak acid sections until they intersect, whereas the end point of the titration of the mixture will be indicated b y a " b r e a k . " Such a m e t h o d presupposes t h a t t h e strong acid is sufficiently strong to give a straight line change in conductance on neutralization a n d t h e weak acid is sufficiently weak t h a t t h e major portion of its neutralization graph follows its " s a l t line." This m e t h o d m a y be illustrated b y a neutralization graph of oxalic acid (Fig. 12).
In its ionization a n d neutralization oxalic acid behaves as if it were a mixture in equivalent proportions of a strong acid,
H2C204 ^ H- + HC2CV
76 Η. Τ. S. BRITTON
a n d a fairly weak acid,
HC2CV ^ H- + C204"
Extrapolation from t h e first two rectilinear sections gives the titer at which sodium or a m m o n i u m bioxalate are formed in solution. Chromic acid, H2C r 04, gives a similar graph, t h e first " b r e a k " corresponding t o the formation of N a H C r 04, a n d t h e second t o N a2C r 04. I n very dilute solution the neutralization of t h e first stage of phosphoric acid gives a rectilinear graph which is t e r m i n a t e d b y a well-defined " b r e a k " ( N a H2- P 04) . I n its second stage phosphoric acid is weak a n d very weak in its third stage. Owing to the slight difference in t h e mobilities of the H P 04" and P 04" ' ions there is b u t a slight change in the slopes of the
NH4OH o r NaOH, ccs .
FIG. 1 2 . The conductometric titrations of the dibasic acid (oxalic) with (a) NaOH, (b) NH4OH.
second a n d third sections of t h e graph. Unless a solution of phosphoric acid of concentration greater t h a n 0.05 Μ be titrated, this difference in slope is insufficient to permit the location t h e point corresponding t o N a2H P 04. Owing to the extreme weakness of the third stage:
Η Ρ 04" Ϊ=± Η· + Ρ 04' "
the considerable hydrolysis which occurs in very dilute solutions prevents t h e extrapolation of t h e third end point, although with solutions more concentrated t h a n 0.05 Μ such extrapolation becomes possible.
Figure 13 (left) illustrates t h e titration of a mixture of a strong acid.
a n d moderately strong acid, Κ a b o u t 10~4. B y neutralizing with 1 Ν sodium hydroxide, the final " b r e a k " a t A', corresponding with a titer of OP, is obtained, b u t no " b r e a k " is given a t R when t h e neutralization of the strong acid is complete, i.e., with a titer equal to OQ. Righellato a n d Davies, however, h a d devised a m e t h o d b y which OQ can be indirectly