Lift and drag force measurements on basic models of low-speed axial fan blade sections
Esztella BALLA, János VAD
Department of Fluid Mechanics Faculty of Mechanical Engineering Budapest University of Technology and Economics
Bertalan Lajos u. 4 – 6., H-1111 Budapest, Hungary; balla@ara.bme.hu, vad@ara.bme.hu
Corresponding author: Esztella Balla FUNDING
This work has been supported by the Hungarian National Research, Development and Innovation Centre under contract No. K 112277, and by the ÚNKP-17-3-I New National Excellence Program of the Hungarian Ministry of Human Capacities.
The work relates to the scientific program of the project "Development of quality-oriented and harmonized R+D+I strategy and the functional model at BME", supported by the New Hungary Development Plan (Project ID: TÁMOP-4.2.1/B-09/1/KMR-2010-0002).
It is also supported by the project "Talent care and cultivation in the scientific workshops of BME" project (Project ID: TÁMOP-4.2.2/B-10/1-2010-0009).
ACKNOWLEDGEMENT
Gratitude is expressed to the following colleagues for giving assistance in the measurements, in alphabetical order of the family names: Mr. András GULYÁS; Mr.
Bálint LŐCZI; Ms. Eszter MENYHÉRT; Mr. József TAJTI.
ABSTRACT
This paper presents comparative data on the aerodynamic lift and drag of basic model representations of low-speed axial fan blade sections. Three main types of blades are investigated: flat plate, cambered plate and RAF6-E profiled airfoil. Lift and drag force are measured at three different Reynolds numbers (0.6∙105, 105and 1.4∙105) around the threshold value of 105. The measurement data is compared to literature data. The aerodynamic force measurements reveal that, for Reynolds numbers below 105, cambered plate blade sections can be superior to airfoil profiles in terms of aerodynamic efficiency, especially in the high-load range. The effect of leading edge bluntness is also investigated.
Leaving the leading edge of cambered plates blunt, tends to be uncritical for low Reynolds numbers at angles of attack between 4°and 10° but is critical at angles between 0° and 4°.
KEYWORDS
airfoil, cambered plate blade, low-Reynolds-number axial fan, low-speed fan NOMENCLATURE
A area [mm2] c chord [mm]
CL lift coefficient CD drag coefficient
d maximum height of the camber line [mm]
D rotor diameter [m]
FL lift force [N]
FD drag force [N]
pdyn dynamic pressure [Pa]
Re chord based Reynolds number
ReAMCA, limit diameter based limiting Reynolds number Rec, limit chord based limiting Reynolds number
s span [mm]
t thickness [mm]
ut circumferential velocity [m/s]
U absolute uncertainty v free-stream velocity [m/s]
angle of attack [°]
Abbreviations
AR aspect ratio = s/c LDR Lift-to-drag ratio LE leading edge
max maximum value OM order of magnitude TE trailing edge 2D two-dimensional
1) INTRODUCTION AND OBJECTIVES
The focus of the current paper is the lift and drag force acting on the blade sections of low-speed axial fans. The blade sections investigated in the present paper are termed herein as “profiles”. ”Low-speed” is defined as being equivalent to the validity of incompressible flow assumption. The low-speed fans operating in the vicinity of humans are often characterized by moderate chord based Reynolds numbers (Re ≤ 105), which is frequently due to small rotor diameter or low rotational speed e.g. computer processor cooling fans [1], cooling fans for electric motors [2][3], or refrigerator fans [4]. These fans often have to fulfil size requirements (only a fixed space is available), while maintaining the prescribed pressure rise, making the investigation of the efficiency of these small fans necessary. Even if the size of the fan is not limited, Re 105 may still occur, if the rotor speed of the larger-sized ventilating fan is controlled by means of a frequency converter which reduces the rotation speed. At their nominal speed, these fans usually operate at Re > 105, but by controlling the rotor speed, a speed reduction down to 20% can be reached compared to the nominal value, which provokes an operation of Re
105.
Regulation 327/2011/EU [5] formulates energy efficiency requirements regarding fans in the EU, driven by motors with an electric input power between 125 W and 500 kW. The regulation only deals with energy efficiency, however noise emission is also linked to aerodynamic losses. This is confirmed by the empirical relations for the noise emission
of fans in [6], which include the fan efficiency as a parameter. Thus the present authors’
long-term aim is to reduce the acoustic emission along with the aerodynamic losses. The aerodynamic measurements linked to preliminary acoustic studies [7][8] are presented in this paper.
At the approximate threshold of Re = 105, significant changes are expected in the aerodynamic characteristics of fan blades. The diagrams in [9] indicate that the aerodynamic performance of profiled, i.e. non-plate airfoil sections, deteriorates rapidly below Re = 105. This deterioration in airfoil performance manifests itself in reduced lift, and thus, reduced lift-to-drag ratio (LDR). Such trends were also reported in [10]. On the basis of the aforementioned studies, cambered plate blading may be superior in terms of both aerodynamic performance and efficiency to profiled airfoil blading in the case of low-speed axial fans operating below Re = 105.
The Reynolds numbers below which Reynolds number dependence becomes significant are termed herein “limiting Reynolds numbers”. The Reynolds number in the AMCA 211-13 standard [11] is calculated based on the rotor diameter, D and the circumferential velocity, ut:
𝑅𝑒𝐴𝑀𝐶𝐴,𝑙𝑖𝑚𝑖𝑡= 𝐷𝑢𝜈𝑡 (1)
The limiting Reynolds number according to [11] is ReAMCA,limit = 0.8∙106 for propeller fans. In this paper the Reynolds number is defined based on the chord length, c of the investigated profile and the free-stream velocity, v:
𝑅𝑒𝑐,𝑙𝑖𝑚𝑖𝑡 =𝑐𝑣𝜈 (2)
In accordance with the findings in [9] the chord based Re limit is set to Rec,limit = 105 herein. The ratio of the two limiting Reynolds numbers can be calculated:
𝑅𝑒𝐴𝑀𝐶𝐴,𝑙𝑖𝑚𝑖𝑡
𝑅𝑒𝑐,𝑙𝑖𝑚𝑖𝑡 =8∙101∙1055= 8 (3)
𝑅𝑒𝐴𝑀𝐶𝐴,𝑙𝑖𝑚𝑖𝑡
𝑅𝑒𝑐,𝑙𝑖𝑚𝑖𝑡 =𝐷𝑐𝑢𝑣𝑡 (4)
The calculation of limiting Reynolds numbers ReAMCA,limit and Rec,limit are self-consistent provided that their ratio Equation (3) is characteristic for the ratio of Equation (4):
𝐷 𝑐
𝑢𝑡
𝑣 ≈ 8 (5)
The relation above is valid for axial fans of relatively low-solidity (low chord-to-spacing ratio), high-aspect-ratio blading, i.e. propeller fans. Fitting to the experiments in [9], measurements around the threshold value of Re = 105 are presented herein (at Re = 0.6∙105, 105, and 1.4∙105) and compared with literature data, in order to offer a comparative investigation in this Re range.
The cambered plate blading of industrial fans is often manufactured by means of rolling sheet metal segments, produced using methods such as laser cutting, without any additional treatment (rounding or tapering) of leading edge (LE) and trailing edge (TE) geometry. The LE and TE of such blades are therefore blunt. In addition to simplifying the required manufacturing, the literature suggests that the bluntness or sharpness of LE and TE offers a potential for improving the aerodynamic performance at moderate Re.
This trend is supported by the following references [9, 12, 13, 14, 15]. In [12], both blunt LE and TE are found to improve the aerodynamic performance below Re = 104. However, [9] concludes that the TE geometry has a minor effect on the lift and drag characteristics of thin models (less than 6% thick) at low Re. Therefore, the present investigation focusses on the aerodynamic effect of the LE bluntness. In [9], the Pfenninger airfoil, of thinner and sharper LE than the Eppler 61 airfoil in [13], was found to provide a higher LDR below Re = 9104. In [14][15], a significant increase in lift was found in the case of a reversed NACA profile (facing the sharp TE with the inflow) at Re 2.1104. In the aforementioned cases [9, 12, 14, 15], the present authors presume that the edge-like, high- curvature segments of the blunt LE contour line act as “turbulators” [9]. Such turbulators promote the eddy-induced energy transfer into the boundary layer. Therefore, they can beneficially influence: a) the laminar separation bubble(s) occurring in the vicinity of the LE, and b) the laminar-to-turbulent transition, at low Re.
This paper presents detailed comparative data on aerodynamic lift and drag of basic model representations of blade sections, obtained from a) historical measurement databases used in design of industrial axial fans [16], b) the basic literature focussing on micro-air vehicle applications [9], and c) own measurements. The aim of the own experiments is to reproduce the measurement layouts realised in [9], as they serve as the main reference for the work presented herein. In accordance with [9], the aerodynamic efficiency is defined in terms of LDR. The angle of attack at which the highest LDR is reached is of great importance from a design point of view. Based on the considerations in [10][16], the maximum LDR represents the optimal operation of the elemental blade section, in terms of moderation of blade friction loss relative to the isentropic total pressure rise. The comparative investigation incorporates data in the extended range of 0° ≤ ≤ 20°.
The objective of the present paper is to examine the aerodynamic effect of LE bluntness, low Re and the combination of these two on the lift and drag coefficients of basic model representations of low-speed axial fan blade sections.
2) EXPERIMENTAL TECHNIQUE
The experiments were conducted in the wind tunnel, shown in Figure 1., located in the Department of Fluid Mechanics, Budapest University of Technology and Economics. The detailed characteristics of the wind tunnel are published in [17]. The turbulence intensity at the inlet of the test section is 0.8%. According to [9], turbulence intensity up to about
1% has a negligible influence on the lift and drag characteristics of thin models at low Re.
The test section of the wind tunnel is bounded by a wall on two sides. The walls are perpendicular to the span of the profiles. The width of the test section is 150 mm. The size of the inlet is 150x1000 mm. One of the side walls can be opened in order to change the profiles in the test section. The other, fixed wall, contains the force measurement system of the wind tunnel, with a built-in protractor. The profiles are equipped with a handle, by which they are mounted, and the force acting on them is measured. The wind tunnel serves for both aerodynamic and acoustic [7][8] studies on the profiles under present investigation.
On the basis of [10][16][18], isolated airfoil data can approximately be applied in design of blade cascades if the solidity is below 0.7. Therefore, the results presented herein are relevant for such low-solidity axial fan cascades. The results related to the cambered plate blade can also be utilized in the design of blades of centrifugal fans with cambered plate blades, as long as the fan can be modelled with blade cascade data with low solidity [19].
Similarly the findings can be incorporated into the design of cambered-plate guide vane blades, e.g. subsequently mounted “bolt-on” outlet guide vanes, with low solidity.
Figure 1. [17] Measurement setup. 1. Motor 2. Frequency converter 3. Radial fan 4. Inlet bell mouth 5.
Guide vanes 6. Flexible connector 7. Split diffuser 8. Honeycomb 9. Turbulence reduction screens 10.
Transition element 11. Closed test section
The dynamic pressure (pdyn)was measured using a factory calibrated KIMO Pitot-static tube, with a calibration coefficient of 1.0015 and a pressure transducer of type Setra 239, calibrated to a certified Betz micromanometer. FL and FD were measured with three load cells (type: Emalog CZL-608), two in the vertical and one in the horizontal directions.
The cells were calibrated with weights before the measurements. The signals from the cells were amplified with an Emalog FD-3 load cell amplifier. The pressure and force data were collected using the Pressure & Force measurement software (developed in- house), through an NI BNC-2110 shielded connector block and an NI PCI-6036E data acquisition card. The chord, c, and span, s, have been measured using a vernier caliper.
A three-hole probe served for determining the inflow direction into the test section. The three-hole probe was preliminarily calibrated in a free jet generated by a calibrator nozzle installed in a calibration wind tunnel. The probe was mounted in the middle of the test
section, in its vertical symmetry plane, i.e. at midspan location of the blade profiles. The angle of attack, α, has been defined between the aforementioned inflow direction and the chord line. In order to make possible a direct comparison with the results in [9], the method of α-setting in [9] has been applied herein. α was aligned manually, with the use of the built-in protractor. The calculation of the reference area, A, and the lift, CL, and drag, CD, coefficients are shown in Equations (6) and (7). As CL and CD are functions of the angle of attack, an uncertainty due to the α setting was calculated from the derivative of the measured values, and was included in the estimation of overall absolute uncertainty, UCL and UCD of the quantities.
𝐴 = 𝑐 ∙ 𝑠 (6) 𝐶𝐿,𝐷=𝑝𝐹𝐿,𝐷
𝑑𝑦𝑛∙𝐴 (7)
The following main uncertainty sources were identified and quantified: uncertainty in the alignment of α, force measurement, pressure measurement, and measurement of the geometric dimensions of the profiles.
The maximum uncertainties of the experiment-based quantities were calculated with 95%
confidence level. The absolute uncertainties UCL and UCD were estimated from the measured values in accordance with the method in [20]. The uncertainty of experimentally determined quantities are presented in Table 1.
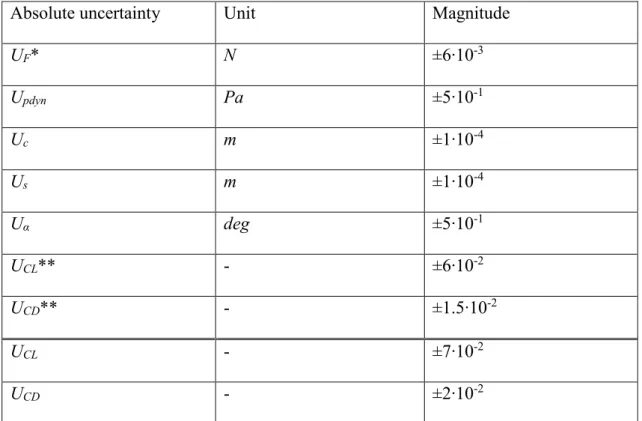
Table 1. Estimation of average uncertainties over the full ranges of investigation
Absolute uncertainty Unit Magnitude
UF* N ±6∙10-3
Updyn Pa ±5∙10-1
Uc m ±1∙10-4
Us m ±1∙10-4
Uα deg ±5∙10-1
UCL** - ±6∙10-2
UCD** - ±1.5∙10-2
UCL - ±7∙10-2
UCD - ±2∙10-2
* Due to the uncertainty of force measurement
** Due to the uncertainty of α setting
3) INVESTIGATED PROFILES OF THE CASE STUDY
Three basic profiles were selected for investigation: a flat plate, a cambered plate, and a RAF6-E airfoil, which will be termed as “flat”, “cambered” and “airfoil”, respectively.
The cross-sections of the profiles are shown in Figure 2. The details of the geometrical data are summarized in Table 2. The experiments carried out by the authors have been designed incorporating profiles of s/c = 1.50, in order to enable a comparison with detailed aerodynamic data presented in [9].
Figure 2. Cross-sections of the profiles [7]. Flat (top), cambered (middle), airfoil (bottom). The arrows indicate the locations of the maximum height of the camber line, d.
The RAF6-E [16] was chosen for the profiled “airfoil”, as it has been widely used in low- speed axial fan design. Its popularity is due to its plain pressure surface, which allows easy manufacturing. A sheet metal plate, of 8% relative curvature, with a circular-arc camber line, was chosen as “cambered” profile. According to [16], for the “cambered” profile the maximum CL is 1.6, while for the “airfoil” profile the maximum CL is approximately 1.4. The maximum achievable lift coefficient using the “cambered” profile exceeds that of the “airfoil”. Therefore, the lift of the “cambered” profile is competitive with that of the “airfoil” in the design of axial fans of increased specific performance, while it offers simplification in manufacturing. The ”flat” profile was also investigated in addition to the aforementioned profiles, as it serves as an aerodynamic and aeroacoustic reference case, e.g. [9][16].
The comparative characteristics of the profiles are given in Table 3. For the cases from references [7][9], the aspect ratio (AR) is 1.5. For the cases from [16], the AR can be considered infinite, since the measurement data was corrected to represent an infinite AR.
Table 2. Geometrical data of the profiles
Profile c [mm] s [mm] t [mm] d [mm]
Flat 100 150 2.5 0
Cambered 100 150 2 8
Airfoil 100 150 10* 5
*maximum thickness
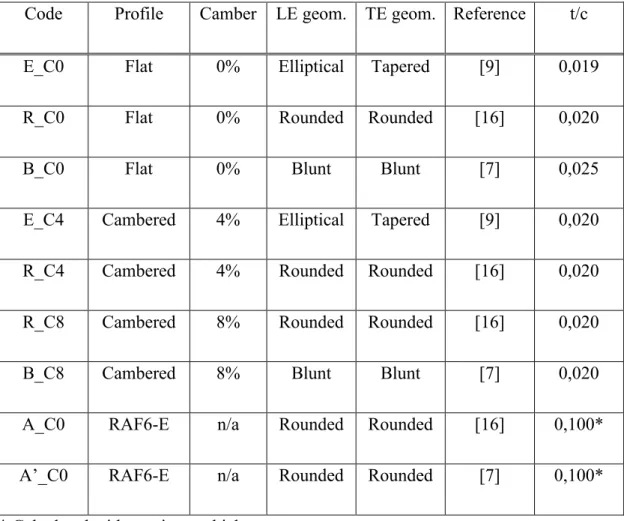
In order to simplify the description of the measurement cases, the following code system is established. A profile code is introduced, which describes the TE and LE geometry.
The code E stands for the measurements in [9], since the measured profile had Elliptical LE and tapered TE. The code R stands for the profiles measured in [16], since those had Rounded LE and TE. The code B stands for the flat and cambered plates [7] presented herein, since the LE and the TE of these are Blunt. The code A stands for the Airfoil.
Since the profile geometry is the same for the current measurements as in the literature, the new measurements are denoted by A’. The next parameter considered in the coding system for the profiles is the percent of camber. For the 0% (flat plate), 4% and 8%
camber, the following codes are used respectively: C0, C4 and C8. To distinguish between the measurement cases, a code for the chord based Re is also applied.
Measurements carried out at Re = x times 105 are indicated with “Rex”. For instance the measurement case E_C4_Re1.4 stands for a cambered plate from [9], which has an elliptical LE and tapered TE, has 4% camber, and was measured at Re = 1.4∙105.
Table 3. Geometry of the compared profiles
Code Profile Camber LE geom. TE geom. Reference t/c
E_C0 Flat 0% Elliptical Tapered [9] 0,019
R_C0 Flat 0% Rounded Rounded [16] 0,020
B_C0 Flat 0% Blunt Blunt [7] 0,025
E_C4 Cambered 4% Elliptical Tapered [9] 0,020
R_C4 Cambered 4% Rounded Rounded [16] 0,020
R_C8 Cambered 8% Rounded Rounded [16] 0,020
B_C8 Cambered 8% Blunt Blunt [7] 0,020
A_C0 RAF6-E n/a Rounded Rounded [16] 0,100*
A’_C0 RAF6-E n/a Rounded Rounded [7] 0,100*
* Calculated with maximum thickness
As suggested in [9], the gaps between the two endwalls and the model are to be less than 0.005 s, in order to avoid any significant impact on the measurement results. This requirement is fulfilled in the present measurements, with 0.5 mm ( 0.003 s) gaps being realized. In [9], the case studies on models of s/c = 1.50 equipped with two endplates, were referred to as two-dimensional (2D). This implies that an experiment designed with
s/c = 1.50, two endwalls and the appropriate tip gap, as presented in [9], can be approximated as a 2D aerodynamic case.
The plate blades presented in [9] and [16] have a relative thickness, t/c, of 0.02. The maximum relative thickness for the plates presented herein is 0.025. Based on [21], 1%
change in t/c causes a change in the lift curve slope in the order of magnitude of 10-3. Consequently, a 5% change in thickness causes a 5∙10-3 change in the lift curve, which is one order of magnitude smaller than the estimated absolute error, UCL. On this basis, the effect of various relative plate thicknesses in the comparative (both flat and cambered) case studies is neglected herein.
4) RESULTS AND DISCUSSION
As discussed in [9], the interaction between the boundary layer growing on the endwalls and the flow around the wing tends to reduce the lift and increase the drag, especially at moderate Reynolds numbers. Such effect is termed herein as the “endwall effect”. [16]
states that the data in this reference are corrected to infinite AR, thus eliminating the endwall effect. Nevertheless, the endwall effect has been left uncorrected both for the data in [9] and for the own measurements, with the intention of directly presenting the results of the experiments. In order to judge the significance of the endwall effect for the flat plate and the 4% cambered plate cases, the data from [16] is compared to [9]. For the 8% cambered plate and the airfoil cases, the data from [16] is compared to the own measurements. The comparisons focus on whether the lift decreases and / or the drag
increases due to the endwall effect. Such comparisons suggest the following trends. For the flat plate, the endwall effect appears to be insignificant (within the experimental uncertainty) within the low-load range. The endwall effect tends to become more pronounced toward higher camber (flat → 4% cambered → 8% cambered plates) and / or toward higher values and always for the airfoil profile. Therefore, the models reported in [9] and in the own experiments can be considered as approximations of 2D flow cases only being aware to the occasionally pronounced endwall effect, in terms of CL and / or CD.
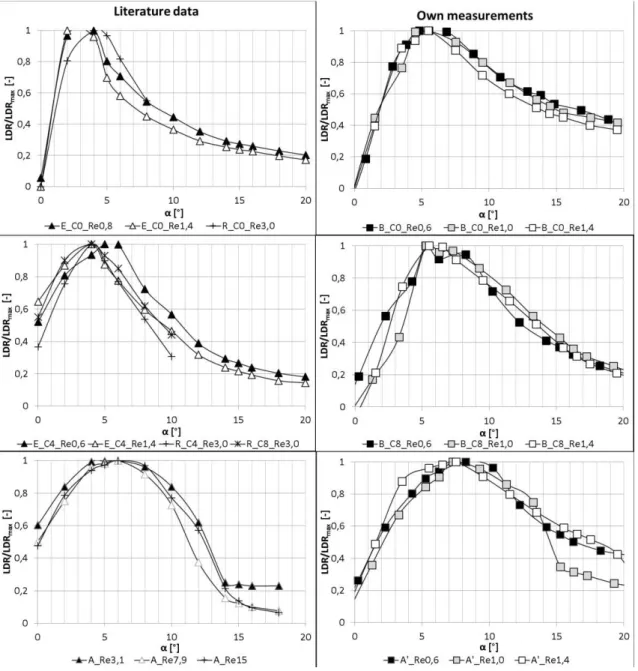
Figure 3. shows the normalised LDR values for the investigated cases. Each data series is normalised with its maximum value. The aforementioned endwall effect results in a reduction of LDR, seen by comparing the data from [16], [9] and the present measurements. Taking the LDRmax values at Re closest to 105 as representative indicators, the following reduction of LDRmax is observed for the own measurements, relative to the data from [16]. "Flat": R_C0_Re3,0 ---> B_C0_Re1,0: 50% reduction. "Cambered":
R_C8_Re3,0 ---> B_C8_Re1,0: 70% reduction. "Airfoil": A_Re3,1 ---> A'_Re1,0: 90%
reduction.
For a systematic and comprehensive evaluation of the results, the ranges of incidence angle are uniformly categorised on the basis of Figure 3., and labelled for each presented data curve as follows:
0° 4°: this range is labelled as the low-load range. The upper limit of this range,
= 4°, is an overall, approximate representation of the state of maximum LDR for each case (literature data as well as own measurements) discussed herein. Therefore, if high total efficiency is an aim of the fan design, then the blade sections should be designed to operate near the upper limit of the low-load range, corresponding to maximum LDR.
4° < 10°: this range is labelled as the high-load range. The upper limit, = 10°, is an overall representation for maximum CL for each case discussed herein. Therefore, if high specific performance is an aim of the fan blade section design, by utilizing the maximum available lift, the blade sections are to be designed to operate near the upper limit of the high-load range.
10° < 20°: this range is labelled as the overload range. This range forms a transition from partly stalled state toward deep stall. Such operational range is undesirable and occurs at highly throttled fan states.
Figure 3. Normalised LDRs as a function of .
According to their design relevance, the discussion focusses on the low-load and high- load ranges. The measurement data are also presented and briefly commented on, for the
overload range. In the following section the results of the force measurements are presented for each profile geometry in comparison with literature data.
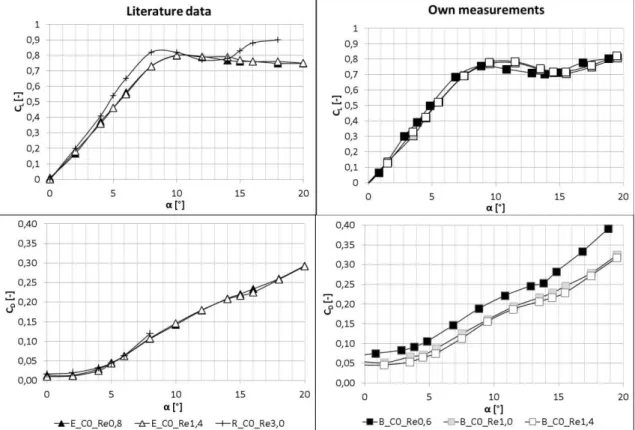
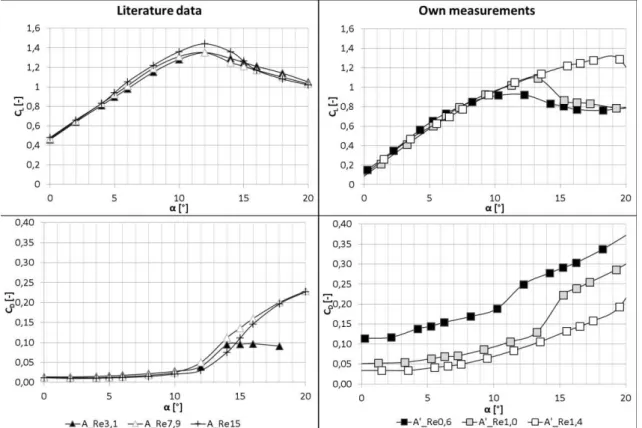
Flat plate (Figure 4.) Lift coefficient
Figure 4. Lift and drag coefficients as a function of for the flat plates
For both of the low-load and high-load ranges, the lift curves of the blunt LE cases (B_C0_Re0,6; B_C0_Re1,0; B_C0_Re1,4) agree fairly well with those of the elliptical LE cases (E_C0_Re0,8 and E_C0_Re1,4). The maximum CL 0.8 occurs at 10° for
each case. Therefore, the bluntness of the LE does not appear to deteriorate the lift on the flat plate.
For the blunt cases no definite trend can be observed for the effect of Re on CL. For both the low-load and high-load ranges, the change in CL is confined within the experimental uncertainty for the range of Re between 6104 and 1.4105. Therefore, the lift appears to be insensitive to the Reynolds number. This observation is in agreement with the flat plate measurements in [9].
Drag coefficient
The bluntness of the LE introduces significant additional drag, especially in the low-load range. At higher Reynolds numbers, this additional drag tends to decrease as increases.
For the blunt cases CD tends to increase as Re decreases, corresponding to the trend established in [9]. A comparatively large increase in CD can be observed when the Reynolds number decreases from 1105 to 6104.
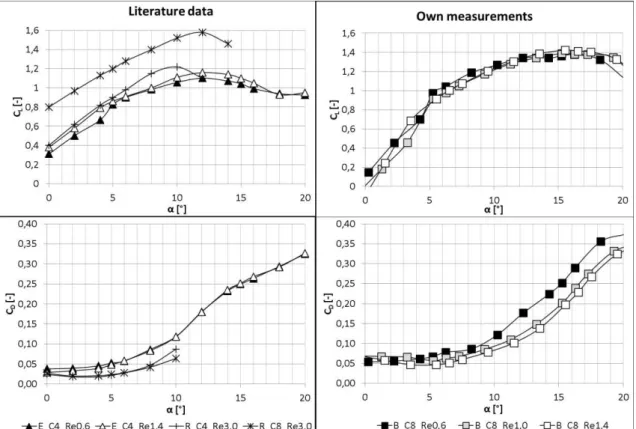
Cambered plate (Figure 5.)
Lift coefficient
The lift curve values for the R_C8_Re3,0 [16] case are significantly higher than those for the own measurements (B_C8_Re0,6; B_C8_Re1,0; B_C8_Re1,4). The possible reasons include the endwall effect, and/or the effect of LE bluntness. Such effects appear to be pronounced within the low-load range. For example, at = 5°, CL for the R_C8 [16] case
and for the own measurement cases is 1.2 and 1.0, respectively. However, for = 0°, these respective values are 0.8 and 0.2.
Figure 5. Lift and drag coefficients as a function of for the cambered plates
For the elliptical cases the reduction of Re tends to deteriorate CL. Such behaviour is in accordance with the observation in [9]. The deterioration is pronounced within the low- load range. For the blunt cases, such as for the flat plate, no definite trend can be observed for the effect of Re on CL; the lift tends to be insensitive to the Reynolds number. For the high-load range, the change in CL is confined within the experimental uncertainty for the range of Re between 6104 and 1.4105.
Drag coefficient
Based on [9], it is expected that the increase of camber tends to increase the drag. In comparison of the E_C4 and the B_C8 cases, the increase of drag is confined to the low- load range. Such increase of drag can be attributed to the twofold effect of a) increased camber, and b) LE bluntness. The drag-increasing effect of LE bluntness for the low-load range has also been observed for the flat plate case. For higher values, the increase of drag due to increased camber and / or LE bluntness is not characteristic.
For the elliptical cases CD tends to increase as Re decreases, corresponding to the trend established in [9]. Such effect appears within the low-load range but is not characteristic for larger angles. For the blunt cases, such as for the flat plate, CD tends to increase as Re decreases, corresponding to the trend established in [9].
Airfoil (Figure 6.)
Lift coefficient
In the case of own measurements, within the investigated Reynolds number range, the lift appears to be insensitive to the Reynolds number, such as for the flat plate and cambered plate cases. The lift variation is within the experimental uncertainty for both of the low- load and high-load ranges. The lift increases with the Reynolds number in the overload range only.
Drag coefficient
In the case of own measurements the reduction of Re tends to drastically increase CD. The increase is especially pronounced when the Reynolds number decreases from 1105 to 6104. At such low Reynolds number, the drag of the airfoil exceeds that of the 8%
cambered blade over the entire range of 0° ≤ ≤ 20°. This observation is in accordance with [10].
Figure 6. Lift and drag coefficients as a function of for the airfoils
5) SUMMARY AND FUTURE REMARKS
Based on the results above, the following trends can be stated for each geometry. The results are also summarized in Table 3.
Flat plate
In case of a non-blunt LE, both CL and CD are found to be insensitive to decreasing the Re to Re < 105, for both of the low-load (0° ≤ ≤ 4°) and the high-load (4° < ≤ 10°) range. [Comparative cases: E_C0_Re1,4 → E_C0_Re0,10]
At the representative intermediate Reynolds number of Re = 105, blunting the LE was found to leave CL practically unchanged, for both the low-load and high-load ranges.
Blunting the LE caused an increase in CD in the low-load range only. [Comparative cases:
E_C0_Re1,4 and E_C0_Re0,8 → B_C0_Re1,0]
For the blunt LE case, decreasing the Reynolds number to Re < 105 did not significantly affect CL but caused a large increase in CD for both the low-load and high-load range.
[Comparative cases: B_C0_Re1,4 → B_C0_Re1,0 → B_C0_Re0,8]
Cambered plate
In case of the 4% cambered plate of non-blunt LE, decreasing the Reynolds number to Re
< 105 caused a deterioration of CL and increase of CD in the low-load range. However,
insignificant changes were observed for both CL and CD, due to decreasing Re for the high-load range. [Comparative cases: E_C4_Re1,4 → E_C4_Re0,8]
For the 8% cambered plate of non-blunt LE, the only reference available in the literature is the R_C8_Re3,0 case. The diagrams in [9] suggest that, the Reynolds number effect on CL is moderate at Re > 1,4105. Furthermore, as stated before, the endwall effect is pronounced toward higher and lower Re values. The blunt LE cases (B_C8) show a significant deterioration in CL and increase in CD for the low-load range. Based on the above, this is attributed to introducing LE bluntness. For the high-load range, the change in CL due to blunting the LE appear to be attenuated at higher Reynolds numbers, in comparison to the low-load range: the lift curve slope for the blunt-LE case is similar to that of the non-blunt case. However, the increase of CD is observable in the high-load range. [Comparative cases: R_C8_Re3,0 → B_C8_Re1,0]
For the blunt LE case, decreasing the Reynolds number to Re < 105 did not characteristically affect CL. However, it caused a remarkable increase in CD, for the high- load range. [Comparative cases: B_C8_Re1,4 → B_C8_Re1,0 → B_C8_Re0,8]
Airfoil
CL appears to be insensitive to decreasing Re. However, a large increase is observed in CD. Such increase is much more significant for the airfoil than for the cambered plate.
[Comparative cases: A_Re1,4 → A_Re1,0 → A_Re0,8]
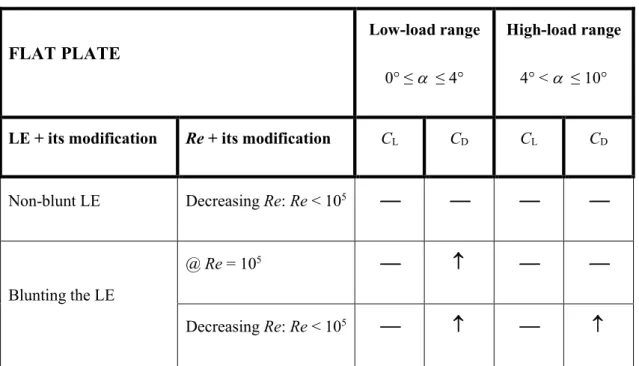
Table 3. Summary of the trends
FLAT PLATE
Low-load range 0° ≤ ≤ 4°
High-load range 4° < ≤ 10°
LE + its modification Re + its modification CL CD CL CD
Non-blunt LE Decreasing Re: Re < 105 ⎯ ⎯ ⎯ ⎯
Blunting the LE
@ Re = 105 ⎯ ⎯ ⎯
Decreasing Re: Re < 105 ⎯ ⎯
CAMBERED PLATES
Low-load range 0° ≤ ≤ 4°
High-load range 4° < ≤ 10°
LE + its modification Re + its modification CL CD CL CD
Non-blunt LE Decreasing Re: Re < 105 ⎯ ⎯
Blunting the LE
@ Re = 105 ⎯
Decreasing Re: Re < 105 ⎯ ⎯ ⎯
AIRFOIL
Low-load range 0° ≤ ≤ 4°
High-load range 4° < ≤ 10°
LE Re + its modification CL CD CL CD
Non-blunt LE Decreasing Re: Re < 105 ⎯ ⎯
Key:
⎯ Insensitive
Increase
Decrease
The trends discussed above allow for the following qualitative guidelines in preliminary design of axial fan blades.
• For Re < 105 applications, cambered plate profiles can be superior to airfoil profiles in terms of aerodynamic efficiency, especially in the high-load range. The reason is that the increase of drag, due to decreasing Re, is moderate for cambered plate profiles, in comparison to airfoil profiles, without a significant deterioration of lift.
• For low-Re applications, leaving the LE of cambered plates blunt tends to be uncritical in the high-load range but is critical in the low-load range.
CONFLICT OF INTEREST
The Authors declare that there is no conflict of interest.
REFERENCES
[1] Huang, L. X., Characterizing computer cooling fan noise. J. Acoust. Soc. Am.
2003, 114, pp. 3189-3200
[2] Vad, J., Horváth Cs., Kovács J.G., Aerodynamic and aero-acoustic improvement of electric motor cooling equipment. Proc. Instn Mech. Engrs, Part A, J. Power and Energy 2014; 228, pp. 300-316.
[3] Borges, S. S., CFD techniques applied to axial fans design of electric motors.
Proc. International Conference on Fan Noise, Technology and Numerical Methods (FAN2012), Senlis, France.
[4] Gue, F., Cheong, C., Kim, T., Development of low-noise axial cooling fans in a household refrigerator. J. Mechanical Science and Technology 2011, 25, pp. 2995-3004.
[5] Regulation of the European Commission (EU) No. 327/2011, of 30 March 2011, implementing Directive 2009/125/EC of the European Parliament and of the Council of the European Union with regard to ecodesign requirements for fans driven by motors with an electric input power between 125 W and 500 kW. Official Journal of the European Union, 6 April 2011, pp. 8–21.
[6] VDI 3731 Blatt 2 Characteristic noise emission values of technical sound sources, Fans, 1990
[7] Balla, E., Vad, J., Beamforming Studies on Basic Models of Low-speed Axial Fan Blade Sections, In: Proceedings of 12th European Conference on Turbomachinery - Fluid Dynamics and Thermodynamics Stockholm, Sweden, 04.03-04.07. 2017.,
[8] Balla E, Vad J., Establishment of a beamforming dataset on basic models of low- speed axial fan blade sections, Periodica Polytechnica-Mechanical Engineering, 2017;
61:(2) pp. 122-129.
[9] Mueller, T. J., Aerodynamic measurements at low Reynolds numbers for fixed wing micro-air vehicles. RTO AVT/VKI Special Course on Development and Operation of UAVs for Military and Civil Applications. September 13-17, 1999, Von Karman Institute for Fluid Dynamics, Belgium.
[10] Carolus, T., Ventilatoren. B. G. Teubner Verlag, Wiesbaden. 2003
[11] AMCA Publication 211-13 Product Rating Manual for Fan Air Performance, 2013 [12] Carmichael, B. H., Low Reynolds number airfoil survey. NASA Contractor Report 165803, Vol. 1, November 1981.
[13] Mueller, T. J., and Burns, T. F., Experimental studies of the Eppler 61 airfoil at low Reynolds numbers. AIAA Paper 1982;#82-0345.
[14] Laitone, E. V., Aerodynamic lift at Reynolds numbers below 7 X 10⁴. AIAA Journal 1996; 34 (9), pp. 1941-1942.
[15] Laitone, E. V., Wind tunnel tests of wings at Reynolds numbers below 70,000.
Experiments in Fluids 1997; 23, pp. 405-409.
[16] Wallis, R. A., Axial flow fans. George Newnes Ltd., London 1961
[17] Gulyás, A., Balczó, M. Development of a Small Blower-type Wind Tunnel for Educational Purposes., In: 28th microCAD International Multidisciplinary Scientific Conference, Miskolc, Hungary, 04.10-04.11. 2014
[18] Lewis, R. I., Turbomachinery Performance Analysis. Butterworth-Heinemann, Oxford 1996
[19] Rossetti, A., Ardizzon, G., Pavesi, G., and Cavazzini, G., An optimum design procedure for an aerodynamic radial diffuser with incompressible flow at different Reynolds numbers. Proc. IMechE, Part A: J. Power and Energy, 2010, 224, 69–84.
[20] Vad, J., Kwedikha, A. R. A., Jaberg, H., Effects of blade sweep on the performance characteristics of axial flow turbomachinery rotors, Proceedings of the Institution of Mechanical Engineers Part A: Journal of Power and Energy 2006; 220: pp.
737-749.
[21] Hoerner, S. F., Fluid-Dynamic Lift. 2nd Edition. Hoerner Fluid Dynamics, Bricktown, New Jersey, USA. 1992
![Figure 1. [17] Measurement setup. 1. Motor 2. Frequency converter 3. Radial fan 4. Inlet bell mouth 5](https://thumb-eu.123doks.com/thumbv2/9dokorg/1385781.114641/12.892.138.803.211.406/figure-measurement-setup-motor-frequency-converter-radial-inlet.webp)
![Figure 2. Cross-sections of the profiles [7]. Flat (top), cambered (middle), airfoil (bottom)](https://thumb-eu.123doks.com/thumbv2/9dokorg/1385781.114641/15.892.268.655.220.357/figure-cross-sections-profiles-flat-cambered-middle-airfoil.webp)
![Table 2. Geometrical data of the profiles Profile c [ mm ] s [ mm ] t [ mm ] d [ mm ] Flat 100 150 2.5 0 Cambered 100 150 2 8 Airfoil 100 150 10* 5 *maximum thickness](https://thumb-eu.123doks.com/thumbv2/9dokorg/1385781.114641/16.892.138.548.244.453/table-geometrical-profiles-profile-cambered-airfoil-maximum-thickness.webp)