EVALUATION OF Pgp (MDR1) IMMUNOHISTOCHEMISTRY IN CANINE LYMPHOMA –
PROGNOSTIC AND CLINICAL ASPECTS
Péter VAJDOVICH1*, Zsófia KOLTAI2, Valéria DÉKAY1, Krisztina KUNGL1 and Andrea HARNOS3
1Department of Clinical Pathology and Oncology and 3Department of Biomathematics and Informatics, University of Veterinary Medicine, István u. 2, H-1078 Budapest,
Hungary; 2Veterinary Haematology and Oncology Centre, Budapest, Hungary (Received 26 November 2017; accepted 16 April 2018)
Permeability glycoprotein (P-glycoprotein, Pgp) immunohistochemistry (IHC) was evaluated in dogs with multicentric lymphoma treated with cyclophos- phamide–doxorubicin–vincristine–prednisolone with or without L-Asparaginase.
Lymph nodes of 33 untreated dogs were immunophenotyped: Ki67% and Pgp analyses (with anti-Pgp, monoclonal mouse C494 clone) were performed. Pgp positivity rate and intensity were determined microscopically (by manual count- ing done by two blinded authors in two parallel specimens). The median overall survival time (OST) was 333 days and the relapse-free period (RFP) 134 days.
Pgp expressions were positive in 18 out of 33 (54.5%) of tumour cells. T-cell types stained more intensively. Lower OST and RFP were found with Pgp posi- tivity ≥ 35% (OST: 240 days, RFP: 95 days) compared to Pgp positivity < 35%
(OST: 428 days, RFP: 232 days). Intensive staining was associated with a lower OST and RFP (240 and 103 days, respectively) than weak staining (428 and 221 days, respectively). Death due to adverse drug reactions was best predicted at Pgp positivity ≤ 6.5% (sensitivity/specificity: 0.55/0.81) and ≤ 123 days (sensitivi- ty/specificity: 0.55/0.86). Pgp evaluation by IHC can have prognostic value with a properly established Pgp% positivity cut-off value in dogs treated with Pgp sub- strate drugs.
Key words: Adverse drug reactions, lymphoma, prognosis, canine, P- glycoprotein, immunohistochemistry
Multidrug resistance (MDR) is a process that describes the situation when organs, tissues, cells or a pathological condition treated with various medications do not respond to the drugs used. When the therapeutic agent is a prodrug, its con-
*Corresponding author; E-mail: vajdovich.peter@univet.hu; Phone: 0036 (1) 478-4141;
Fax: 0036 (1) 478-4129
Open Access. This is an open-access article distributed under the terms of the Creative Commons Attribution- NonCommercial 4.0 International License (https://creativecommons.org/licenses/by-nc/4.0/), which permits un- restricted use, distribution, and reproduction in any medium for non-commercial purposes, provided the origi- nal author and source are credited, a link to the CC License is provided, and changes – if any – are indicated.
version within the body into a pharmacologically active drug can be impaired (e.g.
cyclophosphamide, nitrosoureas such as lomustine, cytosine arabinoside, camp- tothecins, etc.) (Bergman, 2000). The DNA altered by a cytotoxic agent can be re- paired through repair enzyme mechanisms via the action of e.g. topoisomerases and endonucleases (Bergman, 2000). Some drugs are metabolised by various en- zymatic mechanisms, such as the cytochrome P450 or other systems (Rochat, 2005), or extruded from cells by various mechanisms like transmembrane drug transport- ers or efflux pump systems. These mechanisms are present in all cellular organisms as a type of cell defence against foreign or harmful molecules (Bergman, 2003).
Permeability glycoprotein (P-glycoprotein, Pgp) or MDR1 drug efflux protein is the most commonly examined member of this family in dogs, although other proteins with a similar function, such as multidrug resistance associated proteins 1 and 2 (MRP1, 2), breast cancer resistance protein (BCRP) (Honscha et al., 2009), lung resistance protein (LRP) (Tomiyasu et al., 2013) are also known to be important.
Pgp function is present in various types of normal cells, and Pgp can be detected under physiological conditions in normal tissues (e.g. in the adrenal gland, kidney, liver, colon, brain, lung, peripheral blood, bone marrow, fetal tis- sues, cellular compartments) of many species (Ginn, 1996). MDR1 mRNA ex- pression is high in brain tissue, as a component of the blood–brain barrier (Mealey et al., 2002). There are numerous data showing the pathological effects of decreased expression and function of this detoxifying protein, i.e. increased sensitivity to ivermectin or chemotherapy drugs in numerous Collie families and other mainly British breeds caused by decreased MDR1 function due to poly- morphism (Mealey et al., 2002).
MDR is an emerging problem in the chemotherapy treatment of animals, especially in those primarily treated with drugs (doxorubicin, vincristine, actino- mycin D, mitoxantrone, etc. – Pgp substrates) for haematopoietic neoplasms (Bergman et al., 1996; Lee et al., 1996; Vail and MacEwen, 2000). It is known that these drugs can even induce Pgp expression in tumour cells (Mealey et al., 1998).
The detection of MDR proteins or their genes in canine cancer cells is considered to provide prognostic information, among many other factors (Berg- man, 2000). However, some articles express controversies in this regard (Brenn et al., 2008; Dhaliwal et al., 2013).
A prospective study was conducted to achieve two aims: (1) to evaluate the diagnostic utility of Pgp expression in canine lymphoma, including consider- ation of the staining percentage and intensity of the positively stained cells; (2) to evaluate clinical characteristics, such as relapse and adverse drug effects causing death, to identify prognostic factors and their relationship with MDR. This latter aim was supported by the hypothesis that cases with low Pgp IHC expressions might be more susceptible to drug side effects than MDR-positive cases or pa- tients with higher Pgp IHC expressions. These Pgp results may be indicative of
the patient’s overall drug sensitivity. The long-term aim was to provide a diag- nostic tool which might help to establish a so called ‘patient-tailored’ way of treatment. In case if we knew the pretreatment drug sensitivity of the tumours, we would be able to choose appropriate treatment with those drugs which were not Pgp substrates, and this would increase our treatment efficacy.
Materials and methods
Animals, clinical examinations, therapy protocols
Thirty-three dogs with lymphoma were eligible for inclusion into the pro- spective study. The inclusion criteria were as follow: proven histological diagno- sis of lymphoma of multicentric forms, no previous treatment of the lymphoma (including prednisolone), complete pretreatment clinical staging (complete blood count, 10 basic clinical chemistry parameters, acid-base and electrolyte assess- ment, urinalysis, abdominal ultrasonography), complete owner compliance in cy- tostatic treatment and control visits. Further staging included splenic and/or liver cytology (n = 22), chest X-ray (n = 30) and bone marrow cytology (n = 31), no other, non-lymphoma related disease, complete owner compliance in cytostatic treatment and control visits. Exclusion criteria included improper data collection (i.e. omitting control evaluations), discontinuation of treatment and the animal’s death before starting chemotherapy, and chronic diseases unrelated to lymphoma.
Staging was established by the WHO system (Table 1) (Valli et al., 2011).
Table 1
Primary stages designated to represent canine lymphoma progression (Valli et al., 2011)
Stages Characteristics
Stage I Involvement of a single lymph node (or lymphoid tissue in a single organ) only Stage II Regional involvement of multiple lymph nodes (either in the front half or back
half of the body)
Stage III Generalised lymph node enlargement (this typically refers to enlargement of lymph nodes of the body
Stage IV Involvement of the liver and/or spleen
Stage V Involvement of blood, bone marrow, central nervous system or other organs Substages
Substage a Where there are no systemic signs of disease (i.e., the patient generally seems healthy and symptom free)
Substage b Where there ARE systemic signs of disease (i.e., the patient demonstrates general symptoms of feeling not well)
Treatment of patients was based on a modified Cyclophosphamide – Hy- droxyldaunorubicin® (doxorubicin) – Oncovin® (vincristine) – Prednisolone (CHOP)-based protocol (Cotter and Goldstein, 1987). Dosages used in this pro- tocol were: doxorubicin (Pharmacia and Upjohn S.p.A. Co., Milan, Italy) 30 mg/m2: weeks 1, 9, 19; vincristine (Hospira UK Limited, Hurley, UK) 0.75 mg/m2: weeks 2–9, then weeks 11–18; cyclophosphamide (Baxter Co., Deerfield, Illinois) 250 mg/m2: weeks 4, 7, 13, 16; prednisolone (Actavis UK Limited, Devon, UK) PO SID: week 1 – 2 mg/bwkg, week 2 – 1.5 mg/bwkg, week 3 – 1 mg/bwkg and week 4 – 0.5 mg/bwkg. This protocol was used for a total of 19 weeks. If the patient showed relapse after the initial protocol (CHOP), further treatment options were discussed with the owner, and upon request the Madison-Wisconsin protocol (L-CHOP) (Rassnick et al., 2007) was initiated, starting with L-Asparaginase injection (Health Biotech Ltd., Chandigarh, India) once in a dose of 400 IU/bwkg SC. Eighteen dogs received the CHOP-protocol only as first protocol. Four dogs received the L-CHOP protocol only as first pro- tocol. Ten dogs received both protocols (CHOP as first and L-CHOP as second).
The original aim was to use the L-CHOP protocol as first and second, but many owners refused to choose CHOP as a first protocol for financial reasons. The treatment protocols were carried out by the Oncology Team of the Faculty. Re- mission rate was estimated by measuring the size of the right prescapular lymph node using callipers at least in one dimension. Remission of lymph node size by 100% (complete remission) was recorded if the lymph node was normal in size or hardly palpable.
Biochemistry and haematology tests
Routine haematological and plasma biochemical parameters were deter- mined in the blood samples weekly or every third week (in the case of patients living in the countryside). These measurements were carried out in the clinical laboratory of the Department and Clinic of Internal Medicine, University of Vet- erinary Medicine, Budapest, by using a haematology analyser with veterinary software (Advia 120: Siemens Healthcare GmbH, Erlangen, Germany) and a clinical chemistry analyser (RX Daytona: Randox, Crumlin, UK) using commer- cial test kits (Diagnosticum Ltd., Budapest, Hungary). The reference values of different instruments were adjusted according to appropriate guidelines in order to obtain comparable results (Flatland et al., 2010). A qualitative blood count of each sample was performed using microscopic analysis of blood smears.
Evaluation of adverse drug effects
The adverse treatment effects were graded according to the recommenda- tions of the Veterinary Cooperative Oncology Group (2011). In addition, a cu- mulative score was also calculated in order to express overall adverse drug ef-
fects during the course of treatment by a single numerical value. The cumulative score was calculated from the number and grade of the episodes. Each numerical data was taken as a mathematical ‘event’, and a mean was calculated: cumulative score = number of all episodes + grade of the first episode + grade of the second episode etc., divided by the number of ‘events’. If relapse was suspected, routine blood work, X-ray and abdominal ultrasonography were performed.
Lymph node and bone marrow sampling and preparation
The lymph node and bone marrow samples were taken under general an- aesthesia. The dogs were anaesthetised [propofol (AstraZeneca Co., Cambridge, UK) 5 mg/bwkg iv., isoflurane (Abbott Ltd., Budapest, Hungary) 1.5–2.5 V/V%, fentanyl (Gedeon Richter PLC, Budapest, Hungary) by constant rate infusion at 0.01 to 0.04 mg/bwkg/h] and one of the enlarged (left prescapular) lymph nodes was excised for routine histological and immunohistochemical examination.
Bone marrow aspirates were taken for cytological analysis with a Jamshidi nee- dle from the iliac crest (crista iliaca externa). The aspirates were smeared and stained with the conventional panoptic [May-Grünwald and Giemsa (Sigma- Aldrich Co., Saint Louis, Missouri, USA)] procedure.
Histopathology and immunohistochemistry (IHC)
Tissues were routinely processed and sectioned at 3 µm and stained with haematoxylin and eosin. Serial sections of each case were placed on positively charged slides for further immunohistochemical labelling. All cases were la- belled immunohistochemically for B and T cell antigens following a routine pro- tocol. For immunophenotyping, CD3 was used for T-cell and CD79a for B-cell labelling by using rabbit anti-CD3 or mouse anti-CD79a antibody, respectively (DAKO Ltd., High Wycombe, UK). After diagnosing lymphoma, the tumours were graded according to the WHO classification scheme applied for canine lymphoma (Valli et al., 2011). The cases were grouped into diagnostic catego- ries: low-grade B-cell; high-grade B- and T-cell; low-grade T-cell; moreover, we subdivided the types (Valli et al., 2013). Grouping was determined by histologi- cal grade (based on mitotic rate/400 fields, with low-grade 0–5, intermediate 6–
10, and high-grade > 10) (Valli et al., 2013). The grading system was based on the original article written in 1986 (Carter et al., 1986) with additional further suggestions (Valli et al., 2013). To assess the proliferation status of the tumour the percentage of Ki67 positive cells was calculated after immunostaining the sections with the Ki67 marker MIB-118 (DAKO Ltd., High Wycombe, UK).
Approximately, a minimum of 150 (up to 500) cells were counted on each slide in 5 different zones of the section (Renwick et al., 2006).
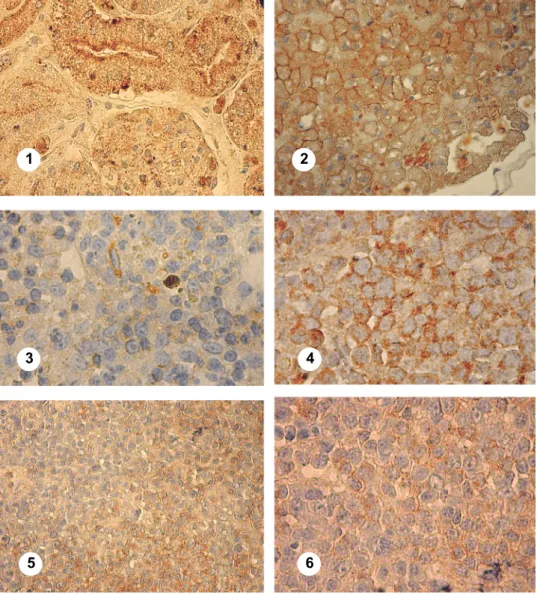
Fig. 1. (1) Canine kidney tissue serving as positive control. Brown granular membrane and intracytoplasmic staining indicate Pgp expression (×1000 magnification). (2) Canine liver tissue serving as positive control. Brown granular membrane and intracytoplasmic staining indicate Pgp
expression (×1000 magnification). (3) Canine lymph node tissue serving as negative control.
Weak, non-specific staining and granules (×1000 magnification). (4) T-lymphoblastic lympho- ma, Pgp 70%. Case 124833. Strong membrane and intracytoplasmic positivity (×1000 magnifica-
tion). (5) Diffuse large B-cell, centroblastic lymphoma (low mitotic index), Pgp 50% (×400 magni- fication). Case 151252. Weak membrane and intracytoplasmic positivity in the non-follicular and
strong in the follicular zone. (6) Diffuse large B-cell, centroblastic lymphoma (low mitotic in- dex), Pgp 50% (×1000 magnification). Case 123613. Weak membrane and intracytoplasmic
positivity
1 2
3 4
5 6
Pgp immunostaining
Immunostaining of Pgp was carried out using a method first described for canine tissues in 1996 (Ginn, 1996). MDR1 [using anti-P-glycoprotein, mono- clonal mouse C494 clone (Signet Laboratories Inc., Dedham, Massachusetts, USA)] was evaluated by IHC. Sections were deparaffinised, the endogenous pe- roxidase activity was quenched, then the antigen retrieval step was carried out using an unmasking solution (Signet Laboratories Inc., Dedham, Massachusetts, USA). Non-immune binding of the specific primary antibody was prevented by 4% normal horse serum (Vector Laboratories Ltd., Peterborough, UK). Sections were then incubated with the primary antibody (C494) diluted (1:40) in PBS. Af- ter a washing step, sections were incubated in avidin-biotin-peroxidase complex (ABC) solution of the immunodetection kit (BDH Laboratory Supplies Co., Poole, UK). The PBS-washed sections were then incubated in DAB solution (BDH Laboratory Supplies Co., Poole, UK). The final steps were washing in PBS and counterstaining with Mayer’s haematoxylin (Signet Laboratories Inc., Dedham, Massachusetts, USA) solution. Mounting was done with DPX mount- ing media (BDH Laboratory Supplies Co., Poole, UK).
According to the first relevant articles (Ginn, 1996; Lee et al., 1996) which used formalin-fixed, paraffin-embedded human hepatocellular carcinoma as a positive control, we used normal canine kidney and normal human and ca- nine liver tissues [Figure 1 (1, 2)] and normal canine lymph node tissue as nega- tive control. Additionally, an ‘internal negative control’ was prepared by replac- ing the primary antibody solution with PBS in one of the patient’s lymph node sections [Fig 1 (3)]. Tissue sections were evaluated with light microscope to de- termine the anti-Pgp positivity and the cellular location of the positive immuno- labelling. The percentage of Pgp-positive cells (labelling index) was evaluated semi-quantitatively by counting the number of labelled cells in 10 randomly se- lected high-power fields (HPFs, ×1000 magnification) using a four-point grid for each specimen. Peripheral areas of the section were not included during the ran- dom selection of HPFs to avoid misinterpretation of staining artefacts. The num- ber of neoplastic cells varied in different fields between 60 and 180 cells, and 500–1000 cells were counted on each slide. This was performed independently in a blinded fashion by two of the authors analysing two slides per paraffin- embedded specimen. Pgp expression was evaluated by using an adapted and later modified scoring system (Lee et al., 1996; Ramos-Vara and Miller, 2007). The reported four-point scoring system based on a 0 to 3 score depending on the number of positive neoplastic cells was as follows: 0 – positive cells < 10%; 1 – positive cells ≥ 10% to < 30%; 2 – positive cells ≥ 30% to < 75%; and 3 – posi- tive cells ≥ 75%. Staining intensity was evaluated independently of the scoring system. The specimens were qualified into four categories: 0 (no staining), 1 (weak but detectable above control) [Fig. 1 (6)], 2 (distinct) [Fig. 1 (5)], 3 (strong and minimal light transmission through stained nucleus) [Fig. 1 (5)]. In
order to establish the cut-off point for Pgp positivity % correlating best with overall survival time, dogs were divided into groups with increasing Pgp % in each step of the statistical analysis. First samples were regarded as negative if Pgp positivity was below 10%, then < 20% etc. up till < 60% (data are not shown).
Subsequently, ROC analyses were done to obtain the accurate cut-off points.
Statistical analysis
Median relapse-free periods (RFP) and median overall survival times (OST) were calculated from Kaplan-Meyer drawn survival curves. Differences in RFP and OST between groups were tested by Log-rank and Cox-proportional hazard tests. RFP was calculated from the time of complete remission until re- lapse occurred. OST was calculated from the time of diagnosis until the patient’s death. Censored data were used in the case of RFPs when the patient died before relapse and in the case of OSTs when the patient died of causes unrelated to the tumour.
For comparisons of proportions, Fisher’s exact test was used. Differences at P < 0.05 were considered statistically significant.
Specificity and sensitivity were calculated by ROC analysis to give prog- nostic indices.
For the comparison of specific laboratory and clinical parameters between groups, Student’s t-test (two-sample t-test assuming unequal variances) was used.
Statistical analysis was carried out using Microsoft Excel 2010, R version 3.0.20 (Foundation for Statistical Computing, Vienna, Austria)and Stats Direct Statistical Software version 3.0.194 (StatsDirect Ltd, Altrincham, UK).
Results
Animals. Overall, 33 dogs (18 males and 15 females) with histologically confirmed lymphoma fulfilled the inclusion criteria of completing the study.
Their average age was 7.36 (± 2.6) years; median: 7 (range: 3–13) years. Six mixed-breed dogs, four Rottweilers, three German Shepherds, three Hungarian Vizslas, two Cocker Spaniels, two Bullmastiffs, two Great Danes and one each of several other breeds (English Setter, Chow Chow, Bull Terrier, Samoyed, Ba- varian Mountain Hound, Irish Setter, Dachshund, Sarplaninac, Dogue de Bor- deaux, Bernese Mountain Dog and Shih Tzu) completed the study. Their average weight was 22.15 kg.
Clinical findings. Dogs during the first clinical examination were in the following stages: stage II (n = 1), stage III (n = 4), stage IV (n = 22), and stage V (n = 6). Histopathological examinations of the left prescapular lymph node of dogs revealed the following results: 26 (78.78%) dogs had high-grade (three B- lymphoblastic, 13 diffuse large B-cell with high mitotic index, eight peripheral
T-cell and two Burkitt-type), and only seven (21.21%) dogs had low-grade lym- phoma (five diffuse large B-cell, centroblastic lymphoma with low mitotic index, one Mantle cell and one clear T-zone).
Table 2
Adverse drug effects during the course of chemotherapy of 33 dogs treated for lymphoma (COPA and Madison-Wisconsin protocols)
Adverse events Grade Mean/
all
Mean/
symptoms 1 2 3 4 5
Vomiting (n = 12) 9 1 2
Episode 0.72 2.08
Cumulative 0.50 1.45
Anorexia (n = 20) 17 2 1
Episode 1.24 2.05
Cumulative 0.87 1.43
Diarrhoea (n = 28) 19 5 3 1
Grade – 1.46
Episode 1.30 1.65
Cumulative 1.14 1.44
Fever (n = 6) 5 1
Episode 0.30 1.67
Cumulative 0.23 1.28
Abscess (n = 12) 11 1
Episode 0.45 1.25
Cumulative 0.42 1.13
Alopecia (n = 8) 7 1
Episode 0.30 1.25
Cumulative 0.29 1.19
Pneumonitis (n = 7) 7
Episode 0.30 1.43
Cumulative 0.24 1.11
Cystitis (n = 3) 3
Episode 0.15 1.67
Cumulative 0.11 1.17
Neutropenia (n = 6) 5 1
Episode 0.24 1.14
Cumulative 0.21 1.14
Thrombocytopenia (n = 15) 9 3 3
Episode 0.73 1.6
Cumulative 0.69 1.5
Acute death (n = 1) 1 5 5
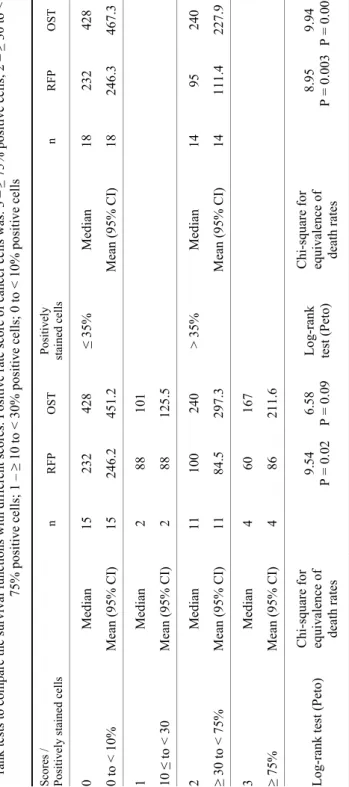
Table 3 Mean and median overall survival time (OST) and relapse-free period (RFP) in different scoring systems with sample sizes and P values of log- rank tests to compare the survival functions with different scores. Positive rate score of cancer cells was: 3 –≥ 75% positive cells; 2 – ≥ 30 to < 75% positive cells; 1 –≥ 10 to < 30% positive cells; 0 to < 10% positive cells Scores / Positively stained cells n RFP OSTPositively stained cells n RFP OST 0 Median15 232 428 ≤ 35% Median18 232 428 0 to < 10%Mean (95% CI)15 246.2451.2Mean (95% CI)18 246.3467.3 1 Median2 88 101 10 ≤ to < 30Mean (95% CI)2 88 125.5 2 Median11 100 240 > 35%Median14 95 240 ≥ 30 to < 75%Mean (95% CI)11 84.5297.3Mean (95% CI)14 111.4227.9 3 Median4 60 167 ≥ 75% Mean (95% CI)4 86 211.6 Log-rank test (Peto)Chi-square for equivalence of death rates
9.54 P = 0.02 6.58 P = 0.09 Log-rank test (Peto) Chi-square for equivalence of death rates
8.95 P = 0.0039.94 P = 0.002
Treatment outcomes. Eighteen dogs received an initial CHOP protocol only, 10 dogs had an additional L-CHOP protocol, while four dogs had only an L- CHOP protocol as induction chemotherapy. The chemotherapy-related side ef- fects (number of episodes, grades and cumulative scores) are presented in Table 2.
One dog died right after the first administration of chemotherapy (doxorubicin), and this dog was not included in the survival analysis done by the log-rank tests.
Four dogs did not show relapse before the end of their life. Three of them died before the end of the first chemotherapy regimen. These data were censored in respect of relapse-free period (RFP) evaluation. There was only one dog which did not show relapse after the end of the first chemotherapy regimen.
The median RFP of all patients was 134 [95% confidence interval (CI):
95–232] days; the median OST was 333 (95% CI: 240–540) days. In this study, 11 dogs died and five showed relapse after one year. The longest survival was 790 days. Eleven dogs died earlier than completing the 19 weeks of the first CHOP protocol. Relapse was detected in 17 dogs (51.51%) earlier than complet- ing the 19 weeks of the first CHOP protocol. After relapse two of the dogs did not receive additional chemotherapy at the owner’s request due to their deterio- rated state (censored). Ten dogs received a second cycle protocol (L-CHOP) af- ter relapse. The median OST and RFP of dogs treated with CHOP protocol only (n = 18) was 150 and 95 days, respectively, in dogs treated with L-CHOP proto- col only (n = 4) 135 and 100 days, respectively, and in dogs treated with both protocols (n = 10) 404 and 243 days, respectively. Differences of OSTs and RFPs were statistically non-significant in dogs treated by one protocol (either CHOP or L-CHOP) only. Dogs which received the first protocol (CHOP) and a second one (L-CHOP) was initiated showed significantly higher survival times than those treated with one protocol (CHOP or L-CHOP) (P = 0.022) by Cox proportional hazards regression test. The median OST values were 165.3 (one protocol) and 414.3 days (two protocols), respectively. Most of the dogs had complete remis- sion (CR) (n = 22), 8 dogs partial remission and three had poor remission (60%, 50%, 40%). In 22 dogs the primary tumour or the relapse was identified as the primary cause of death. From the other 11 dogs in 9 cases inflammatory, septic and/or adverse drug effects were determined as a cause of death, and in two dogs it was not possible to determine clinically whether the primary cause of death was the tumour burden or an adverse drug effect.
Immunophenotype. Twenty-four (72.72%) of the lymphomas belonged to B-cell and 9 (27.27%) to T-cell type. Dogs with B-cell lymphomas had non- significantly longer median OST (253 days) and RFP (167 days) than dogs with T-cell lymphomas (150 and 81 days, respectively).
Stage and sub-stage. The OST of stage IV cases (n = 22, median: 415 days) differed from other stages significantly, like stage II (n = 1, median: 135 days), III (n = 4, median: 124 days) and V (n = 6, median: 150 days) (P =
0.0174). The OST of sub-stages did not differ significantly (‘a’: n = 15, median:
404 days; ‘b’: n = 244, median: 124 days).
Gender. The OST of genders was not significantly different (males: n = 18, median: 342 days; females: n = 15, median: 244 days).
Ki67%. The average Ki67% was 56.2 (± 16.8). Cut-off point was estab- lished by ROC analysis: ≤ 30% for both OST and RFP. The OST of the cases with Ki67 ≤ 30% (n = 5, median: 415 days) and > 30% (n = 28, median: 244 days) differed significantly (P = 0.0249), and the RFP ≤ 30% (n = 5, median: 384 days) and > 30% (n = 28, median: 105 days) was not significantly different.
Pgp staining. Positive cells appeared with brownish granules, which were clearly visible in the plasma membrane of the neoplastic lymphoid cells and sometimes also in the cytoplasm. The overall mean Pgp percentage of positively stained cells was 32.3% (± 30.1).
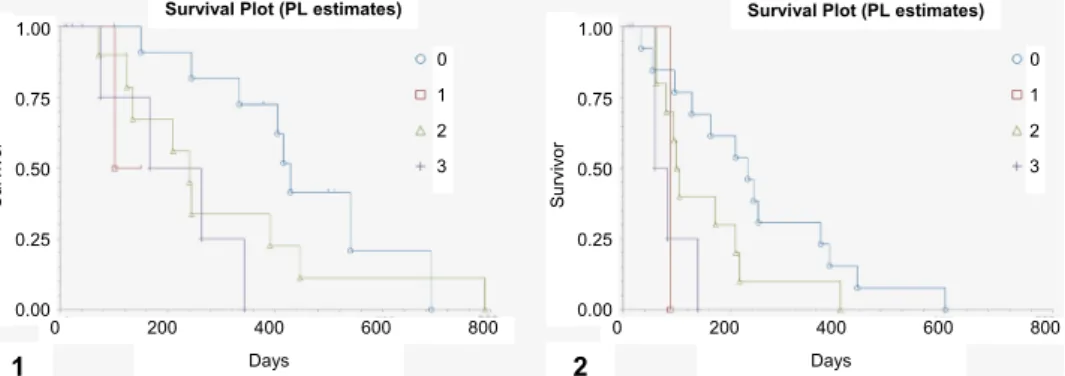
Pgp scoring. Based on the scoring system 15 lymphomas were classified as negative staining (score 0) and 18 as positive (score 1 or higher): scores 1, 2 and 3 were recorded in 2, 11 and 4 cases, respectively. OSTs and RFPs were sig- nificantly different among scores 0, 1, 2 and 3 (Table 3, Fig. 2). The cut-off point of OST and RFP based upon the percentage of positively stained cells with Pgp immunostaining was 35%. ROC analysis was performed with Pgp staining < 35%
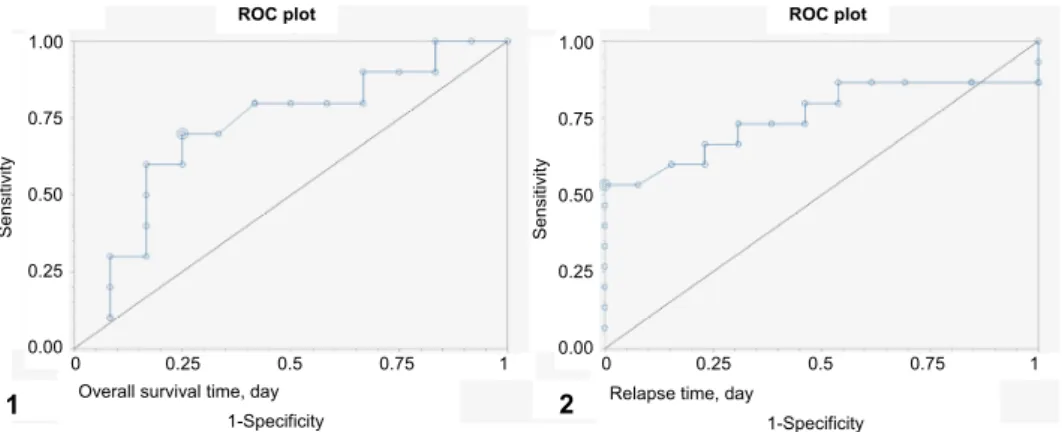
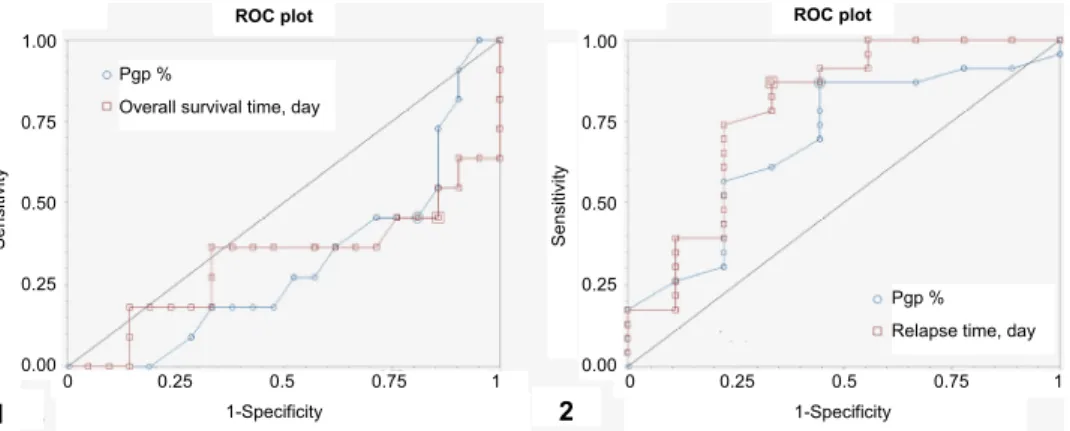
and ≥ 35% using censored data (Fig. 3). Sensitivity and specificity for survival were 0.7 and 0.75, respectively, while the corresponding figures for relapse were 0.533 and 1, respectively. Based upon Pgp staining % OST (P = 0.0027) and RFP (P = 0.004) with ≥ 35% positively stained cells were 240 and 95 days, while those with < 35% Pgp positivity were 428 and 232 days, respectively (OST: P = 0.0027; RFP: P = 0.004) (Fig. 4).
Fig. 2. Differences in (1) overall survival time (OST) and (2) relapse-free period (RFP) between groups showing Pgp positivity scores 0–3. Positive rate score of cancer cells was: 3 – ≥ 75% posi- tive cells; 2 – ≥ 30 to < 75% positive cells; 1 – ≥ 10 to < 30% positive cells; 0 – < 10% positive cells. Cox proportional analysis. Score (1): b1 = 1.723124, z = 1.546224, p = 0.1221, Score (2):
b2 = 0.730133: z = 1.622024, p = 0.1048, Score (3): b3 = 1.765823, z = 2.688298, p = 0.0072
Days 1.00
0.75
0.50
0.25
0.00
Survivor
0 1 2 3
0 200 400 600 800 Survival Plot (PL estimates)
1 Days
1.00
0.75
0.50
0.25
0.00
Survivor
0 1 2 3
0 200 400 600 800 Survival Plot (PL estimates)
2
Fig. 3. ROC curves for (1) overall survival time (OST) and (2) relapse-free period (RFP) using censored data with Pgp < 35% and ≥ 35%. Estimated cut-off values: 333 days for OST and 232 days for RFP. A test with perfect discrimination (no overlap in the two distributions) has a ROC curve that passes through the upper left corner (100% sensitivity, 100% specificity). The closer the
ROC curve is to the upper left corner, the higher the overall accuracy of the test
Fig. 4. Differences in (1) overall survival time (OST) and (2) relapse-free period (RFP) between groups showing Pgp positivity rate of cancer cells with cut-off values ≥ 35% and < 35%. Cox pro- portional analysis. Survival: deviance/likelihood ratio/chi-square = 9.017812, df = 1, P = 0.0027)
and RFP (deviance/likelihood ratio/chi-square = 8.284659, df = 1, P = 0.004.
Relapse: deviance/likelihood ratio/chi-square = 8.284659, df = 1, P = 0.004
Pgp staining intensity. Pgp staining intensity was classified as weak in 14, distinct in 6 and strong in 13 cases. Strong plus distinct staining intensity was found significantly (P = 0.0028) more often in T-cell lymphomas (8 of the 9 cas- es) than in B-cell lymphomas (11 of the 24 cases). There was a quite marked and statistically significant (P = 0.016) difference between the weak (n = 14) and the distinct plus strong (n = 19) Pgp staining concerning the OST (median: 428 days and 240 days, respectively) and the RFP (median: 221 days and 103 days, re- spectively) (P = 0.0466).
Overall survival time, day
1-Specificity 1.00
0.75
0.50
0.25
0.00
Sensitivity
0 0.25 0.5 0.75 1 ROC plot
1 2
ROC plot 1.00
0.75
0.50
0.25
0.00
Sensitivity
0 0.25 0.5 0.75 1 Relapse time, day
1-Specificity
Days 1.00
0.75
0.50
0.25
0.00
Survivor
1 2
0 200 400 600 800 Survival Plot (PL estimates)
1 Days
Survivor
0 200 400 600 800 Survival Plot (PL estimates)
2
1 2 1.00
0.75
0.50
0.25
0.00
Adverse drug effects compared to Pgp values. ROC analysis was per- formed to assess whether Pgp IHC can also be used to predict the possible cause of death (adverse drug effect or relapse). Death due to adverse drug effect (medi- an: 123 days, n = 11) could be best predicted using Pgp cut-off values ≤ 6.5%
(sensitivity 0.55, specificity 0.81; positive and negative predictive values: 0.66, and 0.77, respectively) and 123 days (sensitivity 0.55, specificity 0.86; positive and negative predictive values: 0.78, and 0.23, respectively) (Fig. 5). Death due to relapse (median: 140 days, n = 23) could be best predicted in patients with values > 6.5% Pgp positivity (sensitivity 0.87, specificity 0.55; positive and neg- ative predictive values: 0.83 and 0.63, respectively) and 124 days (sensitivity 0.87, specificity 0.66; positive and negative predictive values: 0.87, and 0.66, re- spectively) (Fig. 5).
Fig. 5. ROC curve for (1) death due to adverse drug effect, which can be best predicted with cut-off values ≤ 6.5% and 123 days (n = 11). ROC curve for (2) death due to relapse, which can be best predicted with cut-off values > 6.5% and 124 days (n = 23). A test with perfect discrimination (no overlap in the two distributions) has a ROC curve that passes through the upper left corner (100% sensitivity, 100% specificity). The closer the ROC curve is to the upper left corner, the
higher the overall accuracy of the test
The frequency of most clinical signs due to adverse drug effects was not remarkably different. The frequency of diarrhoea was 2.20 ± 1.25 and 0.91 ± 0.77 (P = 0.014) (cumulative score: 1.67 ± 0.48 and 0.9 ± 0.67, P = 0.001), re- spectively, in Pgp negative (≤ 6.5%) and positive (> 6.5%) cases.
Discussion
Treatment outcomes. Our treatment results do not differ markedly from those of other contemporary studies (Valli et al., 2013; Aresu et al., 2015). The clinical data were not different from those obtained in the large variety of studies con- cerning the number of different stages, the response to treatment (remission %),
1-Specificity 1.00
0.75
0.50
0.25
0.00
Sensitivity
0 0.25 0.5 0.75 1 ROC plot
1 2
ROC plot
Sensitivity
0 0.25 0.5 0.75 1 1-Specificity 1.00
0.75
0.50
0.25
0.00 Pgp %
Overall survival time, day
Pgp % Relapse time, day
and the ratio of high- and low-grade and B- or T-cell phenotype. Most of the clinical and histopathological data obtained in our prospective study correspond well to the previously described general clinical findings of canine lymphoma. In addition, dogs in rural areas received suboptimal care. Our overall survival data (median OST: 333 days, RFP: 134 days), however, did not differ notably from those of others (median OST: 246 days, RFP: 137 days) (Dhaliwal et al., 2013).
Immunophenotype. The difference between high-grade T- and B-cell types in OST values is well known. T-cell and B-cell types showed different OSTs and RFPs. In the present report slightly higher median values were found (high-grade T-cell: 240, all T-cell: 150 days; high-grade B-cell: 404, all B-cell: 253 days) than in the aforementioned report (55 days for T-cell lymphoma, 200 and 256 days for indolent and aggressive B-cell lymphoma, respectively) (Dhaliwal et al., 2013).
Ki67%. The average Ki67% (56.2 ± 16.8) obtained in this study is slightly higher than the 34.5% (± 16.8), 30.2 (± 10.8) values found in earlier studies (Bauer et al., 2007), although the number of cases were 10 and 19, respectively.
Our cut-off value (≤ 30%) for OST corresponded to a previous report which stat- ed that Ki-67% was significantly different between groups of dogs with lym- phomas with less than 20% Ki-67-positive cells and with 40–60% Ki-67-positive cells (Kiupel et al., 1999).
Pgp staining. The percentage of positive Pgp staining cases (54.5%) found in our study is higher than that reported in a paper published in 1996 (27.3%;
Ginn, 1996). Another article published in 1996 reported a lower percentage of Pgp positivity (33%; Lee et al., 1996) than that found by us. In pretreated non- Hodgkin’s lymphoma of humans, the reported incidence of Pgp staining varied from 2 to 49% in untreated patients and 64% in pretreated patients, while with mRNA analysis these figures were 22 ± 50% and 30 ± 60%, respectively (Sonne- veld, 2000). Another report on dogs has documented that positive IHC reaction with Pgp was found in 12/25 (48%) cases of various morphological subtypes of lymphomas with < 10% cut-off value (Sokołowska et al., 2015), whereas Dhali- wal et al. (2013) has reported that 19% of lymphoma cases were Pgp negative and 80% were Pgp positive with 50% cut-off value. These discrepant findings can be attributed to various factors such as stronger antigen retrieval in the cur- rent methodology, and also by the reasonably higher number of T-cell type (27.7%) cases. Although other authors did not find significant differences in Pgp
% between T- and B-cell phenotypes (Lee et al., 1996), we have found a signifi- cant difference.
Pgp scoring. In conformity with previous studies (Drénou et al., 1998), the prognostic value of Pgp IHC concerning survival and relapse is more prominent between the lower (0, 1) and higher (2, 3) scores. The cut-off value (≥ 35% and
< 35%) between scores 1 and 2 versus 3 and 4 seems to be mathematically justi- fied.
Pgp staining intensity. There was a marked difference in OST between pa- tients with strong vs. weak staining, which is consistent with previous results (Lee et al., 1996). Moreover, T-cell phenotype lymphomas stained markedly stronger.
Pgp staining as a prognostic tool. The association between ABC trans- porter expressions and clinical outcomes in patients with lymphoma has been controversial. The importance of Pgp determination as a prognostic tool in ca- nine lymphoma has been examined and proved by earlier studies (Bergman et al., 1996; Lee et al., 1996). The original study published in 1996 reported Pgp im- munohistochemistry (C219) as an important prognostic tool (Bergman et al., 1996). However, other studies have reported different findings. In one of these papers the authors stated that ABC transporter gene expression in pretreatment samples was not predictive of the length of the first disease-free period or overall survival (Zandvliet et al., 2015). Another article also reported that the difference between the median OST for Pgp-positive and Pgp-negative cases (246 days and 418 days, respectively) was non-significant (P ≤ 0.762) (Dhaliwal et al., 2013).
In spite of all these assumptions, however, we have found an influence of pre- treatment Pgp expression on survival when using a proper cut-off value. It was previously suggested that a 10% cut-off value could have prognostic importance;
however, it seems that statistically more significant results are obtained by higher cut-off values (Bergman et al., 1996). It is important to censor the patients’ data according to the cause of their death to reach more accurate conclusions. Based on our censored data [with lymphoma-related (i.e. relapse) or non-lymphoma- related death (i.e. adverse drug effects)], an approximately 400-day median sur- vival could be predicted with a Pgp < 35% (or a score of 0 and 1), compared to the approximate median survival of 200 days with a Pgp ≥ 35 (scores 2 and 3).
Calculating with non-censored data underestimates these results: the median OSTs with our cut-off value are 333 days with < 35% and 189 days with ≥ 35%
(P = 0.0369).
We suggest that there are many factors that can influence the prognostic value of this method: (1) modifications in methodology (retrieval process and in- cubation time, affinity of the antibody clone to antigens (Ginn, 1996; Lee et al., 1996; Dhaliwal et al., 2013); (2) application of the counting system, such as manual or image analysis and the number of cells examined (Bergman et al., 1996; Ginn, 1996; Lee et al., 1996; Dhaliwal et al., 2013); (3) previous develop- ment of MDR in patients – i.e. due to previous corticosteroid treatment (Tsuji- mura et al., 2005) before starting the treatment against lymphoma; (4) the source of patients – immunophenotype and histopathological type (Sokołowska et al., 2015); (5) chemotherapy – especially whether the drugs used are substrates of Pgp (doxorubicin, vincristine, cyclophosphamide, etoposide, etc.) or not (L- asparaginase, lomustine) (Tse and Kwong, 2013); in the study of Dhaliwal et al.
(2013), the patients were treated with an L-Asparaginase based therapy, which
markedly reduced the number of Pgp-positive cells, too; this is why they did not achieve a significant alteration, in contrast to patients reported in an aforemen- tioned article (Lee et al., 1996) and to our patients of which 18 were treated with the CHOP protocol without L-Asparaginase); (6) sensitivity to adverse reactions which requires a chemotherapy dose adjustment or a change which contributes to MDR development (Bergman, 2000); (7) proper evaluation of the time of relapse and death; (8) censoring of the data according to the lymphoma-related or non- lymphoma-related causes of death; (9) the development of other non-ABC- transporter-based factors which also cause MDR, such as the cytochrome P450 system (Grandjean et al., 2002) or antioxidants (Cort et al., 2016). All these ef- fects can influence the clinical data and are superimposed on the simple drug ef- flux effect which contributes to treatment outcome.
Adverse drug effects compared to Pgp values. The most frequent adverse drug effect observed in our study was diarrhoea. The cumulative grading, how- ever, revealed that diarrhoea, anorexia and thrombocytopenia were the most seri- ous side effects of treatment which is consistent with the findings of other au- thors (Dhaliwal et al., 2013). The death of patients due to relapse can be predict- ed with a Pgp ≥ 6.5%, in the same way as death due to adverse drug effects.
There is a report showing higher survival data in patients with neutropenia dur- ing the course of chemotherapy treatment, which suggests that this adverse drug effect is a consequence of low Pgp expression in normal and tumorous tissues (Wang et al., 2015). This concept is proven by a recent article which reports that basal and follow-up MDR1 gene expression levels could be of predictive value for the occurrence of severe adverse drug reactions and/or the development of MDR during chemotherapy (Gramer et al., 2015). We examined whether the pre- treatment tumour tissue shows a similarity to normal drug resistance function in vivo. It was found that there is a relatively low sensitivity (0.55) and high speci- ficity (0.81) to predict death and, in contrast, the prediction of death due to re- lapse had a high sensitivity (0.87) and low specificity (0.66). Clinical signs of adverse drug effects occurred more commonly in Pgp-negative than in Pgp- positive cases, especially at Pgp ≤ 6.5%. Although it is likely that the association was simply due to the fact that Pgp-negative cases lived longer and had more chemotherapy administrations, and therefore more adverse drug reactions oc- curred.
Drug exposure causes cellular death both in the tumour and in normal cells which causes remission of the tumour and side effects such as increased suscep- tibility to infections. It is possible that the inherited ability of the patient’s cells to expel or metabolise chemotherapeutic agents causes the corresponding tumour cells to develop multiple drug resistant (MDR) ability, too (Bergman et al., 1996). The MDR process can cause less remission (earlier relapse) and less clini- cal side effects. Nevertheless, cells possess not only genetic but also acquired re- sistance to drugs (Mealey et al., 1998).
The greatest limitation of this study is the rather low number of the cases examined. The higher RFP and OST values with negative pretreatment lymph node Pgp expression found by us conforms to the findings of other authors who stated that the poor prognosis of canine lymphoma can be attributed to resistance to chemotherapy due to increased Pgp expression (Lee et al., 1996; Ramos-Vara and Miller, 2007).
In summary, we suggest that staining intensity needs to be evaluated in IHC methods. It is also suggested that not only the different methods provide dif- ferent results, but also that Pgp expression will serve as a prognostic tool in those patients which are treated mostly with Pgp substrates.
If a method has been evaluated properly, it could be used, but proper cut- off values should be established. Adverse drug effects seem to be weakly de- pendent on Pgp expression in pretreatment tumours. The evaluation of Pgp ex- pression gives information about tumour cell resistance and not about the whole therapeutic response of the animal. As has been stated in other reports (Zandvliet et al., 2015), long-term follow-up studies could add even more value to Pgp im- munohistochemistry in canine lymphoma.
We can state that Pgp immunohistochemistry serves as a diagnostic tool which can be used as a basis of ‘patient-tailored medicine’. With intensive and high (> 35%) Pgp staining of canine lymphoma cells, the treating veterinarian should use those regimens which are based upon non-Pgp substrates, such as L- Asparaginase, lomustine, etc.
Acknowledgements
We would like to express our thanks to Jenő Reiczigel DVM, PhD (Head of the Department of Biomathematics, University of Veterinary Medicine, Budapest, Hungary) and to András Székely DVM who have helped us edit the language of the manuscript.
Special thanks are due to Professor Erik Teske (Faculty of Veterinary Medicine, Utrecht University) for his wise advices and encouragement. This research received support from the National Research, Development and Innovation Fund (NKFIA), Hungarian Scien- tific Research Fund (OTKA), grant No. 68376. The publication of this research was sup- ported by the 17896-4/2018/FEKUTSTRAT grant of the Hungarian Ministry of Human Resources.
References
Aresu, L., Martini, V., Rossi, F., Vignoli, M., Sampaolo, M., Aricò, A., Laganga, P., Pierini, A., Frayssinet, P., Mantovani, R. and Marconato, L. (2015): Canine indolent and aggressive lymphoma: clinical spectrum with histologic correlation. Vet. Comp. Oncol. 13, 348–362.
Bauer, N. B., Zervos, D. and Moritz, A. (2007): Argyrophilic nucleolar organizing regions and Ki67 equally reflect proliferation in fine needle aspirates of normal, hyperplastic, inflamed, and neoplastic canine lymph nodes (n = 101). J. Vet. Intern. Med. 21, 928–935.
Bergman, P. J. (2000): Multidrug resistance. In: Kirk, R. W. (ed.) Current Veterinary Therapy XIII.
W. B. Saunders, Philadelphia, PA. pp. 479–482.
Bergman, P. J. (2003): Mechanisms of anticancer drug resistance. Vet. Clin. North Am. Small Anim. Pract. 33, 651–667.
Bergman, P. J., Ogilvie, G. K. and Powers, B. E. (1996): Monoclonal antibody C219 immuno- histochemistry against P-glycoprotein: sequential analysis and predictive ability in dogs with lymphoma. J. Vet. Intern. Med. 10, 354–359.
Brenn, S. H., Couto, S. S., Craft, D. M., Leung, C. and Bergman, P. J. (2008): Evaluation of P- glycoprotein expression in feline lymphoma and correlation with clinical outcome. Vet.
Comp. Oncol. 6, 201–211.
Carter, R. F., Valli, V. E. and Lumsden, J. H. (1986): The cytology, histology and prevalence of cell types in canine lymphoma classified according to the National Cancer Institute Work- ing Formulation. Can. J. Vet. Res. 50, 154–164.
Cort, A., Ozben, T., Saso, L., De Luca, C. and Korkina, L. (2016): Redox control of multidrug re- sistance and its possible modulation by antioxidants. Oxid. Med. Cell Longev. 2016, Arti- cle ID 4251912, 17 pages.
Cotter, S. M. and Goldstein, M. A. (1987): Comparison of two protocols for maintenance of remis- sion in dogs with lymphoma. J. Am. Vet. Assoc. 23, 495–499.
Dhaliwal, R. S., Kitchell, B. E., Ehrhart, E., Valli, V. E. and Dervisis, N. G. (2013): Clinicopatho- logic significance of histologic grade, pgp, and p53 expression in canine lymphoma. J. Am.
Anim. Hosp. Assoc. 49, 175–184.
Drénou, B., Amiot, L., Lamy, T., Le Prisé, P. Y. and Fauchet, R. (1998): Multidrug resistance in aggressive lymphoproliferative disorders of T and natural-killer origin. Leuk. Lymphoma 30, 381–387.
Flatland, B., Freeman, K. P., Friedrichs, K. R., Vap, L. M., Getzy, K. M., Evans, E. W. and Harr, K. E. (2010): ASVCP quality assurance guidelines: control of general analytical factors in veterinary laboratories. Vet. Clin. Pathol. 39, 264–277.
Ginn, P. E. (1996): Immunohistochemical detection of P-glycoprotein in formalin-fixed and paraf- fin-embedded normal and neoplastic canine tissues. Vet. Pathol. 33, 533–541.
Gramer, I., Kessler, M. and Geyer, J. (2015): Determination of MDR1 gene expression for predic- tion of chemotherapy tolerance and treatment outcome in dogs with lymphoma. Vet.
Comp. Oncol. 13, 363–372.
Grandjean, F., Brémaud, L., Robert, J. and Ratinaud, M. H. (2002): Alterations in the expression of cytochrome c oxidase subunits in doxorubicin-resistant leukemia K562 cells. Biochem.
Pharmacol. 63, 823–831.
Honscha, K. U., Schirmer, A., Reischauer, A., Schoon, H. A., Einspanier, A. and Gäbel, G. (2009):
Expression of ABC-transport proteins in canine mammary cancer: consequences for chem- otherapy. Reprod. Domest. Anim. 44, S218–S223.
Kiupel, M., Teske, E. and Bostock, D. (1999): Prognostic factors for treated canine malignant lym- phoma. Vet. Pathol. 36, 292–300.
Lee, J. J., Hughes, C. S., Fine, R. L. and Page, R. L. (1996): P-glycoprotein expression in canine lymphoma: a relevant, intermediate model of multidrug resistance. Cancer 77, 1892–1898.
Mealey, K. L., Barhoumi, R., Rogers, K. and Kochevar, D. T. (1998): Doxorubicin induced expres- sion of P-glycoprotein in a canine osteosarcoma cell line. Cancer Lett. 126, 187–192.
Mealey, K. L., Bentjen, S. A. and Waiting, D. K. (2002): Frequency of the mutant allele associated with ivermectin sensitivity in a sample of collies from the northwestern United States. Am.
J. Vet. Res. 63, 479–481.
Ramos-Vara, J. A. and Miller, M. A. (2007): Immunohistochemical detection of protein gene product 9.5 (PGP 9.5) in canine epitheliotropic T-cell lymphoma (mycosis fungoides). Vet.
Pathol. 44, 74–79.
Rassnick, K. M., McEntee, M. C., Erb, H. N., Burke, B. P., Balkman, C. E., Flory, A. B., Kiselow, M. A., Autio, K. and Gieger, T. L. (2007): Comparison of 3 protocols for treatment after induction of remission in dogs with lymphoma. J. Vet. Intern. Med. 21, 1364–1373.
Renwick, M. G., Argyle, D. J., Long, S., Nixon, C., Gault, E. A. and Nasir, L. (2006): Telomerase activity and telomerase reverse transcriptase catalytic subunit expression in canine lym- phoma: correlation with Ki67 immunoreactivity. Vet. Comp. Oncol. 4, 141–150.
Rochat, B. (2005): Role of cytochrome P450 activity in the fate of anticancer agents and in drug resistance: focus on tamoxifen, paclitaxel and imatinib metabolism. Clin. Pharmacokinet.
44, 349–366.
Sokołowska, J., Urbańska, K., Giziński, S., Zabielska, K. and Lechowski, R. (2015): Immunohisto- chemical detection of P-glycoprotein in various subtypes of canine lymphomas. Pol. J. Vet.
Sci. 18, 123–130.
Sonneveld, P. (2000): Multidrug resistance in haematological malignancies. J. Intern. Med. 247, 521–534.
Tomiyasu, H., Watanabe, M., Goto-Koshino, Y., Fujino, Y., Ohno, K., Sugano, S. and Tsujimoto, H. (2013): Regulation of expression ABCB1 and LRP genes by mitogen-activated protein kinase/extracellular signal-regulated kinase pathway and its role in generation of side population cells in canine lymphoma cell lines. Leuk. Lymphoma 54, 1309–1315.
Tse, E. and Kwong, Y. L. (2013): How I treat NK/T-cell lymphomas? Blood 121, 4997–5005.
Tsujimura, S., Saito, K., Nakayamada, S., Nakano, K. and Tanaka, Y. (2005): Clinical relevance of the expression of P-glycoprotein on peripheral blood lymphocytes to steroid resistance in patients with systemic lupus erythematosus. Arthritis Rheum. 52, 1676–1683.
Vail, D. M. and MacEwen, E. G. (2000): Spontaneously occurring tumors of companion animals as models for human cancer. Cancer Invest. 18, 781–792.
Valli, V. E., Kass, P. H., San Myint, M. and Scott, F. (2013): Canine lymphomas: association of classification type, disease stage, tumor subtype, mitotic rate, and treatment with survival.
Vet. Pathol. 50, 738–748.
Valli, V. E., San Myint, M., Barthel, A., Bienzle, D., Caswell, J., Colbatzky, F., Durham, A., Ehrhart, E. J., Johnson, Y., Jones, C., Kiupel, M., Labelle, P., Lester, S., Miller, M., Moore, P., Moroff, S., Roccabianca, P., Ramos-Vara, J., Ross, A., Scase, T., Tvedten, H. and Ver- nau, W. (2011): Classification of canine malignant lymphomas according to the World Health Organization criteria. Vet. Pathol. 48, 198–211.
Veterinary Cooperative Oncology Group (2011): Common terminology criteria for adverse events (VCOG-CTCAE) following chemotherapy or biological antineoplastic therapy in dogs and cats v1.1. Vet. Comp. Oncol. 14, 417–446.
Wang, S. L., Lee, J. J. and Liao, A. T. (2015): Chemotherapy-induced neutropenia is associated with prolonged remission duration and survival time in canine lymphoma. Vet. J. 205, 69–73.
Zandvliet, M., Teske, E., Schrickx, J. A. and Mol, J. A. (2015): A longitudinal study of ABC trans- porter expression in canine multicentric lymphoma. Vet. J. 205, 263–271.