Rossen TKATCHENKO
THE USE OF METHANE AS AUTOMOTIVE FUEL –
A STEP TO SUSTAINABLE ECONOMY?
Natural gas generally consists of methane (CH4), whose content – depending on the origin – can vary between 80 and 99% (GAZPROM Germania, 2012). Other components include ethane (C2H6), propane (C3H8), butane (C4H10), as well as other non-hydrocarbon sub- stances: hydrogen (H2), hydrogen sulphide (H2S), car- bon dioxide (CO2), nitrogen (N2), helium (He). When compressed at 200 bar and used as fuel for internal
combustion engines, the more efficient burning process of natural gas results in lower green house gas emis- sions – significantly lower than with traditional petrol fuels (Bordelanne et al., 2011). In particular, according to NGVA Europe theoretically the CO2 emissions can be reduced close to 30% compared to gasoline inter- nal combustion engine (see Table 1). When replacing gasoline with CNG CO emissions can be reduced by The introduction of CNG (Compressed Natural Gas) as automotive fuel began in Italy as early as in mid- 1930s, and ever since the Italian market has always been highly advanced in this regard. Many other countries followed, some of them quite recently, but nevertheless with impressive results. The appeal of this automotive fuel is based on the fact that compared to gasoline, diesel and LPG (Liquefied Petroleum Gas), CNG is cleaner and cheaper; even more so, this fuel is renewable – it can be produced locally from biogas.
Despite its obvious benefits, CNG is barely present in Hungary. This article provides an insight into the topic, highlights obstacles to introduction and suggests appropriate governmental steps. The information is intended to support the activities and the decision-making process of governmental officials, municipalities, car-fleet managers, car dealers and their service departments.
Keywords: CNG (Compressed Natural Gas), automotive fuel, sustainable economy
Fuel % (weight) Hydrogen LHV MJ/kg LHV kWh/kg g CO2 per kWh Theoretical % CO2 reduction Methane (NG/
biomethane) 25,0% 50,0 13,89 198,0 29,2
Propane (LPG) 18,2% 45,6 12,67 236,8 15,3
Butane (LPG) 17,2% 45,3 12,58 241,2 13,7
Diesel 13,5% 42,7 11,86 267,5 4,3
Gasoline 13,5% 42,4 11,77 279,5 0,0
The second-last column of the above table shows the tailpipe CO2 emission resulting from the burning of one kWh (LHV – lower heating value) of each respective fuel.
The last column shows the theoretical reduction of CO2 emissions, compared to gasoline in vehicles with identical properties and with identical engine efficiency.
Table 1 Comparison of automotive fuels by Hydrogen content, LHV (lower heating value) per kg, and CO2 emissions
Source: NGVA Europe, Fact Sheet: NG/biomethane used as vehicle fuel (2009: p. 3.)
60–80%, and the reduction can be 70–90% if diesel fuel is replaced. The resulting lower emissions of NOx, SO2, and practically non-existent particular matter and volatile organic compounds ensure improvement of lo- cal air quality, apart from reducing the traffic noise (see Table 2). In addition to the above, vehicles operating on CNG produce no cold-start emissions.
Among other advantages of CNG as automotive fuel one can mention the present availability of natural gas resources, the existing supply infrastructure, and the fact that CNG is safer and cheaper than gasoline, diesel and LPG.
For reference, Liquefied Petroleum Gas (LPG) is a co-product of natural gas and crude oil production, a mixture of propane and butane. LPG produces fewer pollutants than conventional fuels (gasoline, diesel), but it is inferior to CNG, though its CO2 emission is more or less the same as that of CNG.
Moreover, based on its content, perhaps the most valuable advantage of using CNG as automotive fuel from environmental point of view is that in due time natural gas can be smoothly substituted by biogas, pro- viding in the long term a relatively easy transition to the much desired renewable fuels. A similar opinion can be found in the “Energy Technology Perspectives” study (International Energy Agency, 2010): “Deep CO2 emis- sions reductions in transport can be achieved through more efficient vehicles, a shift towards electricity and biofuels, and progressive adoption of natural gas fol- lowed by a transition to biogas and bio-syngas.”
The major component of biogas is also methane (50–75%). Apart from methane biogas contains mainly carbon dioxide (25–50%), nitrogen, hydrogen and hy- drogen sulphide. After proper treatment biogas can be used as a substitute to natural gas, therefore as an alter- native clean source of automotive fuel in CNG vehicles.
Utilizing organic waste for the production of biogas is a good example of what Gunter Pauli describes as Blue Economy – turning mankind back to the “sensibility of ecosystems”, as opposed to the Red Economy of bor- rowing from nature “with no thought of repaying”, or the Green Economy of making the consumers “to pay more, to achieve the same, or even less, while preserv- ing the environment” (Pauli, 2010).
In many countries this option is already a reality.
Biomethane has been injected into the natural gas grid of the Netherlands and the USA since the 1980s. Ac- cording to a study by Bordelanne et al. (2011) in 2010 there were 110 installations in 18 countries injecting more than 40,000 Nm3/h of biomethane into the grid.
According to the German Energy Agency (2012) by January 2012 only in Europe there were more than 155 operating biogas plants, 120 of which were feeding upgraded biogas into the public natural gas grids (77 of them in Germany). In Germany the first two plants for the upgrade and feed-in of biogas into the natural gas grid were put into operation at the end of 2006 and presently, although in Europe the Netherlands, Sweden and Switzerland have the longest experience in the up- grade and feed-in of biomethane, Germany is strongly leading in feed-in capacity. By the end of 2012, around 133 German plants are expected to be connected to the network with an hourly feed-in capacity of 86,000 cu- bic meters of biomethane. With almost 4,000 installed biogas plants and more than 500 manufacturers with 10,000 employees in the biogas branch, Germany is one of the most sophisticated countries in biogas tech- nology in the EU. We shall also mention that the supply of CNG to the automotive consumers is organized to the extent that with proper route planning it is possible to drive through the whole country on CNG. Germa- ny’s 900th compressed natural gas filling station was officially opened on December 21st, 2011. But as we will see later, the situation with the number of German vehicles using CNG and its growth rate is not as im- pressive as one would expect. Perhaps the example of less advanced economies may offer an explanation for the reasons.
How does it work in different countries?
Advanced examples
A friend in need is a friend indeed, the proverb says, and methane has proved to be a good friend to many Bulgarians. At the end of the 1990s Bulgaria was expe- riencing serious economic difficulties, which resulted in high unemployment, hyperinflation and deteriorat- ing standards of living. Countless companies and small
Reduction of emissions when using CNG
Compared to Gasoline
Compared to Diesel
CO 60-80% 70–90%
NMHC
(non-methane hydrocarbons)
85% 40–60%
NOx 50–80% 80–90%
PM (particulate matter)
– 99%
CO2 20% 25%
Noise na 40%
Table 2 Reduction of emissions when using CNG
Source: Korzec, E. – Szczygiel, I. (2011: p. 283.)
entrepreneurs were actually struggling for survival, desperately cutting spending and searching for ways to reduce their running costs. Replacing traditional gasoline and diesel fuel with Compressed Natural Gas became one of the most successful solutions for many automotive fleets. In 2011 – according to NGVA Eu- rope (2012) – 61,623 vehicles in Bulgaria were driv- ing on natural gas, making it the EU-member state with the third biggest fleet of natural gas vehicles after Italy (761,340) and Germany (94,890). Furthermore, if we take into consideration the size of the country (the pop- ulation of Italy, Germany and Bulgaria as reported at that time was 60.7, 81.6 and 7.1 million, respectively), and the total number of its road vehicles, Bulgaria is the clear leader in the EU by the share of its natural gas vehicles within its all road vehicles, namely 2.25%!
Italy follows with 1.86% and Sweden with 0.76%. The first vehicles running on CNG were introduced in Italy in the mid-1930s, so if we consider that the Italian mar- ket has had an advantage over Bulgaria of more than 60 years, for Bulgaria this is a serious achievement. At the same time in world-wide perspective these share figures look really modest as compared to Pakistan and Bangladesh, where the share of natural gas vehi- cles within all road vehicles in 2010 was 81.52% and 61.33%, respectively. Armenia is next with 30.17%
(2008 data). An observation by Collantes et al. (2011) may give an explanation, why the percentage of natural gas vehicles within the total number of road vehicles is so low even in Italy in contrast with the well devel- oped local infrastructure and the matured technology of the CNG applications: “The choice between fuels with different qualities is affected not only by the rela- tive price of the fuels but also by the disposable income of consumers”. Here the authors suggest that the cost saving must be really attractive in order to prompt the transition. According to their study, CNG became ap- pealing to Argentinian consumers when its price fell to 40 or 30 percent of the price of gasoline. It is still to be examined, what price advantage of CNG would be relevant for other countries, where other quantifiable factors beside the relative price of the fuels may play a significant role. These factors could be for example GDP/capita, the general cost of living, the tax content of the fuel prices, the administrative costs of motoring and of refitting of vehicles to CNG, etc.
Another factor, which shall definitely be examined, is the general attitude to environmental issues versus personal pragmatism. Apparently, as long as the user can afford the cost of traditional fuels, he prefers to pay it and not to bother with new technology. In regards to the transition to CNG fuel the majority of the con-
sumers with higher income would enjoy the conveni- ence of the conservative approach and would avoid the hassle of the unknown technology and the “still to be proved” saving. This is the case, when consumers in wealthier markets (e.g. Germany) with a strong pro- environmental attitude fail to utilize the opportunities, which they themselves have created. Similarly to the phenomenon described by Mária Csutora (2011), when an environmentally-conscious consumer may have a larger carbon footprint than a less environmentally- conscious consumer with a lower income. In relation to the image-conscious private owners there is also the negative impact of the perceived shameful social stigma – that of the cost-sensitive owner, adapting his vehicle to CNG to save money. At the same time, some of those, for whom the saving reason prevails, may not have the individual means for the relatively expensive conversion to CNG. Unless the traditional fuel prices soar and there is no other choice left. On a world-wide scale Gunter Pauli (2010) called the current economic upheaval a blessing in disguise that, perhaps, may stop the unrealistic consumerism. I dare say that if it weren’t for the economic trouble in Bulgaria, most probably the introduction of CNG as automotive fuel would have never happened there on the current scale. Simi- lar observation is expressed by Collantes et al. (2011) in regard to Argentina, where they say that, “Some of our interviewees described CNG as a ‘fuel of crisis’, meaning that CNG becomes a more appealing fuel al- ternative at times when the economy is less strong and consumer income declines.”
Still, despite the economic “survival incentive”, the introduction of natural gas as automotive fuel in Bul- garia did not come easily. Many had been aware of the significant advantages of the CNG as compared to the traditional gasoline and diesel fuel, but that had not been enough. A good illustration is the case presented by Dr Emilian Stankov, expert in internal combustion engine systems and alternative fuels at Ruse Univer- sity in Bulgaria. At the end of the XXth century af- ter a series of studies and experiments with extremely encouraging results a group of scholars at the Faculty of Transportation of Ruse University developed their own technological process and successfully adapted test vehicles to using CNG. The efficiency improve- ment and the resulting reduction in motoring costs was sensational, and the team even launched a local program for manufacturing and fitting the necessary equipment, but faced the obstacle of a non-existing in- frastructure. The public interest was high, but the real demand for the technology was restricted by the lack of CNG fuel stations. A CNG filling station built in the
city of Pleven at that time easily proved that building of CNG fuel stations was economically suicidal due to the insignificant number of adapted vehicles available. The spell of the vicious circle was finally broken in the year 2000 by parallel offensive – equipment was commis- sioned for adapting selected fleets of public transport (city buses and taxis) simultaneously with the erection of local filling stations. This case actually supports the observation by Thamsiriroj et al. (2007): “An excellent first step is a captive fleet; this is typically associated with a bus service, municipal vehicles and/or a taxi fleet.” As soon as the filling stations built for the first fleets became operational in Bulgaria, local small busi- nesses and private individuals attracted by the pros- pect of cheaper motoring immediately embraced the new trend. Within one month after opening of the first CNG station the number of CNG vehicles reached 100.
Within one year the number of converted cars became 1,000 and continued to grow. The example drew the attention of investors and the number of filling stations grew as well. As of 21st of October 2011 the number of operational CNG filling stations was 102, or approxi- mately one CNG filling station per 700 CNG vehicles.
23 of the filling stations are in the capital Sofia, where the overwhelming majority of taxis drive vehicles with gasoline engine adapted for CNG, completely ignoring once traditional fuels. For comparison, in June 2011 Italy had 887 CNG vehicles per filling station. At the same time Germany only has 105 CNG vehicles per filling station. Which rate should be better? If we want to clarify the optimal CNG-vehicle/refueling-station ratio, the topic is worth investigating. On the one hand, having more filling stations built in the country is better for the motorists, which is positive factor in the spread of CNG vehicles; on the other hand, if the number of CNG vehicles is too small, this will impact the profita- bility of the filling station. Janssen et al. (2006) in their study point out that for countries with a large number of CNG vehicles, including Argentina, Brazil, India, Italy and Pakistan 1,000 vehicles per refueling station would be the optimal balance between profitability for fueling stations and convenience to CNG vehicle owners. The Italian rate is reported to have fallen from that value in 2004 due to direct government subsidies for the erec- tion of CNG fueling stations (Yeh, 2007). Another example is the rate in the USA, where officially there are 92 CNG vehicles per station (see Collantes, 2011), though Yeh (2007) reasonably points out, that the ef- fective rate may be significantly lower because a large portion of the CNG vehicles actually ran on gasoline instead of natural gas. According to her this is due to a large number of such vehicles being sold in response to
the regulations of 1992, which created economic incen- tives for manufacturers to produce alternative fuel ve- hicles and required that bi- or flex-fuel vehicles merely be capable of operating on an alternative fuel. Clearly a warning to policy makers that you can take a horse to the water, but you can’t make it drink.
The successful initial spread of vehicles converted to CNG and the reassuring growth of the filling sta- tions network in Bulgaria developed popular interest and spiralled the additional demand for vehicle con- versions. Selling volumes of conversion kits grew and their prices went down, making the initial investment more affordable and the return on it faster. The accu- mulated personal experience proved the initial assump- tions of the economic benefits, but also confirmed the disadvantages – one of major ones being the loss of space in the trunk of the converted vehicle. Some taxis, determined to stay on CNG, started searching for ways to eliminate the problem, which led to the appearance of the first CNG taxis produced by Original Equip- ment Manufacturers (OEM) with neatly built-in gas tanks and full size trunks. This phenomenon is a kind of reverse confirmation of a conclusion made by Yeh (2007) that the mere existence of OEMs did not seem to be a major factor in determining the success of CNG markets. It was rather the availability and reliability of refitting technology and components that is far more important for consumers’ acceptance of CNG vehicles.
Similar can be said about bus fleets. The emerging fill- ing stations and the acceptance of the idea to drive on CNG generates positive action – within a relatively short period of time municipalities in several cities in Bulgaria introduced new CNG buses. As of June 2009 there were 67 vehicles on CNG in Sofia, 23 in Varna and 12 in Bourgas. In the case of Bourgas, where CNG buses were purchased to replace the diesel fleet, the following results were achieved, as provided by the Bourgas Regional Agency for Energy Management:
monthly saving of EUR 1,250 per bus (serving one line for 25 working days per month on 2 shifts), 2 to 3 times reduction of the CO2 emissions and up to 50-60% re- duction of nitrogen oxide emissions. Despite the appar- ent local success, the Agency warned that one of the most serious obstacles in the way of the introduction of CNG technology is public unawareness of its benefits and the lack of active governmental support. Here the emphasis is not really on finance and investment, but on providing the right attitude.
Research has shown that a proper supporting state policy on CNG is extremely important for the final result, and communication is crucial (Engerer et al.
2010).
Even in a country like Italy – having a serious CNG market – a survey among consumers showed a pro- found lack of information and knowledge about CNG vehicles’ characteristics. For example, although 85%
of the respondents knew that CNG was cheaper than other fuels, 86% of them had little knowledge of the real relative prices, and 33% could not believe CNG was so cheap. Only 25% knew about governmental incentives on natural gas vehicles and 36% believed the CNG vehicles were unsafe. When asked about the sources of information on CNG, ‘friends and relatives’
were mentioned by 74%, while the media accounted for only 16% (Di Pascoli et al., 2001). The above con- firms the need for appropriate communication on be- half of the administration, if they want to encourage the use of CNG, but sometimes the governmental officials themselves have to be educated. A case study high- lighted by MADEGASCAR (“Market development for gas driven cars”, a project funded by the European Commission) points out, that in Somerset in the UK the lack of information was such, that the general attitude to CNG vehicles was negative, and even governmental officials had “no knowledge about biomethane or CNG vehicles” (Moore, 2010).
The case of Argentina is a good example how to successfully introduce CNG as a transportation fuel with minimum investment from the state. In the 1980s the government established a clear set of safety stand- ards and consistently showed its commitment and sup- port by adopting a policy of pricing, which sustained the CNG market. The only direct investment of the state into the CNG infrastructure was the building of three stations in busy locations in order to demonstrate that the new alternative fuel was safe for the public and encouraging its acceptance. Once these steps were tak- en, the government let the market take over the process of CNG infrastructure development. Simultaneously with these first three stations the government initiated a conversion of 300 vehicles from the fleet of the state company Gas del Estado and supported the conversion of 350 taxis in the City of Buenos Aires. The CNG equipment was actually sold to the taxis through credit lines so that the owners could repay as they were sav- ing from use of CNG instead of gasoline (Collantes, 2011).
The public shall be constantly and properly edu- cated about the CNG and the related policy of the gov- ernment. Clear governmental stance and consistent communication shall be an important signal to inves- tors and motorists alike. New Zealand is a positive and a negative example at the same time. After reaching very good results through successful governmental in-
centives, when in 1985 more than 10% of the vehicles in the country were driving on CNG, the government changed course. As the favourable CNG loan condi- tions were withdrawn, the CNG market faded away.
“Hungaricum status est”
In Hungary the situation with the CNG market is close- ly resembling the one in Bulgaria at the beginning of this century – the economic downturn and soaring gas- oline and especially diesel prices have made motoring almost a luxury and have brought local public transport companies to the brink of ruin. Because of that, it seems that Hungary may be on the threshold of a similar pos- sible breakthrough. Reducing their running costs is a matter of life and death for the municipalities. Actually, if we keep in mind the superiority of the CNG in com- parison to the conventional fuels from ecological point of view, then the economic crisis may become a purga- tory for the Hungarian public transport. It may become greener due to simple market-based considerations – just “naturally”. The opportunity seems to be sensed by the Hungarian government as well, based on the text of the recent Governmental Decision 1330 (Magyar Kö- zlöny, 2011). The above document explicitly states that regarding the CNG the government shall promote it as vehicle fuel in public services, and appoints the minis- ters of three ministries as responsible for the launching of the project – those of Transportation, of Ecology and of Economic policy. Besides, it also preserves the pre- sent 0% excise tax on CNG.
Another manifestation of pro-CNG support was the opening of the first CNG filling station in Budapest by Gas Works Company (FŐGÁZ Zrt.), making it the third public CNG station in Hungary.
But quite in the same way as in other markets em- barking on this path the infrastructure is hampering the new approach.
CNG roadmap for Hungary – the real-life case What shall a fleet-manager of a Hungarian company expect, if he decides to convert his/her gasoline fleet to CNG fuel?
Let us first consider the following example, based on a three-years old Ford Focus Wagon with gasoline engine of 1,596 cm³, 74 kW, 101 HP and average con- sumption of 9 L per 100 km (Table 3a).
Expected conversion cost of one car in accordance with a documented business offer (available on file) is HUF 420,000. (For reference, EUR 1 = HUF 297.39 as per Magyar Nemzeti Bank quote of April 13, 2012.)
This includes a 4-cylinder SEQUENT Plug&Drive BRC conversion kit, “VB S1“ with safety valves, all pipes and tubing, tank mounting, 83-liter FABER LIGHT CILBRAS tank (14.8 kg of CNG), NGV1 Noz- zle and all installation work.
After the conversion the approximate CNG con- sumption is expected to be 5.143 kg per 100 km (based on the empirical data-base of a market-leading Bulgar- ian company specialized in distribution and mainte- nance of automobile CNG fuel installations and meth- ane cylinders), giving the car a range of approximately 280 km on CNG. In addition, if necessary, the car can be driven on gasoline as before.
If we presume that the driving pattern shall stay the same, then the expected saving depends on the differ- ence between the cost of gasoline and the cost of CNG, as well as on the difference in consumption.
There are three public CNG fuel stations in Hungary – one in Győr, one in Szeged and one in Budapest, that is why I shall investigate them separately and, keeping in mind the significant price difference between them, shall calculate three different cases for the cost of CNG.
Similarly, when fixing the cost of gasoline for each of the cases, I shall apply the best quote among the pub- lic fuel stations in the respective city.
If we take the average annual mileage per one ve- hicle as 35,000 km, this will make the annual cost of gasoline fuel in Budapest HUF 1,426,635 per car. In Győr and Szeged the same parameter will be HUF 1,429,785 and HUF 1,407,735, respectively. Presuming that for the following year the average mileage remains the same, and that the prices of gasoline and CNG in the model are constant, we can see the following result: on the basis of the monthly saving achieved due to the low-
Cars (units) 1
Annual mileage (km) 35,000
Average fuel consumption:
gasoline (L/100 km) 9
Average fuel consumption:
CNG (kg/100 km) 5.143
Conversion cost of one car
(based on individual offer) 420,000 Ft
Budapest Győr Szeged
Annual gasoline cost of one car 1,426,635 Ft 1,429,785 Ft 1,407,735 Ft
Annual CNG cost of one car 610,200 Ft 449,820 Ft 397,620 Ft
Monthly fuel cost saving 68,036 81,664 84,176
First year cost (conversion costs-SAVING) –396,435 Ft –559,965 Ft –590,115 Ft
Months till break-even 6.2 5.1 5.0
Budapest Győr Szeged
Cost of gasoline (HUF/L) 453 Ft 454 Ft 447 Ft
Cost of CNG (HUF/kg) 339 Ft 250 Ft 221 Ft
Cost of CNG / Cost of gasoline 75% 55% 49%
Table 3a Conversion example for one vehicle with annual mileage
of 35,000 km
City Cost of gasoline provided by Cost of CNG provided by
Budapest MOL
Budapest, X. ker. Kőbányai út 55.
MOL
Budapest, X. ker. Kőbányai út 55.
Győr MOL
Győr, Galántai út
GDF Suez CNG töltőállomás Győr, Puskás T. u. 39.
Szeged MOL
Szeged, Kálvária sugárút 96.
GDF Suez CNG töltőállomás Szeged, Pulcz u. 44.
Information for all fuel prices obtained on April 13, 2012. Source: www.holtankoljak.hu Calculation by Tkatchenko R.
er fuel cost, in Győr and Szeged the conversion to CNG for one vehicle shall be justified within 5 months! Due to the higher CNG prices in the capital city of Budapest this period shall take approximately one month longer.
Apparently, for larger fleets it would be imperative to secure appropriate fueling opportunities simultane- ously with the conversion of the vehicle park to CNG.
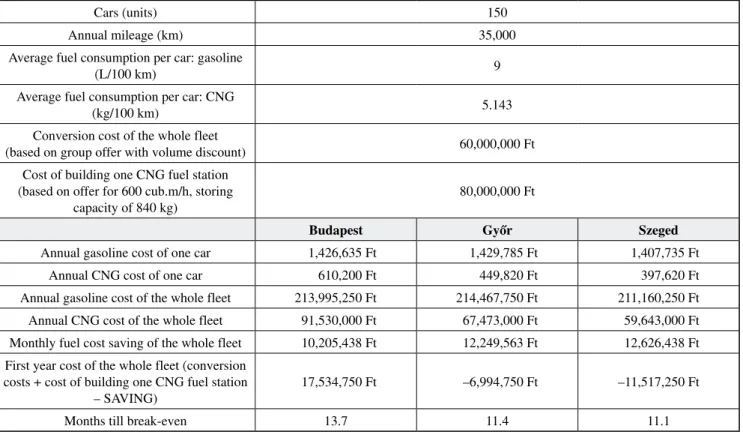
Table 3b shows, what would happen in the three cit- ies in case of converting fleets of 150 vehicles, and at the same time investing into an additional CNG fueling station.
When calculating the conversion cost of the vehi- cles I included a 5% cost reduction for the large order.
As a result, in Győr and Szeged the investment is re- turned within one year, while the Budapest fleet owner shall need 14 months.
This simplified model depends on several assump- tions, which we shall examine in more detail:
1. Fixed gasoline prices. Obviously, nobody will ex- pect them to stay constant; on the contrary, we can presume they will grow further, making our case even stronger and the conversion economically more desirable.
2. Fixed CNG prices. For those, who convert their fleets to natural gas, it is important to know if the Hungarian government will really keep its stance of preserving the 0% excise tax of CNG. Nevertheless, even if, for any desperate budget reason, it reneges on its recent promises, this may only slightly delay our above mentioned break-even point. For exam-
ple, the price of CNG in Budapest is 53% higher than that in Szeged; notwithstanding, converting to CNG in Budapest still makes economic sense.
3. The price of CNG in Budapest is significantly higher than in Győr and Szeged. In case of positive market reaction, when new CNG stations may be built, the CNG prices in Budapest are expected to go down, making the conversion to CNG even more attractive for local motorists.
4. No administrative incentives have been taken into consideration in the above calculations. Knowing the environmental benefits of the CNG solution, we shall not rule out additional support by the govern- ment, which can only strengthen our case.
5. When examining the conversion of the whole fleet together with building its own CNG fuel station, we Table 3b Conversion example for a fleet of vehicles with its own
CNG fuel station
Information for all fuel prices obtained on April 13, 2012. Source: www.holtankoljak.hu Calculation by Tkatchenko R.
Cars (units) 150
Annual mileage (km) 35,000
Average fuel consumption per car: gasoline
(L/100 km) 9
Average fuel consumption per car: CNG
(kg/100 km) 5.143
Conversion cost of the whole fleet
(based on group offer with volume discount) 60,000,000 Ft
Cost of building one CNG fuel station (based on offer for 600 cub.m/h, storing
capacity of 840 kg)
80,000,000 Ft
Budapest Győr Szeged
Annual gasoline cost of one car 1,426,635 Ft 1,429,785 Ft 1,407,735 Ft
Annual CNG cost of one car 610,200 Ft 449,820 Ft 397,620 Ft
Annual gasoline cost of the whole fleet 213,995,250 Ft 214,467,750 Ft 211,160,250 Ft Annual CNG cost of the whole fleet 91,530,000 Ft 67,473,000 Ft 59,643,000 Ft Monthly fuel cost saving of the whole fleet 10,205,438 Ft 12,249,563 Ft 12,626,438 Ft First year cost of the whole fleet (conversion
costs + cost of building one CNG fuel station – SAVING)
17,534,750 Ft –6,994,750 Ft –11,517,250 Ft
Months till break-even 13.7 11.4 11.1
did not include neither the profit made by our CNG fuel station from serving the fleet, nor possible ex- tra revenues from external customers using our new CNG fuel station.
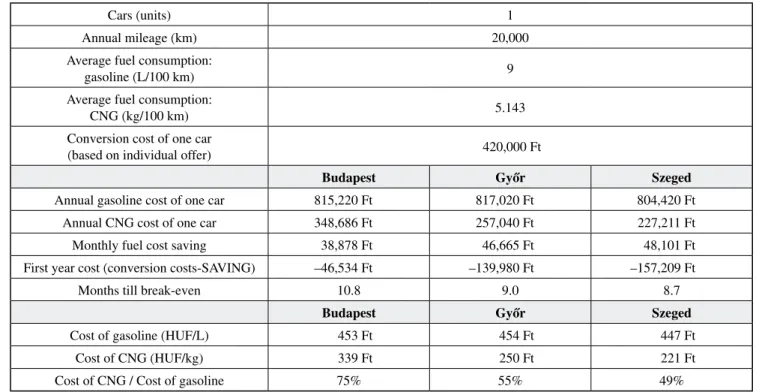
6. The annual mileage per one vehicle was set as 35,000 km. The empirical data was obtained from a real fleet of vehicles. Naturally, in case of lower mileage
the break-even point shall be achieved later. For ex- ample, if all other parameters shall stay unchanged, a converted car with 20,000 km annual mileage can reach its break-even point approximately within 11 months in Budapest, and about 2 months earlier in Győr and Szeged (see Table 3c).
Keeping in mind the same assumptions as above, and based on the modest calculation of annual 20,000 km as shown in Table 3c, one vehicle turned to methane can substitute 1,800 l of gasoline per year with CNG.
1,000 CNG vehicles (the number reached within 1 year in Bulgaria – see page 4 above) will result in 1,800,000 liters substituted by CNG after the first year.
A Hungarian CNG scenario similar to the Bulgarian example allows to expect at least 50,000 CNG vehicles within a decade with 90 million liters of gasoline sub- stituted per year with a cleaner fuel. 90,000,000 liters non-burned gasoline.
Summary
The purpose of this article is to stress that methane as automotive fuel is a better solution than the traditional fuels like gasoline and diesel. Methane is cheaper and en- vironmentally friendly – both in cleanness of burning and renewability. The technology is available and matured.
The obstacles to its introduction on a wider scale in Hungary are as follows:
1. Public unawareness of its benefits – common igno- rance and false beliefs (ironically, the author of this article was told on several occasions not to waste his time on raising the CNG issue in Hungary, because among other reasons “these vehicles are not allowed to underground garages” and “the government has just announced plans to raise the excise tax for this fuel” – both of the above statements are related to LPG and have nothing to do with CNG).
2. Lack of active governmental support.
3. Potential investors and the general mass of motor- ists distrust the government – change of policy is perfectly possible, increasing the ROI risk.
4. Personal pragmatism – as long as the user can afford the cost of traditional fuels, he prefers to pay it and not to bother with new technology.
Cars (units) 1
Annual mileage (km) 20,000
Average fuel consumption:
gasoline (L/100 km) 9
Average fuel consumption:
CNG (kg/100 km) 5.143
Conversion cost of one car
(based on individual offer) 420,000 Ft
Budapest Győr Szeged
Annual gasoline cost of one car 815,220 Ft 817,020 Ft 804,420 Ft
Annual CNG cost of one car 348,686 Ft 257,040 Ft 227,211 Ft
Monthly fuel cost saving 38,878 Ft 46,665 Ft 48,101 Ft
First year cost (conversion costs-SAVING) –46,534 Ft –139,980 Ft –157,209 Ft
Months till break-even 10.8 9.0 8.7
Budapest Győr Szeged
Cost of gasoline (HUF/L) 453 Ft 454 Ft 447 Ft
Cost of CNG (HUF/kg) 339 Ft 250 Ft 221 Ft
Cost of CNG / Cost of gasoline 75% 55% 49%
Table 3c Conversion example for one vehicle with annual mileage
of 20,000 km
Information for all fuel prices obtained on April 13, 2012. Source: www.holtankoljak.hu Calculation by Tkatchenko R.
Suggested steps
1. The governmental officials themselves have to be educated about CNG and its benefits
a) for the environment (less emissions),
b) for the national economy (a good CNG filling station network will reduce transportation costs and improve national competitiveness; creating demand for biogas and its local sustainable pro- duction and utilisation will bring new jobs and decrease oil imports).
2. The public shall be constantly and properly edu- cated about CNG and the related policy of the gov- ernment. The Hungarian state shall clearly specify that its stance of preserving the 0% excise tax of CNG is not a possibility, but a long-term reality. The current majority rule makes it fully feasible. Clear governmental statement and consistent communica- tion shall be an important signal to investors and motorists alike. Here the emphasis is not on finance and investment, but on providing the right attitude.
3. Financial support for introducing environmentally friendly and energy efficient state of the art CNG technology (e.g. favourable CNG loan conditions or other incentives)
The examples provided are only about converting gasoline vehicles to CNG. The objective was to illus- trate the feasibility of the process and the significant economic gain it brings to the vehicle owners.
With proper attitude on behalf of the national policy makers Hungary can achieve significant results in im- proving its competitiveness, reviving the economy and preserving the environment at the same time.
References
Bordelanne, O. – Montero, M. – Bravin, F. – Prieur-Vernat, A. – Oliveti-Selmi, O. – Pierre, H. – Papadopoulo, M. – Muller, T. (2011): Biomethane CNG hybrid: A reduction by more than 80% of the greenhouse gases emissions compared to gasoline. Journal of Natural Gas Science and Engineering, 3: p. 617–624.
Collantes, G. – Melaina, M. W. (2011): The co-evolution of alternative fuel infrastructure and vehicles: A study of the experience of Argentina with compressed natural gas. Energy Policy, 39: p. 664–675.
Csutora M. (2011): A látványos akcióktól a hatásos cselekvésig. A fenntartható fogyasztás környezeti dimenziói – tanulmánykötet. Budapest: p. 71–88.
Di Pascoli, S. – Femia, A. – Luzzati, T. (2001): Natural gas, cars and the environment. A (relatively) ‘clean’ and
cheap fuel looking for users. Ecological Economics, 38:
p. 179–189.
Engerer, H. – Horn, M. (2010): Natural gas vehicles: An option for Europe. Energy Policy, 38: p. 1017–1029.
GAZPROM Germania GmbH, www.gazprom-germania.de – assessed on 15.02.2012.
German Energy Agency – Deutsche Energie-Agentur GmbH (dena) – http://www.biogaspartner.de/ accessed on 22.02.2012.
International Energy Agency (2010): International Energy Agency. Executive Study OECD/IEA, Ivanova M., Making a successful development even more successful – NGVs in the Black Sea region, Bulgaria; 4 February (available on file)
Janssen, A. – Lienin, S. – Gassmann, F. – Wokaun, A. (2006):
Model aided policy development for the market penetration of natural gas vehicles in Switzerland.
Transportation Research, Part A–Policy and Practice 40: p. 316–333.
Korzec, E. – Szczygiel, I. (2011): Technical and Economic Aspects of Treatment of Compressed Natural Gas to Vehicle Supply. Journal of KONES Powertrain and Transport, Vol. 18, No. 1: p. 281–286.
MAGYAR KÖZLÖNY, 2011/117, 1330/2011. (X. 12.) Korm.
Határozat
Moore, S. (2010): Creating an infrastructure for gas vehicles – how to take the first steps. Examples from Slovenia, Lithuania, and UK; 4 February, Madegascar Final Conference, Prague
NGVA Europe (2012): Fact Sheet: NG/biomethane used as vehicle fuel, www.ngvaeurope.eu/statistical- information-on-the-european-and-worldwide-ngv- status, accessed on 22.02.2012, available on file Pauli, G. (2010): The Blue Economy: 10 Years, 100
Innovations, 100 Million Jobs. Report to the Club of Rome. Paradigm Publications
Thamsiriroj, T. – Smyth, T.H. – Murphy, J.D. (2011): A road- map for the introduction of gaseous transport fuel: A case study for renewable natural gas in Ireland. Renewable and Sustainable Energy Reviews, 15: p. 4642–4651.
Yeh, S. (2007): An empirical analysis on the adoption of alternative fuel vehicles: The case of natural gas vehicles. Energy Policy, 35: p. 5865–5875.
Personal interviews:
Dr. Emilian Stankov, expert in internal combustion engine systems and alternative fuels, Ruse University in Bulgaria; February, 2012.
Lubo Ganev, manager, “REMIX BULGARIA” LTD, February-March, 2012.
Article provided: 2012. 5 Article accepted: 2012. 8.


![theothervehiclesarealsoinmotion,thehandlingofintersectionscenariosisacomplex inthearchitectureofthecontrolsystemitcanbehandledasaspecialfeatureofapath , ].Nevertheless,consideringpositionerrorscausedbyhumanparticipants,robustcontrol ]andGPSandstereovision](data:image/gif;base64,R0lGODlhAQABAIAAAP///wAAACH5BAEAAAAALAAAAAABAAEAAAICRAEAOw==)