Mapping out Vulnerable Sectors in the
Eastern Partnership Countries
STRUCTURAL CHANGE, VISEGRAD EXPERIENCE AND RELEVANCE FOR EU POLICY
Edited by
ANDRÁS DEÁK
BUDAPEST, 2016
RELEVANCE FOREU POLICY", SPONSORED BY THEINTERNATIONALVISEGRADFUND.
PROJECT PARTNERS
ISBN 978-963-301-632-9
© Institute of World Economics, Budapest 2016 Cover design: Gábor Túry
Cover photo: “Wise Men Were All Fools” by Ryan Summers Print layout: Stég Kft.
Publisher:
Institute of World Economics,
Research Centre for Economic and Regional Studies of the Hungarian Academy of Sciences H-1112 Budapest, Budaörsi u. 45.
e-mail: vki@krtk.mta.hu
In the middle of 2014, when we launched this project, it became obvious, that the period of relative prosperity and growth of the 2000s at the Eastern border of the EU came to an end.
Economic slowdown in the post-Soviet space, currency crises in Ukraine and Belarus, emerging problems in Moldova signaled, that macro-stability stands on weak fundaments and showed the vulnerability of local economies. Coupled with the fall of the Yanukovich-regime and the conflict in Eastern Ukraine, 2014 very much looked like a historical turning point and the beginning of a new era. The future was misty with only a few points of certainty. It was clear, that Western institutions will have to engage the region more actively, the Russian economy will not be able to maintain its tractional capacity any more and some domestic reforms turn from an option into a must in Belarus, Moldova and Ukraine. Nonetheless, due to the deterioration of the external environment and domestic situations, these processes seemed to be increasingly painful, with uncertain results.
In this Report we analyzed two sectors, namely the machine and energy industries in Belarus, Moldova and Ukraine, that have particular importance in this new era. Due to their sheer size in the local GDPs, labor markets and foreign accounts, Russia's overrepresentation in the sectoral matters, the local governments will have to address the problems of these two branches in a more dedicated way. In one way or another, but some sort of solution to these sectoral problems has to be found in the years to come. Mismanagement may constitute a major impediment to local reforms, while successful responses can ease the process remarkably and improve the domestic business climate significantly. The same is true for the Western assistance and EU policies: even if Western governments usually do not address sectoral issues and focus on the foreign and macroeconomic landscape, in these particular cases problems may easily overspill the regional borders. While a common understanding regarding the necessity of experience transfer has been emerging in the field of energy, machine-building industries are still largely ignored by the Western donors.
The three Reports published in this book hopefully provide an insight into regional sectoral trends and outline some basic understanding of potential cooperation between Western and local industries, governments. I would like to express my gratitude to my colleagues from the partner institutions, to Sierz Naurodski (CASE-Belarus), Ion Muntean (IDIS Viitorul, Moldova), Malgorzata Jakubiak (CASE, Poland), Vladimir Benc (SFPA RC, Slovakia) and Vitaliy Kravchuk and Mykola Ryzhenkov (IER, Ukraine) for authoring the respective Reports and to many others, who enriched them with their observations. I am also indebted to the International Visegrad Fund (main sponsor), the Royal Dutch Government and the Hungarian Academy of Sciences, who supported the project financially. Furthermore, I am very thankful to my colleagues who helped me in organizing the related presentations, events and conferences, in particular Ágnes Szunomár (HAS CERS IWE, Hungary) and Iryna Kosse (IER, Ukraine).
András Deák
Macroeconomic Report
September 2015
Authors:
Vitaliy Kravchuk Malgorzata McKenzie
Mykola Ryzhenkov
Commentators:
Vladimir Benc Andras Deak Veaceslav Ionita Sierz Naurodski
Table of Contents
List of tables and figures . . . .9
List of abbreviations . . . .10
Introduction . . . .11
Post-2000 recovery and its sources – View from the demand side . . . .11
The evolution of production in Belarus, Moldova and Ukraine . . . .13
Labor market . . . .16
Public finances and fiscal policies . . . .18
Budget revenues . . . .18
Extra-budgetary funds . . . .19
Subsidies . . . .19
Budget expenditures . . . .20
Budget balances and dependence on external financing . . . .21
International trade and investments . . . .22
Balance of payments . . . .22
Trade in goods . . . .24
Access to markets . . . .37
Foreign direct investments . . . .38
Monetary and exchange rate policies . . . .42
Economic outlook . . . .43
Recommendations for institutional reforms . . . .44
References . . . .46
Statistical Appendix . . . .47
List of tables and figures
As they appear in text:
Tables:
Table 1. GDP composition, by sector of origin, 2014 est.
Table 2. Labor statistics of Belarus, Moldova and Ukraine, 2013-2014 Table 3. Education of the labor force in Belarus and Moldova, 2000-2009 Table 4. Labor productivity: GDP per person employed, 2009-2012 Table 5. General government budget in Belarus, 2005-2014
Table 6. General government budget in Moldova, 2005-2014 Table 7. General government budget in Ukraine, 2005-2014
Table 8. Sectoral distribution and diversification of Ukraine's exports of goods in 2013 Table 9. Sectoral diversification of Ukraine's imports of goods in 2013
Table 10. Sectoral diversification of Belarus' exports of goods in 2013 Table 11. Sectoral diversification of Belarus' imports of goods in 2013 Table 12. Sectoral diversification of Moldova's exports of goods, 2009-2013 Table 13. Sectoral diversification of Moldova's imports of goods, 2009-2013 Figures:
Figure 1. GDP evolution in Belarus, Moldova, Russia and Ukraine, 1992-2014
Figure 2.Volume of industrial production in Belarus, Moldova and Ukraine, by main economic activities, 2005-2013
Figure 3. Structure of industrial production in Ukraine, Belarus and Moldova by types of economic activity, 2013-2014
Figure 4. Ukraine's Balance of Payments, 1998-2014, USD bn Figure 5. Belarus' Balance of Payments, 1998-2014, USD bn Figure 6. Moldova's Balance of Payments, 1998-2014, USD m Figure 8. Ukraine's merchandise trade in 1998-2014, USD bn
Figure 9. Ukraine's merchandise exports structure (HS classification), 1998-2014 Figure 10. Ukraine's merchandise imports structure (HS classification), 1998-2014 Figure 11. Ukraine's trade by country groups, 1998-2014
Figure 12. Belarus' merchandise trade in 1998-2014, USD bn
Figure 13. Belarus' merchandise exports structure (HS classification), 1998-2013 Figure 14. Belarus' merchandise imports structure (HS classification), 1998-2013 Figure 15. Belarus trade by country groups, 1998-2014
Figure 16. Moldova's merchandise trade, 1998-2014, USD bn
Figure 17. Moldova's merchandise exports structure (HS classification), 1998-2014 Figure 18. Moldova's merchandise imports structure (HS classification), 1998-2014 Figure 19. Moldova foreign trade by country groups, 1998-2014
Figure 20. Inward FDI to Ukraine, 1998-2014, USD bn Figure 21. Outward FDI from Ukraine, 1998-2014, USD bn Figure 22. Inward FDI to Belarus, 1998-2014, USD bn Figure 23. Outward FDI from Belarus, 1998-2014, USD bn Figure 24. Inward FDI to Moldova, 1998-2014, USD bn Figure 25. Outward FDI from Moldova, 1998-2014, USD m
List of Abbreviations
BNM - National Bank of Moldova BoP - Balance of Payments CD - Certificate of Deposit
CIS - Commonwealth of Independent States
DCFTA - Deep and Comprehensive Free Trade Agreement EBRD - European Bank of Reconstruction and Development EFTA - European Free Trade Association
EP - Eastern Partnership
FDI - Foreign Direct Investment FTA - Free Trade Agreement IMF - International Monetary Fund MFN - Most Favoured Nation
NBRB - National Bank of the Republic of Belarus NBU - National Bank of Ukraine
UNCTAD - United Nations Conference on Trade and Development VAT - Value Added Tax
V4 - Visegrad Four: Czech Republic, Hungary, Poland, Slovakia WTO - World Trade Organization
Introduction
The aim of this Report is to provide a macroeconomic setting for future structural reports. It also provides ato olkit for the sectoral reports in the sense that it offers a set of macroeconomic points of reference.
Whenever possible, we try to identify the vulnerable sectors themselves. By vulnerable sectors we mean sectors with the following attributes: (1) significant input into GDP, (2) high or almost exclusive dependence on domestic/CIS markets, and high level of integration into post-Soviet value chains, (3) declining competitiveness. The reason for this is dictated by the wider aims of the whole project, which are, among others, to raise public awareness of the actual problems faced by these declining sectors and to provide a detailed account of how the management of these sectors may affect social sustainability in the modernization of the respective EP countries.
Notwithstanding the focus on the designated economic sectors, the report covers the usual aspects of macroeconomic policies. It starts with a discussion of the economic development of Belarus, Moldova and Ukraine since the early 2000s, expounding on how demand has contributed to growth (or decline). This is followed by an analysis of production trends, which singles out some of the vulnerable sectors. Public finances and labor markets are discussed next. As the next step, we perform a detailed analysis of trade in merchandise and balance of payments. Monetary and exchange rate policies are reviewed next. We also formulate projections for the near future and conclude with policy recommendations.
Although the report often looks back to the early 2000s or even earlier, we focus mostly on the period after 2009. The countries in focus were hit hard during the 2008-2009 financial crisis, which exposed the previously hidden problems of their vulnerable economic sectors. Thus the crisis provides a natural starting point for the analysis. We try to show how the EU Eastern partners dealt with the post-crisis challenges. While doing this, we also try to assess how macroeconomic imbalances can be managed and what their implications are for economic policies.
As of this writing, Ukraine is plunging into a period of deep macroeconomic instability, creating a situation that adversely affects Belarus and Moldova as well.1 To even contemplate economic recovery in the region, ending the territorial dispute between Russian and Ukraine is the first essential step. However, we must set aside this political issue to focus on identifying the necessary steps in the sphere of economic policy.
Post-2000 recovery and its sources – View from the demand side
Following the collapse of the Soviet Union, the Eastern EU partners plunged into an almost decade-long stagnation. The early 2000s brought recovery, which was largely fuelled by the mix of favorable external conditions and the economic rise of Russia (this, in turn, resulted from a combination of rising commodity prices and economic reforms). Through trade and capital ties, as well as on account of sharing the same ‘Soviet industrial heritage,’ all three EP countries that
1Through trade, investment and financial links.
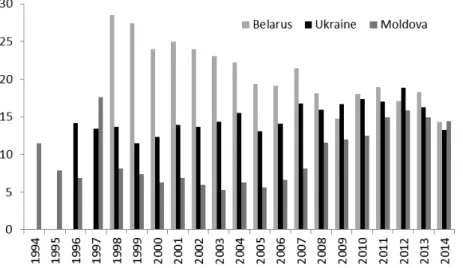
our analysis focuses on depend to a significant extent on Russia. This relationship is reflected in the evolution of their GDP figures (see Figure 1).
Figure 1.GDP evolution in Belarus, Moldova, Russia and Ukraine, 1992-2014
Source:own calculations on the basis of IMF WEO database, October 2014 note:real GDP index with 1994 = 100; * – estimate
The global financial crisis of 2008-2009 resulted in a temporary downfall or stagnation (Belarus) of production. Declining global trade volumes and lower commodity prices, combined with sudden capital outflows, put national currencies under pressure. During this time, the Ukrainian and Belarusian currencies depreciated markedly. Substantial levels of exposure to external financing, coupled with rising costs in said financing, exerted pressure on fiscal policies. All this was reflected in the steep drops in 2009 of the GDPs of Russia, Moldova and Ukraine. The crisis also exposed the vulnerabilities of the Ukrainian and Moldovan banking sectors. Domestic policy responses were largely of a one-off nature and failed to address the underlying structural problems.2 However, Russia, Belarus and Moldova continued to grow afterwards until the year 2014.
Post-2009 growth in Belarus has been fuelled by consumption and investment, while the country’s trade balance has exerted negative pressure on growth throughout most of the last few years. As both consumption and investment were subsidized throughout the period, it is hard to perceive them as stable pillars of growth in the very near term.
In Moldova, these have been consumption and investment as well, in this case fuelled by remittances from abroad. Taking into account that the majority of Moldovan labor migrants seek work in Russia and Ukraine (Cantarji and Mincu, 2013), in the near term the present deterioration of the economic situation there creates a downward pressure on Moldovan growth as well.
Ukraine has practically stagnated since the 2008-2009 financial crisis. Its GDP took a deep dive in 2009, then rebounded a bit in the following two years and stopped growing afterwards. Its exports, consisting in large part of metals and metal products, have been hampered, its wages and costs have been rising without matching improvements in productivity. There were no reforms addressing structural problems. Thus, the vulnerabilities of the shrinking, energy-intensive economy, which was dependant on gas imports from Russia, were increasingly exposed.
2With Moldova being an exception in some respects, like improvement in entrepreneurial regulations.
The evolution of production in Belarus, Moldova and Ukraine
Even though the three EP countries managed to significantly expand their service sectors after the fall of the Soviet Union, the high share of agricultural production in the overall value added puts them at a striking difference as compared to the EU countries. In the Visegrad states, agriculture accounts for around 3% of GDP, while in a country like France its contribution is below 2%.
Currently, the agricultural sectors of Ukraine, Belarus and Moldova account for 7 to 15% of their respective GDPs, which cannot be explained by comparative advantage alone. The contribution of industry to their GDPs seems rather low.
Table 1.GDP composition, by sector of origin, 2014 est.
Source:CIA World Factbook
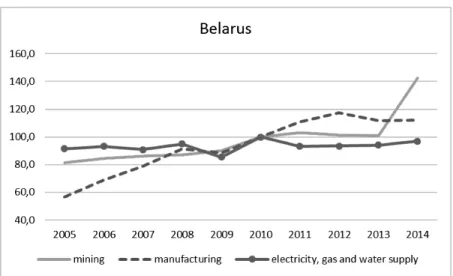
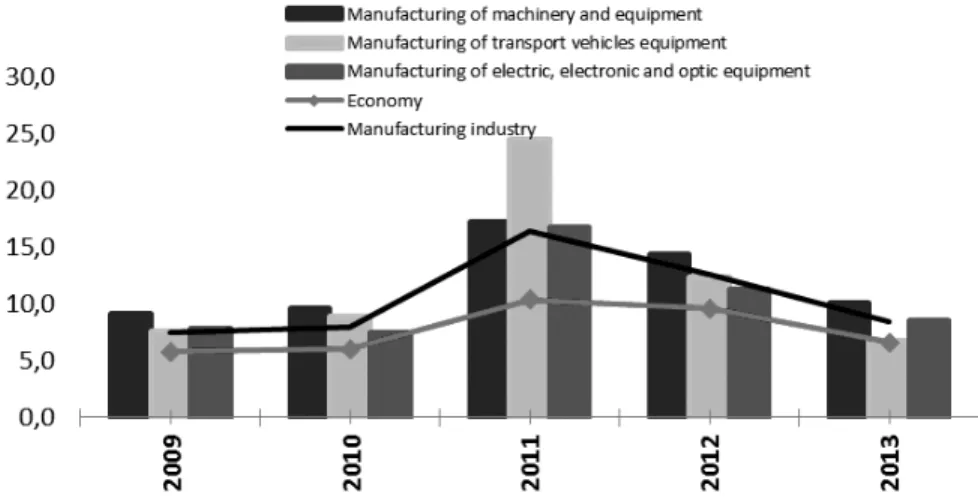
Leaving aside agriculture and services and looking at industrial production only, we observe fairly different trends over time. It is apparent that since 2009, manufacturing volumes have to some extent been growing in Belarus, while over the same period the corresponding numbers rebounded to pre-2009 levels in Moldova and production shrunk in Ukraine (see Figure 2). Among the three EP countries, Ukraine’s industry was the hardest hit after the financial crisis. Its manufacturing production spiked for a single year only (2011) and plunged afterwards. In the light of the recent military conflict and the disruption of economic activity, the country’s short-term prospects remain gloomy.
Figure 2.Volume of industrial production in Belarus, Moldova and Ukraine, by main economic activities, 2005-2013
Ukraine Belarus Moldova
Agriculture 12.1% 7.3% 15.7%
Industry 29% 37% 20%
Services 58.8% 55.7% 64%
Source:own calculations on the basis of data from the national statistical offices of the respective countries
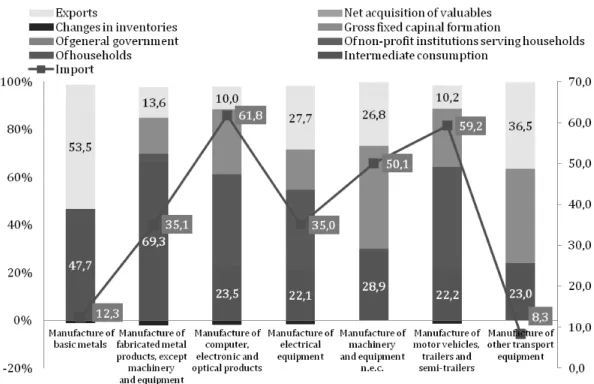
Looking at the relative importance of various industrial branches, we see a fair amount of differences.
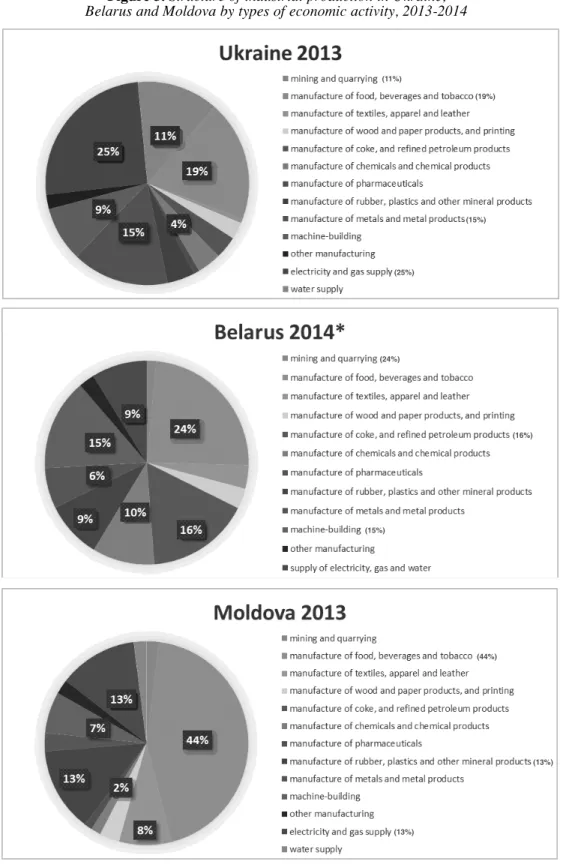
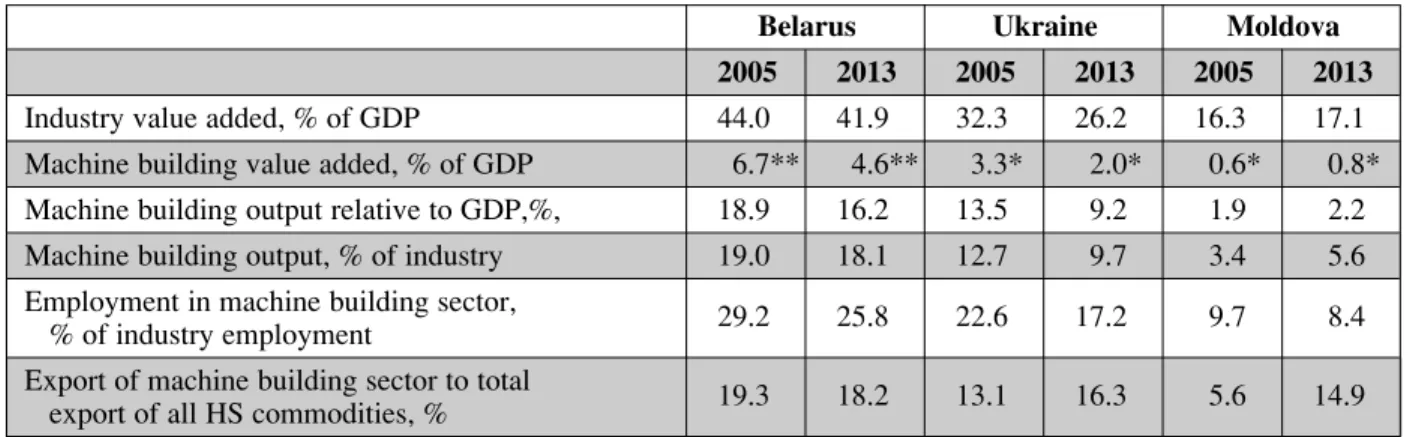
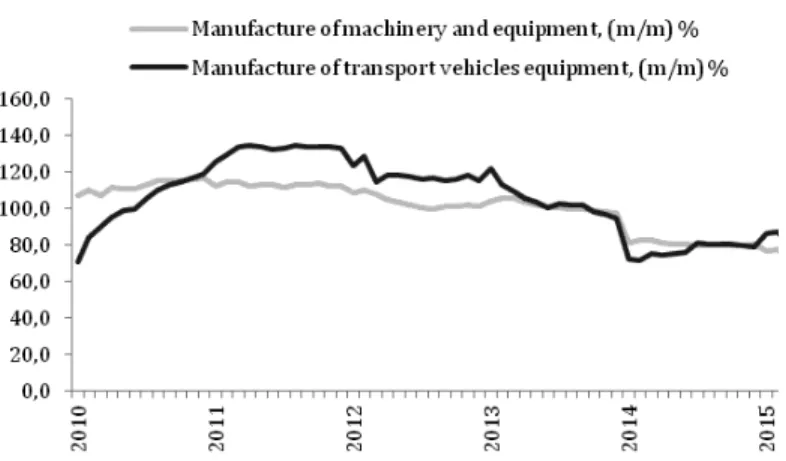
The supply of electricity and gas is by far the most important single industrial activity in Ukraine, which reflects an outdated industrial structure with mining and production of metals serving as the pillars. Machine-building has also played an important part, though its share has been declining in recent years (see Table 14 in the Statistical Appendix, which shows that the total share of machine-building industries is decreasing faster than that of manufacturing). Similarly, the Ukrainian chemical industry has also been in decline for some time. Both machine-building and chemical industries produce for the domestic and the CIS market, and their waning role has been an important factor in the decline of the entire Ukrainian manufacturing sector. These two branches, which are simultaneously very vulnerable and important, are the focus of this project, which is why we are going to examine their dynamics and their relative importance for the two other economies as well.
Food processing is the single most important industrial branch for Belarus, but it is closely followed by refined petroleum products as Belarus refines Russian oil and sells it to the EU. Manufacture of machinery accounts for almost 15% of Belarusian industrial activity. Other important branches are the chemical industry, the manufacturing of mineral products and the supply of energy.
Manufacture of machinery, otherwise growing, dropped both in 2009 and in 2013-2014. The chemical industry, by contrast, has been expanding continuously through 2005-2014, with only one contraction in 2013.
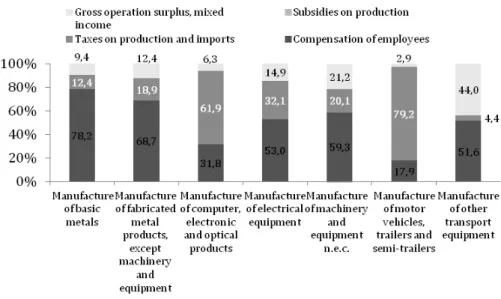
Figure 3.Structure of industrial production in Ukraine, Belarus and Moldova by types of economic activity, 2013-2014
Source:national statistical offices of the respective countries Note:* – provisional data
The industry of Moldova, a traditional agricultural country, is highly skewed towards food processing (see Figure 3). It is followed by light industry and the manufacturing of mineral products. Machine-building takes up a mere 7% share of industrial output; the production of chemicals is negligible. Machine-building dropped both in 2008-2009 and 2013.
Another report in the project will cover the entirety of the energy dimension for the three countries, but for the moment we would like to highlight trends in the aggregated data (see Figure
(11%)
(19%)
(15%)
(25%)
(24%)
(16%)
(15%)
(44%)
(13%)
(13%)
2). There does not seem to be any indication of significant improvements in the total efficiency of energy use in either Belarus or Ukraine. However, in Moldova, there appears to be reason to believe that the declining energy supply and growing manufacturing volumes, coupled with liberalized energy tariffs for households, indicate some positive changes in the local energy market.
Labor market
While at the first glance the situation in the labor markets of the three countries seems fairly positive as unemployment rates are low, this is not necessarily the case. With fewer than 1% registered as unemployed (down from 2% in 2000) and a high share of the population being economically active, the state of the Belarusian economy appears particularly favorable. However, the situation is a result of the relatively unchanged structure of production and government efforts to maintain full employment (Chubrik and Kazlou, 2013). In fact, estimates suggest that the true unemployment rate is in the range of 6% (see Table 2). It seems that with certain macroeconomic threats looming in the near term,3the Belarusian labor market is yet to face the burdens of structural adjustment.
The Moldovan labor market has undergone the most severe transformation of the three countries since the dissolution of the Soviet Union, including massive processes of job destruction and job creation. Since the early 2000s, there has been a dramatic fall in labor force participation. The share of the economically active population dropped from 60% in 2000 to 41% in 2013, as a result of an increasing number of persons becoming inactive (Cantarji, Mincu, 2013). As this economically inactive group also includes migrants, among others, it seems reasonable to expect that increased labor migration was an important factor behind this change.
Table 2.Labor statistics of Belarus, Moldova and Ukraine, 2013-2014
Source:
Source:National Statistical Committee of the Republic of Belarus, Chubrik and Kazlou (2013) – Belarusian data for 2009-2010,National Statistical Committee of the Republic of Belarus, Chubrik and Kazlou (2013) – Belarusian data for 2009-2010, State Statistics Service of Ukraine, National Bureau of Statistics of the Republic of Moldova
State Statistics Service of Ukraine, National Bureau of Statistics of the Republic of Moldova nonote:* – estimate
In Ukraine, the number of the economically active persons has fallen by nearly 3 million since 2000, following the rapidly shrinking population. While there were 22.8 million economically active people in 2000, the most recent data show that there are only 19.9 million now. At the same time, the rate of economic activity has remained fairly stable, and is the highest of the three countries investigated at over 60%. The unemployment rate is still below 10%, which is high but does not appear dramatic in international comparison. However, recently it has risen to the levels seen in the early 2000s, reversing a decade-long trend.
Around a quarter of the labor force in Moldova, Belarus and Ukraine have completed tertiary education (see Table 3), which makes their educational attainment very similar to those of the labor forces in the Visegrad countries.
3See the following section on the needs to reduce subsidies in order to maintain sustainable fiscal stance.
Belarus Moldova Ukraine
2014* 2013 2014
economically active population, in thousands 4 509.0 1 235.8 19 920.9
labor force participation rate 69 (in 2010) 41.4 62.4
unemployment rate LFS 6.1 (in 2009) 9.3 8.9
registered 0.5 2.4 2.4
Table 3.Education of the labor force in Belarus and Moldova, 2000-2009
Source:World Development Indicators; * – own calculations based on the data from Ukraine’s State Statistical Service “Economic Activity of the Ukrainian Population in 2013” (in Ukrainian)
What is interesting is that in Moldova there has been a consistent trend over the last decade of a growing number of university graduates entering the labor market. At the same time, among the countries investigated, Moldova has the lowest share of workers with secondary education, which probably reflects the agricultural profile of the country and is also the result of a polarization of skills; the lower skilled segment of the population is taking agricultural jobs or engages in subsistence farming rather than pursuing formal training beyond a certain point.
A striking difference between these countries and the EU members is the low level of labor productivity in the former (see Table 4). Leaving Belarus’ high productivity figures aside, we get the result that German workers are over four times as productive as Ukrainian ones, and nearly three times as productive as Moldovans. Similarly, Polish workers seem to be nearly three times more productive than their Ukrainian counterparts and nearly twice as productive as Moldovan employees.
Table 4.Labor productivity: GDP per person employed, 2009-2012
Source:WB WDI
Note:GDP is expressed in constant 1990 PPP $
Moldova Belarus Ukraine
2000 2012 2009 2013
Labor force with tertiary education (% of total) 11.8 24.8 24.3 28.8*
Labor force with secondary education (% of total) 58.8 54.5 69.9 50.4*
Country Name 2009 2010 2011 2012
Belarus 26 737.00 28 435.00 29 547.00 30 974.00
Moldova 12 273.00 13 615.00 14 600.00 15 190.00
Ukraine 9 237.00 9 585.00 10 170.00 10 552.00
countries of comparison:
Russian Federation 17 585.00 18 318.00 19 012.00 19 656.00
Czech Republic 25 735.00 26 648.00 27 081.00 26 781.00
Hungary 20 392.00 20 520.00 20 772.00 20 328.00
Poland 25 219.00 26 075.00 26 934.00 27 502.00
Slovak Republic 30 688.00 32 526.00 32 990.00 33 513.00
Germany 41 231.00 42 699.0s0 43 393.00 43 243.00
Public finances and fiscal policies
Budget revenues
In terms of public finances, Moldova, Ukraine and Belarus have a lot in common as a result of joint heritage and the exchange of experience within the CIS. As with most CIS countries, large portions of the state’s tax revenues are derived from indirect taxes, i.e. VAT and excises. In 2011- 2013, Moldova collected 15.6% of GDP on average in VAT and excise revenues, while in Ukraine the corresponding revenues stood at 12.1% of GDP and in Belarus at 11.1% of GDP. Notably, the base VAT rate is 20% for all three countries. Differences in tax revenue likely reflect different shares of consumption in the respective countries’ GDP. In Moldova, household consumption is over 90% of GDP thanks to considerable remittances from abroad, while in Belarus the state directs significant resources to capital investments.
Table 5.General government budget in Belarus
Source:IMF (Government Finance statistics, country reports)
At the same time, revenues from personal income taxes are less than in the EU countries. This results in part from low flat tax rates on individual income, which were introduced in most CIS countries in the 2000s. As compared to the EU average of 9.5% of GDP, in 2012, the revenue from income taxes ranged from 2.3% of GDP in Moldova to 3.6-4.8% of GDP in Belarus and Ukraine. Still, corporate and personal income taxes are significant sources of revenues in Ukraine and Belarus.
Other types of taxes play a lesser role. Property taxes are relatively undeveloped in all three countries, with revenues maxing out at 1% of GDP in 2013. The recent expansion of the property tax in Ukraine may lead to higher revenues in 2015 and 2016. As part of the WTO accession, Ukraine and Moldova committed themselves to apply low tariffs on imports, while intra-CIS trade is mostly duty-free. This resulted in low revenues from import duties in these two countries (0.9% of GDP and 1.4% of GDP, respectively, in 2013). Taxes on international trade are more
% of GDP 2005 2006 2007 2008 2009 2010 2011 2012 2013 2014
Total revenues 48.8 49.8 50.8 52.0 47.2 43.0 39.8 42.0 42.8 40.3
Taxes 34.3 34.0 35.2 37.7 30.1 27.3 24.7 26.0 25.4 22.0
Taxes on Income and Profits including 7.6 7.8 7.7 8.6 7.0 7.2 6.2 7.5 7.7 6.7
Personal income tax 2.9 3.1 3.2 3.2 3.1 3.3 3.1 3.6 4.2 4.1
Corporate profit tax 4.2 4.2 4.1 4.9 3.5 3.6 2.2 3.9 3.3 2.6
Taxes on Property 1.8 1.6 1.6 1.5 1.2 1.1 0.9 1.0 1.2 1.2
Taxes on Goods and Services 18.6 18.6 17.5 16.0 14.7 14.1 11.8 12.0 12.9 11.7
Taxes on International Trade 2.6 2.6 6.5 8.2 5.8 3.5 5.1 4.8 3.6 2.4
Other Taxes 3.8 3.4 2.0 3.3 1.4 1.3 0.7 0.7 0.0 0.0
Social Contributions 11.3 11.7 11.6 11.2 11.5 11.7 9.7 10.5 11.8 12.1
Other Revenue 3.2 4.1 4.0 3.2 5.7 4.0 5.4 5.6 6.2 6.2
Total Expenditure 48.6 48.0 49.6 48.5 47.6 44.8 36.7 41.2 42.7 40.2
Compensation of Employees 10.9 11.0 10.3 9.0 9.1 9.4 8.4 8.9 8.6 8.7
Use of Goods and Services 8.2 9.8 9.8 9.2 7.8 7.4 6.4 7.2 5.2 5.2
Interest 0.4 0.4 0.4 0.6 0.8 0.7 1.1 1.4 1.0 1.1
Subsidies and Transfers 5.9 5.7 7.7 9.1 8.9 5.4 4.6 5.1 4.9 7.0
Social Benefits 13.1 12.9 12.9 11.9 13.0 13.6 11.4 12.7 14.1 12.1
Capital spending and other expenditure 10.2 8.2 8.5 8.8 8.1 8.3 4.9 5.9 8.9 6.1
important for Belarus due to higher tariff barriers (harmonized with Russia as part of the Customs Union) and large export duties on energy.
Extra-budgetary funds
Payroll taxes, which are paid into social funds and are not included in the budget, also significantly increase the tax burden on wages. In 2013, social funds collected an additional 10-13% of GDP in payroll taxes (13.3% in Ukraine) as compared to the EU average of 11.4% of GDP (in 2012). In part, this reflected popular expectations that the state should provide benefits from cradle to grave, and in part it was the result of relatively low GDP per capita figures. The significant incidence of informally paid wages was another reason why social contributions comprise a large part of the labor costs in the three countries.
Table 6.General government budget in Moldova
% of GDP 2005 2006 2007 2008 2009 2010 2011 2012 2013 2014
Revenue 38,6 39,9 41,7 40,6 38,9 38,3 36,6 38 36,8 39,3
Taxes 23,3 24,7 25,6 24,5 21,6 21,8 21,7 23,2 23,1 23,2
Taxes on Income and Profits including 4,4 4,9 5,2 3,5 3,2 2,8 2,8 4,5 4,2 4,4
Personal income tax 2,2 2,5 2,5 2,4 2,7 2,4 2,1 2,3 2 2,2
Corporate profit tax 2,1 2,4 2,8 1,1 0,5 0,5 0,7 2,2 2,2 2,2
Taxes on Property 0,6 0,5 0,4 0,4 0,4 0,4 0,3 0,3 0,4 0,4
Taxes on Goods and Services 16,2 17,8 18,2 18,7 16,5 17,1 17,1 16,9 17,1 17
Taxes on International Trade 1,8 1,4 1,7 1,8 1,5 1,5 1,4 1,5 1,4 1,4
Social Contributions 7,8 9,5 9,6 10,5 11,5 10,4 10 10,1 9,8 10,2
Grants 1,2 0,7 1,8 1,6 1,9 2,7 1,9 1,7 2,1 3,3
Other Revenue 6,2 5 4,7 4 3,9 3,5 3 2,9 1,8 2,6
Total Expenditure 37,2 40,3 41,9 41,4 45,2 40,8 39 40,2 38,6 41,4
Compensation of Employees 7,9 9,6 9,3 9,2 11,6 10,2 9,4 9,6 8,3 8,7
Use of Goods and Services 6,4 7,9 7,8 8,2 9 8,9 8,5 9,1 8,8 9,4
Interest 1,3 1 1,2 1,2 1,4 0,8 0,8 0,8 0,5 0,6
Subsidies and Transfers 2,1 3,2 3,2 3,2 1,9 1,3 1,2 1,3 1,3 1,4
Social Benefits 11 10,9 11,4 11,6 14,5 13,6 12,9 12,6 12,2 12,9
Capital spending and other expenditure 8,4 7,7 9 8 6,7 6 6,1 6,9 7,5 8,4
Source: IMF (Government Finance statistics, country reports)
In Ukraine, election cycles also contributed to unsustainable pension increases. In 2013, this led to pension payments climbing to 17% of GDP (one of the highest levels in Europe), and forced the government to transfer a large part (up to 4% of GDP) of budgetary revenues to the pension fund.
Spending in other two countries was more restrained, as pension funds in Belarus and Moldova were almost balanced and even ran small surpluses over the last few years. In Belarus, the incidence of informal employment was also likely lower.
Subsidies
Energy subsidies are another sign of the paternalistic state. Before the 2008 crisis, they were present in all countries as energy prices for households (i.e. electricity, gas and heating tariffs) were set below cost- recovery levels. This was a significant drain on state resources, encouraged
corruption, discouraged investment in energy efficiency and resulted in very poorly targeted safety nets. After 2008, subsidies were reduced as part of efforts towards fiscal consolidation implemented in the framework of IMF programs in Ukraine, Belarus and Moldova. Currently, Belarus and Ukraine still have substantial energy subsidies that are provided mostly through cross subsidization. Energy tariffs in Moldova are close to cost-covering levels, although the recent depreciation of the local currency pushed the prices below this level. At the same time, a recent increase in gas tariffs removed a significant part of the subsidies in Ukraine. There are plans to replace them completely with targeted subsidies for low-income households by 2018.
Budget expenditures
If we look at spending as a whole, we also observe a paternalistic state in action. As part of post- crisis austerity, Moldova cut spending on wages and transfers to households (including pensions) from 26.4% of GDP in 2009 to 20.5% in 2013. But such ‘social’ spending still makes up well over half of all general government expenditures. In Ukraine, the government increased social benefits and public sector wages despite zero economic growth. As a result, the compensation of employees and social benefits rose to a massive 34.6% of GDP and over 70% of general government expenditures in 2013. In the case of Belarus, the government spends ‘only’ 21.1% of GDP on budget sector wages and social benefits. However, such expenditures still account for almost 60% of general government spending. Moreover, the government requires companies in the vast state-owned sector to increase wages considerably faster than gains in productivity would indicate. The large share of social spending reduces the economies’ flexibility to react to business cycles.
Table 7.General government budget in Ukraine
Source:IMF (Government Finance statistics, country reports)
2005 2006 2007 2008 2009 2010 2011 2012 2013 2014
Revenue 41.5 43.1 41.8 43.1 42.1 41.6 42.8 44.4 43.3 40.6
Taxes 22.3 23.2 22.4 24.1 22.9 21.8 24.1 24.3 24.3 23.9
Taxes on Income and Profits including 9.6 9.3 9.8 9.9 8.5 8.4 8.9 8.8 8.7 7.3
Personal income tax 4.1 4.3 4.9 4.8 4.9 4.7 4.6 4.8 4.9 4.8
Corporate profit tax 5.5 4.9 4.9 5.0 3.6 3.7 4.2 4.0 3.8 2.6
Taxes on Property 0.4 0.3 0.2 0.6 0.8 0.8 0.7 0.8 0.9 0.8
Taxes on Goods and Services 10.6 12.1 10.8 12.0 12.5 11.5 13.4 13.4 12.0 12.8
Taxes on International Trade 1.7 1.6 1.6 1.4 0.8 0.9 0.9 0.9 0.9 0.8
Other Taxes 0.0 0.0 0.0 0.1 0.1 0.1 0.1 0.1 1.9 2.3
Social Contributions 12.6 12.9 13.0 12.4 12.6 12.6 12.2 12.9 13.2 11.7
Other Revenue 6.7 6.9 6.4 6.6 6.6 7.1 6.4 7.2 5.8 5.0
Total Expenditure 42.9 44.1 42.4 44.8 47.9 48.1 45.1 48.2 48.1 45.1 Compensation of Employees 9.9 10.4 10.3 10.6 11.9 11.7 10.6 11.4 11.4 10.3
Use of Goods and Services 6.7 6.8 6.6 6.5 7.6 7.5 7.0 7.5 7.1 7.4
Interest 0.8 0.7 0.6 0.5 1.2 1.6 2.0 1.9 2.4 3.3
Subsidies and Transfers 2.3 3.2 2.9 3.7 3.0 2.5 2.0 3.1 2.0 2.4
Social Benefits 19.4 18.9 17.3 17.1 20.0 19.2 17.5 17.8 22.9 20.6
Capital spending and other expenditure 3.8 4.1 4.7 6.4 4.2 5.6 6.1 6.4 2.2 1.1
Budget balances and dependence on external financing
In 2012 and 2013, the budget deficit in Moldova was around 2% of GDP; in Ukraine it was 4%
of GDP; the budget in Belarus, by contrast, featured a tiny surplus. However, headline figures are not always useful. In Ukraine, the deficit figures did not include quasi-fiscal operations supporting state-owned banks, the state-owned gas monopoly Naftogaz, the pension fund or guaranteed loans raised by state companies that are unlikely to have sufficient cash flows to repay the loans. The IMF estimated that the resultant real deficit stood at 6.7% of GDP in 2014. In the case of Moldova, it could be useful to look at the deficit excluding grants from international donors, as there is no guarantee that these will keep flowing in, and their absence would bring the deficit to 3.8%. And in Belarus, there were even more quasi-fiscal operations, including spending on bank restructuring, guaranteed debt payments and ‘directed lending’, where the government requires banks to lend to priority companies at a discounted interest rate, but while the state serves as the guarantor for the loan. The resulting broad measure of the fiscal deficit stood at 6.3% of GDP in 2013 (according to the IMF country report).
As a result of high credit risk, the access of Ukraine and Belarus to global financial markets (Moldova has not tried to issue Eurobonds over the last 10 years) was limited over the last years.
Belarus was able to issue USD 800 million in Eurobonds in January 2011, but it has failed to issue any since then. Ukraine used its windows of opportunity when demand for high-yielding securities was especially high to issue USD 9.75 billion in Eurobonds in 2011-2013 (excluding a USD 3 billion sale of Eurobonds to Russia in December 2013). At the same time, funding from official creditors was limited after Ukraine’s IMF program went off-track in 2010.
Moldova was more successful in raising grants and loans from a wide range of official creditors:
from the IMF and the World Bank to the EU and individual countries. After Belarus diverged from the IMF program in 2010, and was unable to raise commercial external debt, it had to rely on Russia or Russian-controlled donors for external financing.
On the domestic side, shallow financial markets limited investment in government bonds. In Ukraine, the central bank (NBU) printed money by purchasing government bonds on the secondary market. 72% of the increase in government bonds outstanding between Jan 1, 2011 and Jan 1, 2014 were purchased by the NBU, and only 23% were bought by commercial banks. Over the same three-year period, the government in Moldova raised only an equivalent of USD 150 million in domestic markets.
In Belarus, Ukraine and Moldova, privatization was not the major source of financing in 2012 and 2013. although each country has a vast publicly-owned sector sufficient for a few years of privatization. The statistics suggests that in 2011, privatization was more successful in Ukraine and Belarus. However, in Belarus the privatization of the state-owned gas monopolist was really a debt-to-equity swap, and in Ukraine a large segment of the electricity generating and transmission infrastructure was sold below market value to form a new monopolist in the electricity market.
Ukraine ran high general government deficits at a time when nominal GDP growth slowed to a crawl, and the country accumulated the highest level of external debt out of the three countries discussed here. This led to unsustainable increases in its debt level, especially after the hrvynia lost half its value versus the US dollar in 2014. By the end of 2014, the public debt stock of Ukraine exceeded 70% of GDP, compared to a historic low of 12% at the end of 2007. To maximize the impact of its IMF program, Ukraine plans to restructure its external debt to reduce the principal, delay the maturity date and possibly reduce interest on the debt. The depreciation of the Moldovan leiand of the Belorussian rubelhas also led to a surge in debt relative to GDP in these countries.
At the same time, Moldova maintained economic growth and relatively low fiscal deficits over the last several years, while public debt rose only slightly, to 31% from 30% of GDP. The concessionary terms of external lending also mean that annual debt service is comparatively low.
At just over 25% of GDP, Belarus has the lowest public debt level out of the three countries, but
it faces USD 4 billion in foreign currency debt service in 2015. In part, Belarus was able to refinance external debt in 2015 with new loans from Russia.
Overall, the three countries have work to do on fiscal consolidation, in terms of ensuring that their public debt remains on a sustainable trajectory, and that populism in fiscal policy as well as in medium-term planning are reduced. They will have to do this in a challenging environment.
Key partner economies (Russia, EU) are expected to be in recession or grow under 2% in 2015- 2017. Ukraine’s GDP is projected to fall from USD 180bn in 2013 to less than USD 90bn in 2015. Thus, Ukraine is currently in the middle of debt restructuring talks with holders of external commercial government debt. If these talks are successful, Ukraine will still have to ensure that its public finances are nearly balanced to keep debt sustainable. Belarus and Moldova have lower public debt but due to the small size of their domestic financial sectors and lacking access to global financial markets, they have limited options in raising commercial financing. As a result, they will also have to pick priorities for fiscal spending; attempt to reduce inefficiencies in public procurement;
and raise revenues and work on expanding the tax base.
International trade and investments
Balance of payments
Over the analyzed period of 1998-2014, the balances of payments of Ukraine, Belarus and Moldova were predominantly characterized by negative current account balances and positive financial and capital account balances; however, the factors that influenced the dynamics underlying the respective figures differed from country to country. The recent common feature of all the BoPs in these countries is a significant deterioration of the situation in 2014, which led to negative overall balances in all of them. As a result, they now require external financing as well as the use of international reserves.
Ukraine. Current accounts are driven by the negative balance of trade in merchandise, which could not be counterbalanced by the positive net exports of services. Primary and secondary income play a minor role in current accounts, and to some extent they balance each other, as the net outflow of primary income (return on production factors) is comparable in scope to the net inflow of secondary income (remittances). Financial accounts were positive during the recent years, which was a result of FDI and debt capital inflows. However, in 2014 the situation changed dramatically, as the current account deficit shrunk from USD 16.5bn in 2013 to USD 5.3bn, as imports contracted at a faster rate than exports. On the other hand, financial accounts went from a positive balance of USD 18.6bn in 2013 to a huge deficit of USD 8.4bn in 2014 (Figure 4). Such changes in the financial accounts were driven by a huge contraction in the rate of FDI inflow, as well as more limited access to external financing for banks and the real sector, whereas the government was able to attract significant financing from international partners and donors.
Another downward pressure resulted from significant repayments through trade credits. As a result, the overall deficit in the balance of payments was USD 13.3bn; of this deficit, USD 12.2bn were funded by international reserves. Previously, the overall balance of payments had been positive until the world financial crisis, which allowed the National Bank of Ukraine to replenish its international reserves. Moreover, there was a period between 1999-2005 when the current account was in surplus, whereas the financial accounts exhibited negative results. Since 2008, deficits in the BoP have become more regular than surpluses. For example, in 2009 the overall deficit amounted to USD 13.7bn, in 2014 – as was previously mentioned – it dropped to USD 13.3bn.
In the coming years, it is expected that the current account balance will become positive after 2016, whereas the financial account will do so already in 2015. As a result, the overall balance will become positive as of 2015. According to the IMF Extended Fund Facility, this will allow the National Bank of Ukraine to replenish its international reserves.
Figure 4.Ukraine’s Balance of Payments
Source:National Bank of Ukraine
Belarus. Historically, Belarus current account was mainly negative as the positive balance in the trade of services failed to counterbalance the negative net exports of goods, which was in recent years accompanied by a net outflow of both primary and secondary income. The financial account was in surplus. The positive balance of the financial accounts was mainly driven by the net inflow of FDI into the Belarusian economy, as well as the net impact of loans and bonds. The real sector experienced a net inflow of debt financing, whereas banks borrowed internationally only in certain years; however, these inflows into the banking system significantly influenced the financial account surplus. The extent to which the financial account surplus was enough to cover the current account deficit varied, as the overall balance during the analyzed period ranged from net positive to net negative values, and also stood at zero in certain years. However, during the recent 2012-2014 period the overall balance was negative; moreover, the deficit narrowed (Figure 5). International reserves were one of the main sources for financing the deficit in the balance of payments. At the end of the 2000s, the reserves were accompanied by IMF loans, whereas in the 2010s external financing became actively used.
Figure 5.Belarus’ Balance of Payments
Source:National Bank of the Republic of Belarus
Moldova. During the period under analysis, the current account was negative as the inflow of remittances and workers’ compensation, which play a more important role in the BoP of Belarus than in the case of the other two countries, failed to completely cover the negative balance of the trade in goods. The financial account was in surplus due to the net inflow of FDI as well as the positive balance of trade credits and lending to the real sector and banking. However, because of restricted access to external financing and the outflow of deposits from the banking system, the financial account surplus has contracted significantly in 2014, and fell into the negative domain
by USD 0.6bn (Figure 6). As a result, the overall balance in 2014 turned from positive USD 0.2bn a year ago to negative USD 0.9bn. The resulting deficit was financed by international reserves as well as external loans.
Figure 6.Moldova’s Balance of Payments
Source:National Bank of Moldova
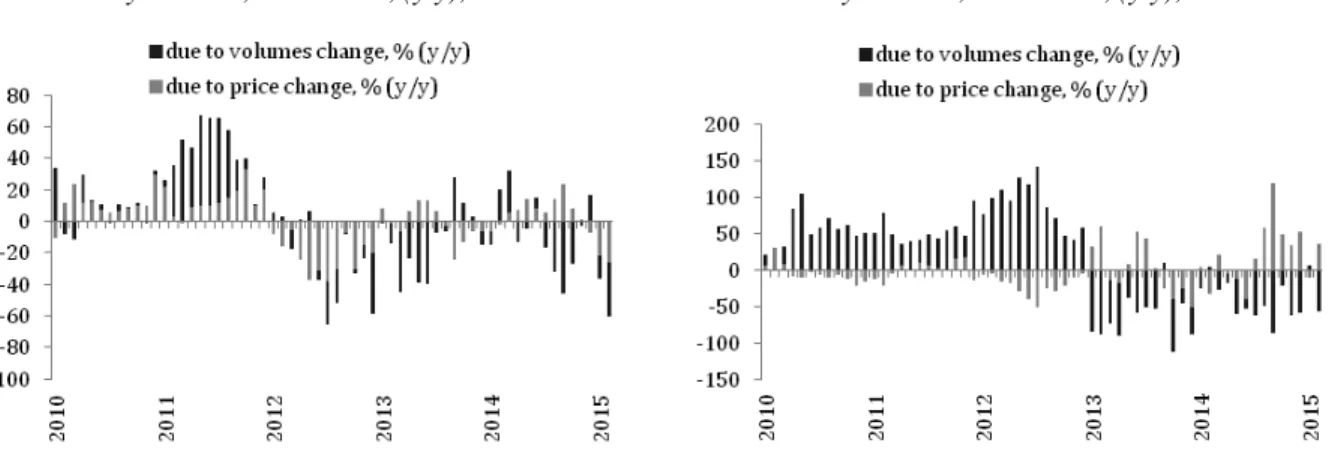
Trade in goods
Overall, external trade in goods and services in Ukraine, Belarus and Moldova during the period 1998-2014 was characterized by a gradual expansion, which was interrupted by three episodes of contraction. The first episode occurred in 1998-1999 and was triggered by an economic crisis in the CIS region as a result of Russia’s default. As Ukraine’s and Moldova’s economies contracted as well, the trade volumes of Belarus – whose economy was growing at the end of 90s – suffered from the economic crisis in its CIS trading partners. The second episode occurred in 2009 and was related to the world economic crisis and external and domestic factors emanating therefrom.
Finally, the third episode happened in 2013-2014 and resulted from lower external demand in 2013, as well as the economic crisis in the region in 2014. Such developments in trade led to huge changes in the trade structure of Ukraine, Belarus and Moldova; however, the specific nature of these changes was different in each country. In Ukraine and Belarus, the machine building and energy sectors, which are defined as vulnerable sectors, are dependent on the Russian market, whereas in Moldova these sectors depend on the EU.
Ukraine. After falling trade turnover in 1998-1999 (by 13-14% yoy), which resulted in a greater negative impact on imports than exports, Ukraine’s trade in goods expanded significantly between 2000 and 2008 (Figure 8). Exports of goods increased from USD 14.6 billion in 2000 to USD 67.0 billion in 2008, while imports of merchandise surged from USD 14.0 billion in 2000 to USD 85.5 billion in 2008. The second period of contraction in 2009 resulted in a 44% drop in the traded volume of merchandise; moreover, imports contracted more than exports. However, by 2011 exports had recovered to their pre-crisis levels of 2008, while imports were ultimately lower than their peak value in 2008. Finally, the third episode of contraction began in 2013 and was the result of lower external demand and economic stagnation, intensified by the prevailing political and economic crisis in 2014. As a result, over the past two years the total volume of external trade in goods contracted by almost 30%. Ukraine started with an export volume of USD 12.6 billion and an import volume of USD 14.7 billion in 1998, and it reached its peak export values in 2012 with USD 68.8 billion, and its top import values in 2008 with USD 85.5 billion. As of 2014, Ukraine exported USD 53.9 billion of goods and imported USD 54.4 billion.
Figure 7.Ukraine’s merchandise trade in 1998-2014, USD bn
Source:State Statistics Services of Ukraine
For most of the period under investigation, Ukraine remained a net importer of goods; during 2000-2004, however, the fast expansion of exports led to a positive trade balance in the trade of goods. Trade in goods also accounted for a significant share of GDP, with an average value of 82.4% (78.7% in 2014) during the period 1998-2014, with imports slightly outweighing exports (43.0% vs. 39.4%, respectively).
Such developments in the dynamics of merchandise trade caused changes in both sectoral and geographical structure. The main trends in sectoral change included a decline in share of exports taken up by industry and a rising share of raw and processed food production. Thus, in the late 1990s metals accounted for 42% of the overall exports of goods, agricultural and food products for 11-12%, minerals for 10%, and machinery for 9%. By 2014 share of agrifood products had expanded to 31%, mainly due to vegetable products (especially cereals and oilseeds). Among exports of heavy industry produce, the share of metals decreased to 28.3%, the share of chemicals fell to 5.7%, but the share of machinery increased to 10.5%. At the same time, the share of mineral exports also expanded during the period analyzed, from 5.1% to 7.6%. Speaking about the structure of exports in terms of the level of processing involved in the production of export goods, Ukraine’s merchandise exports are dominated by intermediate goods, but their share decreased from 55.8%
in 1998 to 45.1% in 2013 (Figure 9).
Figure 8.Ukraine’s merchandise exports structure (HS classification)
Source:State Statistics Services of Ukraine
1998 1999 2000 2001 2002 2003 2004 2005 2006 2007 2008 2009 2010 2011 2012 2013 2014
Both sectoral and geographic diversification of exports are not unified across commodity groups.
The most diversified export groups in terms of destinations were fresh food (3 major trading partners accounted for 24.6% of overall product group exports), basic manufactures (38.8%) and processed food (38.8%), while the least diversified were transport equipment (75.6%), non- electronic machinery (70.0%) and IT & consumer electronics (68.4%). Speaking about the commodity diversification of shipments, the most diversified export groups were miscellaneous products (3 major exporting commodities accounted for 15.9% of this commodity group’s exports), clothing (18.1%) and non-electronic equipment (22.4%), whereas the most concentrated exports were unclassified products (99.7%), fresh food (75.1%) and IT & consumer electronics (65.9%) (Table 8).
Table 8.Sectoral distribution and diversification of Ukraine’s exports of goods in 2013
Source:ITC Trade Competitiveness Map
The imports of goods during the period 1998-2014 were dominated by fuels, but their share in overall shipments decreased significantly from 40.5% in 1998 to 27.9% in 2014. The second pro- duct group by share in imports was machinery and equipment, which was almost unchanged over the period analyzed and remained close to 16%. Also, by 2014 plastics and rubber (6.7%), transports (4.9%) and food products (4.8%) had comparatively high shares as well. In contrast to exports, the imports of goods were dominated by consumer goods, accounting for more than half of all shipments (Figure 10).
Sector’s
Average export Share of
share of growth top 3 Share of sector in in value detailed top 3
Sector country’s (% per products importing Leading exported product HS6 Top 3 importing
exports annum) (HS6) in countries countries
2009- 2009- sector’s in sector’s 2013 2013 exports exports
Basic manufactures 30.8% 8.7% 29.0% 38.8% 720712 semi-finished products Russia; Turkey; Italy of iron or non-alloy steel
Chemicals 7.3% 12.9% 42.0% 40.4% 310210 Urea Russia; Turkey; USA
German; Russia;
Clothing 1.0% 1.6% 18.1% 53.0% 620342 Mens/boys trousers and shorts Hungary
854430 Ignition wirg sets&oth wirg sets Russia; Hungary;
Electronic components 3.6% 8.3% 58.1% 56.1% usd in vehicles, aircraft Poland Egypt; Spain;
Fresh food 11.4% 15.9% 75.1% 24.6% 100590 Maize (corn) Netherlands
IT & consumer electronics 1.0% 14.0% 65.9% 68.4% 852871 Reception apparatus for Russia; Hungary;
television India
Italy; Poland;
Leather products 0.5% 1.3% 37.6% 61.1% 410411 Full grains, unsplit; grain splits Romania
Minerals 13.5% 16.3% 52.8% 44.9% 260111 Iron ores &concentrates China; Russia; Poland Italy; Poland;
Miscellaneous manufacturing 2.1% 13.2% 15.9% 65.1% 940360 Furniture, wooden Belarus 841122 Turbo-propellers of a power Russia; China;
Non-electronic machinery 6.0% 9.6% 22.4% 70.0% exceeding 1100 KW Kazakhstan
151211 Sunflower-seed or safflower oil,
Processed food 11.6% 15.5% 53.8% 38.8% crude Russia; India; China
630790 Made up articles, of textile Russia; Belarus;
Textiles 0.3% 7.9% 26.0% 51.9% materials Germany
860610 Railway tank cars, not self- Russia; Kazakhstan;
Transport equipment 6.4% 20.5% 45.1% 75.6% propelled Belarus
999999 Commodities not elsewhere India; Thailand;
Unclassified products 0.8% 6.5% 99.7% 61.6% specified Switzerland
481420 Wallpaper,coated/covered
on the face side with a decorated layer Russia; Poland;
Wood products 3.1% 13.0% 34.6% 50.1% of plastics Kazakhstan
Figure 9Ukraine’s merchandise imports structure (HS classification)
Source:State Statistics Services of Ukraine
Diversification was also not uniform among imported commodities. In terms of trading partners, the most diversified were fresh food (23.8%), processed food (38.6%) and chemicals (39.3%), while the most concentrated were minerals (80.5%), leather products (80.2%) and clothing (73.0%).
Three major imported goods had the smallest share within sectoral imports for textiles (11.2%), basic manufactures (13.8%) and miscellaneous manufacturing (15.6%), but the least diversified were unclassified products (93.5%), minerals (80.8%) and IT & consumer electronics (60.2%) (Table 9).
Table 9.Sectoral diversification of Ukraine’s imports of goods in 2013
Source:ITC Trade Competitiveness Map Sector’s
Average export Share of
share of growth top 3 Share of sector in in value detailed top 3
Sector country’s (% per products importing Leading exported product HS6 Top 3 importing
exports annum) (HS6) in countries countries
2009- 2009- sector’s in sector’s 2013 2013 exports exports
Basic manufactures 7.9% 15.8% 13.8% 58.9% 722540 Flat rolled products Russia; China; Poland
Chemicals 15.1% 13.0% 21.4% 39.3% 300490 Medicaments Russia; Germany; China
China; Turkey;
Clothing 1.1% 19.5% 17.3% 73.0% 620342 Mens/boys trousers and shorts Bangladesh 854140 Photosensitive semiconductor China; Germany;
Electronic components 4.5% 25.7% 25.6% 51.2% device, Russia
Turkey; Brazil;
Fresh food 5.5% 14.3% 17.5% 23.8% 080300 Bananas including plantains Germany
851712 Telephones for cellular networks China; Russia;
IT & consumer electronics 2.4% 27.5% 60.2% 67.4% mobile telephones Viet Nam China; Italy;
Leather products 0.9% 27.1% 49.4% 80.2% 640299 Footwear Viet Nam
Russia; Belarus;
Minerals 33.2% 9.4% 80.8% 80.5% 271121 Natural gas in gaseous state Lithuania Miscellaneous 3.6% 14.8% 15.6% 46.9% 950300 Tricycles, scooters, pedal cars China; Germany;
manufacturing and similar wheeled toys Russia
Non-electronic machinery 8.5% 15.9% 17.6% 47.7% 840130 Fuel elements (cartridges), Russia; Germany;
non-irradiated, for nuclear reactors China
Russia; Germany;
Processed food 3.8% 13.5% 20.2% 38.6% 210690 Food preparations Poland
China; Turkey;
Textiles 1.6% 13.2% 11.2% 50.0% 540772 Woven fabrics Germany
870323 Automobiles with spark- Germany; Russia;
Transport equipment 6.9% 28.2% 39.9% 40.8% ignition engine Japan
Unclassified products 1.5% 4.5% 93.5% 63.7% 710813 Gold non-monetary Switzerland;
Netherlands; UK Russia; Poland;
Wood products 2.7% 9.2% 25.5% 50.6% 481840 Sanitary articles of paper Germany
1998 1999 2000 2001 2002 2003 2004 2005 2006 2007 2008 2009 2010 2011 2012 2013 2014