E COCYCLES
ISSN 2416-2140 of the European Ecocycles Society
Ecocycles, Vol. 6, No. 1, pp. 28-38 (2020) DOI: 10.19040/ecocycles.v6i1.163
CASE STUDY
An unsustainability issue: the antagonism between fossil energy use and public health in China
Valéria Giber
University of Kaposvár, Hungary e-mail address: valeriagiber@gmail.com
Abstract – The Chinese environmental pollution and human health damages reached the point, when thecountry’s policy has to change direction by developing new strategies to substantially increase the share of renewable energy sources in their energy mix and reduce environmental pollution. This research will try to identify the potential variables of the antagonistic conflict regarding the constantly growing energy consumption vs. human health damages and environmental pollution in China. The identification of variables will be carried out through the lens of Sustainable Development Theory. This paper tries to weight the interactions among variables, find the most reactive and influential ones in order to give suggestions to changes in the policy.
The interaction among variables will be measured by using the Multi-Attribute Utility Theory and Cross-impact Matrix. Finally, the social vulnerability of the society will be discussed, where serious public health problems occur in case of world health crises such as the COVID-19 pandemic, which is particularly dangerous for those groups, which suffer from respiratory and cardiovascular diseases and immuno-deficiency problems.
Keywords – energy consumption, fossil fuels, energy mix, environmental pollution, renewable energy sources, sustainable development, public health, Multi-Attribute Utility Theory, Cross-impact Matrix, COVID-19 pandemic
Received: April 7, 2020 Accepted: April 16, 2020
INTRODUCTION
China has achieved the Great Economic Transformation in the last 35 years (China Greentech Initative, 2013). The Great Chinese Economic Transformation required constantly growing energy supply (Brandt & Rawski, 2008). At the beginning of the Transformation, the energy consumption of China grew relatively slowly, and domestic production could follow it. The second period lasted from 1973 to the beginning of early 90‘s, in which the total energy output exceeded total consumption with a moderate annual growth rate. The third period of the Transformation began in 1992.
Since then China’s energy consumption has overtaken domestic production and the country has become a net energy importer (Zhao & Wu, 2007). China now is the biggest energy consumer of the world and, according to Barchfield (2010) has overtaken the US in 2009.
In this study, the conflict between the constantly growing energy demands of China vs. the ecological damage of the growing energy consumption has been analyzed, because it is obvious that the Chinese Great Economic Transformation has a high ecological price adversely affecting both the natural environment and public health.
The main stakeholders are on one hand the government and the significant beneficiaries of the growing economy, and the other hand the suffering population and roughly most of the world’s population. However, the environmental and socio- economic position of the Chinese population is not perfectly one-sided, because the economic growth could be seen in a context of improving the living standards for the society as a whole, including the development of health care services.
The driving forces behind the conflict mostly depend on the economic structure of China, a mixture of capitalism and command economy. The whole Chinese economy is built on the constantly sustained economic growth, which requires a continuously raising energy supply. The political leaders, research scientists and economists in China are in a genuine consensus that undisturbed energy supply is the key strategic issue for economic development, social stability, and national security. Regarding the rapidly and more or less continuously growing economy, the energy demand of the country will further increase. Any sudden slow-down in this economic growth might result in social unrest with further adverse impact on the economic development (Xing, 2008). In proportion with the rate of economic growth, the ecological damages and environmental pollution have been growing constantly with the same rate during the last twenty years in
29
China. Since the main part of the energy supply is still based on fossil fuels, and the energy consumption increased by 30%
between 2000 and 2010, its environmental impact has been disastrous. In January 2013, the heavy smog and the concentration of hazardous particles in air (around forty times over the safe level according to WHO) caused so severe conditions in Beijing, that citizens dubbed it "airpocalypse".
The other serious environmental problem is the heavy pollution and depletion of freshwater resources, lakes, surface watercourses and ground water. Since many industries are situated along surface watercourses, these have been polluted heavily, due to insufficient wastewater cleaning technologies and operational security and a vast volume of production and discharge of pollutants. For example, due to a plant explosion
in 2005, more than one hundred tons of toxic chemicals were discharged into the Songhua river (Xu, 2014). According to the Global Burden of Disease Study in 2010, the incredible air pollution had been responsible for 1.2 million premature deaths in China in 2010 (Institute for Health Metrics and Evaluation at the University of Washington, 2010).
It is obvious, that the connection between environmental deterioration, the economic dependence on fossil energy use, insufficient waste management and urbanisation together with unfavourable demographical development have been taken into consideration by the political leaders of the country according to the goals of the 12th and the 13th Five Year Plans (FYP). The process started already before and under the 2008 Beijing Olympics, when heavy environmental regulation resulted a 30% improvement of air quality in just one year, and a corresponding drop in cardio and respiratory diseases could be registered among the residents of Beijing (Wood, 2019). The goals of the 12th Five Year Plan were quite ambitious in terms of the adjustment of energy consumption structure, new development of energy production
technologies, energy conservation and energy efficiency during the 2011 – 2015 period (Dong et al. 2017). In China, the mix of the primary energy consumption includes coal, oil, gas, nuclear and renewables, which are mainly used in transport, industry, building and others (Bilgen 2014), but the dominance of fossil energy is still overwhelming.
Furthermore, the energy use of the civil population is also a serious source of pollution, since it is dominated by burning of coal, oil and even biomass in households without any flue gas cleaning. Therefore, we need to analyse China’s energy production and consumption structure in the past, present and future taking into account the long-term strategies and the achievability of the closer strategic goals outlined by the 13th Five Year Plan (2016 – 2020), which includes an extensive Medium and Long-term Development Plan for Renewable
Energy in China (Koleski, 2017). Generally, the 13th FYP addresses the key problems of China’s economic and social development when it describes the economic boom as an
“unbalanced, uncoordinated, and unsustainable growth” and intends to facilitate a complex development in economic, environmental, political, cultural and social areas to achieve the original long-term vision of a “moderately prosperous society in all respects” through innovative, coordinated, green, open, and inclusive growth by 2035 and a powerful, socially, environmentally and economically sustainable socialist country by 2050 (Koleski, 2017; IEEJ, 2018).
Problem formulation
The aforementioned contradictory driving forces have drifted China in this difficult “catch 22” situation. Without the growing economy, the country would not have been able to maintain the already existing social structure and the constantly growing standard of living of the population and the reduction of the economic growth might eventuate social dissatisfaction and unrest. The constantly growing economy requires increasing energy consumption, but this growing Figure 1. The structure of the conflict: the constant economic growth requires increasing energy supply, which is still mainly fossil energy despite a considerable development of renewable technologies. This and the explosively increasing consumption results in growing environmental pollution due to emissions and discharge of pollutants and accumulation of solid waste causing damage to human health. The economic growth is followed by higher standards of living and, simultaneously, increasing socio- economic segregation. This is a cycle process, which should be controlled by monitoring and changing strategies taking into consideration the possibilities of another set conflicts caused by slower economic growth.
30
energy consumption is dominated by fossil energy sources, which generates larger and larger ecological damages caused by environmental pollution with serious adverse impact on public health. This cause and effect circle (Fig. 1) will not be sustainable anymore, because the environmental problems and the damage of human health reached an unbearable level in the last few years.
Finding an environmentally, economically and socially acceptable solution is not an easy task, because different suggestions, often one-sided solutions generate conflicts in the national and international political arenas. However, this way of economic growth in China, disregarding the carrying capacity of ecosystems is not sustainable anymore neither for the Chinese people, nor for the rest of the world.
Methods
This research aims to identify 6 main variables of this conflict through the lens of the Brundtland concept of Sustainable Development Theory (later: SD). This multi-layered conflict can be considered as a complex, transdisciplinary sustainability problem, which should be analysed in one system. For this interdisciplinary approach a portfolio of methods is required, including formative scenario analysis, which is an explorative construction tool to gain insight into a case and its potential development based on a set of well- defined assumptions, the system analysis, to identify the objectives of a system or multi-criteria decision analysis (MCDA), a method to solving problems regarding a choice among alternatives (particularly well suited for health care), which contributes to the successful application of a transdisciplinary approach (Seidl, et al., 2013; Frazão et al.
2018). Thus, the system will be analysed with the help of System Analysis method (Wuelser, et al., 2011) and the
interaction among the chosen factors will be presented in a simple cross impact matrix of influences.
The Multi-Attribute Utility Theory will be applied in order to define the interactions among the chosen factors (Seidl, et al., 2013). Additionally, this matrix is supposed to show how strongly the different variables affect the other variables.
Furthermore, this method should provide information regarding the strength of a variable to change the system and how the variables will react to changes in the system. With the help of this analytical method, the driving factors of the conflict may be found and some of the main elements of this political and ecological conflict can be identified as the most problematic parts of the Chinese energy strategy and policy, which will have to be changed. It will not be possible to explore all of the variables of this conflict, because of the
complexity of the problem, but the chosen 6 variables and the value of these elements should provide a reliable basis for an analysis giving a short but substantial overview of energy- linked environmental situation in China. Statistical information from international databases will provide data for the short overview in numbers about Chinese oil, natural gas, coal, hydroelectric power, nuclear, and renewable energy production and use. Furthermore, a short overview will be given about the environmental and human health situation in numbers.
In this study only Chinese inland energy consumption will be taken into consideration regarding environmental pollution and its impact on the health conditions. The international effect of the Chinese energy consumption and pollution will not be considered in this research. The most recent information and data from the international databases cover the time period between 2010-2019.
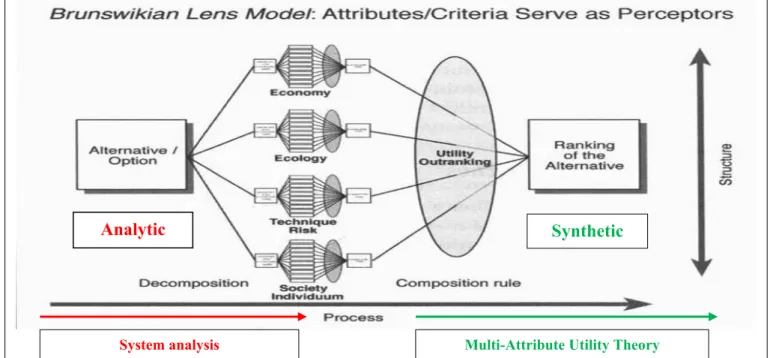
Figure 2. Structure of the System Analysis (SA) & Multi Attribute Utility Theory (MAUT) combination according to Sholz
& Tietje 2002).
Synthetic Analytic
System analysis Multi-Attribute Utility Theory
31
Theoretical framework Sustainable development
The definition of sustainable development was launched by the World Commission on Environment and Development (later WCED) driven by Gro Harlem Brundtland in 1987.
(Seghezzo, 2009) “Sustainable development is development that meets the needs of the present without compromising the ability of future generations to meet their own needs.” It contains two key elements: the concept of ‘needs’, in particular the essential needs of the world’s poor, to which overriding priority should be given; and the idea of limitations imposed by the state of technology and social organization on the environment’s ability to meet present and future needs (WCED, 1987; Wuelser, et al., 2011). The concept of sustainable development was a ‘global objective’
to guide policy formulations orientated to balance the continuously changing economic social and ecological conditions of society. It is often represented with the ‘triple bottom line’ of economy, environment, and society (Seghezzo, 2009). Many different, more complex or specialized versions and approaches have been developed by scientists and international organizations since 1987. The Brundtland concept of SD defined 3 dimensions, namely the economic, social and ecological dimension. The five dimension of sustainability approach consider the space and time factor contrary to the Brundtland conception. However, as it in this study has been enunciated earlier, the analyses will concern mainly the present time with data covering the last decade, and it will not require a detailed analysis over a longer period or discussion of several future scenarios. That is why the time and space dimension has only a limited relevance for this research. According to Seghezzo (2009) the WCED approach has an extremely anthropocentric view, which identifies the welfare of humankind as the ultimate reason of conservation and sustainable exploitation of natural resources. In the case of China, the human health damage reached such an incredible level in the last few years, which justify putting this division on the most important position.
Furthermore, the Brundtland concept’s other contested issue is the overestimation of economy and economic growth (Seghezzo, 2009). As previously mentioned in the problem formulation, China cannot afford any substantial slowdown in its recent economic growth, otherwise the whole Chinese economy together with the social structure will get into a dubious situation. Additionally, the Chinese economic growth caused the rising energy consumption and environmental pollution. However, we can consider the economic growth as a driving force in the environmental conflict, which might bear the source of sustainable solutions by generating economic means for development of renewable energy sources, environmental remediation and strengthening the public health sector.
System Analysis and the Multi- Attribute Utility Theory We can organize the modelling tools on two groups. One of the groups can include the analytic modelling methods, which breaks up the problem into components. The analytical modelling methods are characterizing the system properties and the impacts of variables. We can mention the System
Analysis (later: SA) method in this group. The other group can be the synthetic modelling methods’ group. The aim of these methods is to specify relationships among the variables, weighting their importance and combining their impact within a scenario or form a coherent whole from separate elements. The Multi-Attribute Utility Theory (later: MAUT) belongs to the synthetic modelling group (Stevens, 2014).
The evaluation process should encompass the analytical decomposition with the help of System Analysis and the synthesis with the MAUT (Fig. 2; Sholz & Tietje, 2002). This method has a disadvantage due to substantial subjectivity regarding the measurement of social elements in social- environmental conflicts. If the measurement of the variables is based on subjective decisions, the result of the cross-impact matrix (driven by MAUT) will not be able to provide objective results. However, it is still one of the relatively best methods to measure social-environmental complex conflicts and find its dominant or susceptible variables. (Seidl, et al., 2013).
Analysis and evaluation Definition of variables
As it was mentioned in the theoretical part, the SD has 3 dimensions. and 2 variables from each dimension (totally six variables) will be used for analysis.
1. Environmental dimension
The most important element of this conflict is the unbearable environmental pollution, which is already harmful to the health of the Chinese population. The first variable will be the rate of environmental pollution. Primarily, the rate of water and air pollution will be considered. Data obtained from international organizations is used for the measurements. The other variable will be the rate of renewable energy consumption. This variable was chosen because it has mostly inverse relationship with the first variable. If the rate of renewable energy usage increases, the rate of environmental pollution should decrease. It can be measured through the national total primary energy consumption (Fig. 4).
2. Social dimension
The health condition of the population will be the third variable. This variable will mean the number of premature deaths, which was attributed to air pollution and the number of premature deaths, to which contributed the consumption of unsafe water. The total health expenditure will be the fourth variable. It will be measured as the annual total health expenditures in US dollar (Fig. 6).
3. Economic dimension
Economic growth will be used as the fifth variable. The Chinese GDP per capita will be the indicator of this variable.
The Chinese GDP per capita and the rate of fossil energy consumption in the percentage of the national total primary energy consumption namely coal, oil and natural gas (LNG in the natural gas) have been used for the measurements, taking into consideration even the possible increase of renewable energy according to the strategies outlined in the 13th Five Years Plan.
32
4. Variables in numbers
Environmental pollution in numbers will represent an impressive information. The air and water pollution are the biggest problem in China. According to State Environmental Protection Administration and Miao Hong (2006) the water pollution in China was very serious already in 2005, when more than 70 percent of China's rivers and lakes and over 90% of groundwater resources in the vicinity of major cities were heavily polluted and nationwide more than 300 million people had no access to clean water (Hong, 2006). Air pollution received the biggest international attention, although the degree of the water pollution is almost the same as the air pollution. The World Bank declared that only one percent of the Chinese 560 million urban residents can breathe safe air, according to the EU standards (Thompson, 2013). Fewer than 1% of the 500 largest cities in the PRC meet the air quality standards recommended by the World Health Organisation, and 7 of these cities are ranked among the 10 most polluted cities in the world (Qingfeng & Crooks, 2012).
Figure 3. Total Energy Consumption in China in 2011 (US.
Energy Information Administration, 2014).
The rate of fossil fuel usage in the energy mix was 91% (the coal with 69 %, oil with 18% and the natural gas with 4%) in China (US. Energy Information Administration, 2014).
Figure 4. Primary energy consumption in China from 2010 to 2018 by fuel type in million tons of oil equivalent. The share of coal and oil in the energy mix has only slightly changed between2014and2018 (BP 2019. www.statista.com).
The rate of renewable energy consumption was 7% in 2011, which included the hydroelectric power and the other renewable energy sources together. This number is quite small compared to the total inland energy consumption. The rate of renewables is extremely small compared to the fossil fuels usage (Fig. 3) and the energy mix has not changed significantly between 2014 and 2018, even if the increase in total primary energy consumption can be attributed to the recent development of renewable energy production and natural gas supply (Figure 4).
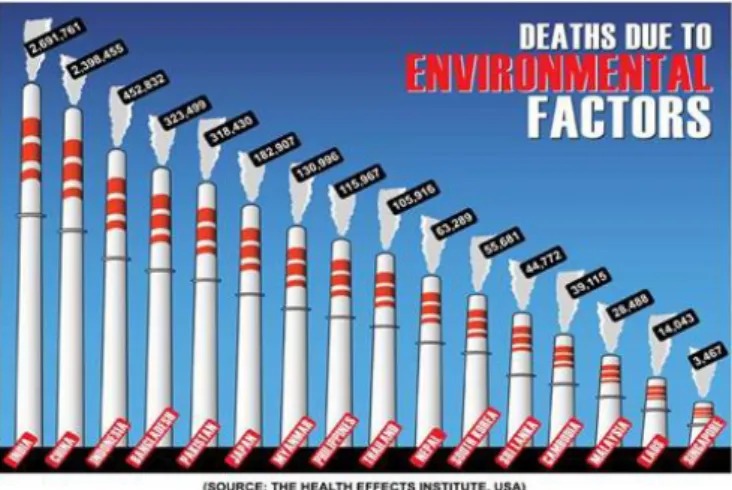
Figure 5. Number of deaths due to Environmental pollution in Asia: India is leading with 2.691,761 cases and China is the second with 2,398,555 cases (Konrad Adenauer Stiftung Media Programme Asia, 2013).
According to WHO approximately the deaths of 2.3 million people were caused by the environmental pollution in 2010.
With this number China was ranked on the 2nd place in Asia.
From the 2.3 million deaths 1.2 million premature deaths was caused by the air pollution in China in 2010, according to the Global Burden of Disease study. Figure 5. shows that 54.922 deaths were caused by the unsafe water in China in 2010. The Ministry of Supervision reports almost 1.700 water pollution accidents in every year (Economy, 2013). Although pollution is mostly attributed to traffic, industry and smog-filled cities, many deaths can be linked to the primitive fuel burning facilities, stoves and old-fashioned generators in rural locations, which is the case in several countries like Pakistan, Afghanistan, India, China and even Nigeria, where such fatalities are high. However, China is taking action to improve the environmental conditions.
A more recent study embracing a period of 27 years between 1990 and 2017 (Zhou et al. 2017) found that the causes of premature deaths on 100,000 inhabitants taking into account the age composition of the population, were age standardised stroke, ischaemic heart disease, lung cancer, chronic obstructive pulmonary disease, and liver cancer in 2017 (Zhou et al. 2019). The disabilities and deaths caused by musculoskeletal disorders, mental health disorders, sense organ diseases, high systolic blood pressure could be attributed to the cumulative effects of urbanisation, stress and often stress-related unhealthy habits (smoking, high-sodium diet), unfavourable demographic changes (ageing population), water pollution and ambient particulate matter
33
pollution (Myers, 2016; Zhou et al. 2019). Most health statistics are all-cause age-standardised, since older people with many years of exposure to adverse environmental factors have worse health conditions and they are more susceptible to acquire the aforementioned diseases than the younger generation.
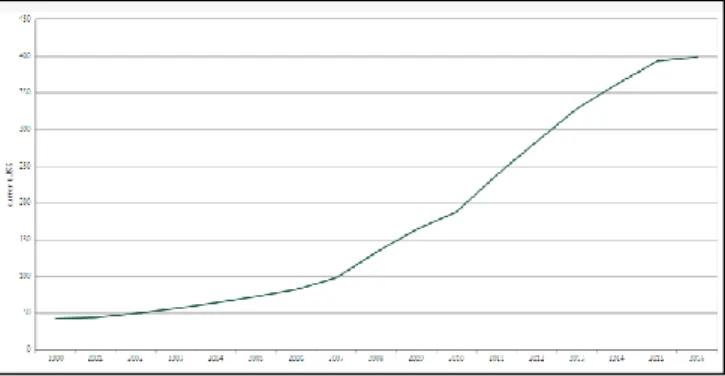
Figure 6. Chinese health expenditure per capita. Source:
World Development Indicators
(https://knoema.com/atlas/China/Health-expenditure-per-capita).
The health expenditure per capita shows current expenditures on health per capita in current US dollars, including all healthcare goods and services consumed during each year.
WHO’s report (2015) shows the annual Chinese health expenditure per capita in US dollar (USD) from 1995 to 2014.
The constantly but slowly growing expenditure rapidly started to rise around 2009. According to more recent data, in 2016 (Fig. 6), the total health expenditure per capita for China was 398 US dollars in 2016. The health expenditure per capita of China grew substantially from 49 to 398 US dollars rising at an increasing annual rate that reached a maximum of 35.85% in 2008 and then decreased to 1.40% in 2016.
Analysis
Cross-impact analysis
Cross-impact analysis can be used to determine the relationships and interactions of different variables. It is based on a matrix in which we analyse the effects of two future situations on each other. We can examine the correlation of each variable with all other variables and their effect on each other. The environmental application of the method can be applied to the study of changes in environmental impacts and the correlations of individual events. (Schlange, 1995). Cross-impact matrix shows the weighted influences between the individual six variables. In the matrix only direct impacts can be measured. The numbers from 1 to 6 along the top row are the same variables as along the left column. The variables have interactions with each other. They will be considered in pairs in a clockwise direction (Stevens, et al., 2005).
The active total’s number will show for us an indication, how strongly the variables affect the rest of the system. We have to add up the numbers in a column. The two highest scores are 13 and 15. These are the most influential variables and if something changes these variables a little bit, the whole system will change soon. Namely, the rate of fossil fuel in the total energy consumption is the most influential and dominant
variable. The second most influential variable is the economic growth per capita (Fig. 7). It is important to emphasize, that the GDP per capita is driven by economic results, production and profit and cannot be regarded as an absolute measure of well-being, which includes even the health conditions and the quality of environment of the population. However, the abovementioned adverse impact of environmental pollution on public health might have been slightly mitigated by the development of the health care sector. The less influential variable is the health expenditures per capita (Fig. 6), which is continuously increasing. Thus, substantial changes must be made in order to cause a little effect in the other variables and in the whole system.
Figure 7. The GDP per capita in China was last recorded at 7755 US dollars in 2018, while in 2010 the GDP per capita was only 4550.5 USD. It means 58.5 % rise within 8 years.
(https://tradingeconomics.com/china/gdp-per-capita).
The highest passive total scores indicate the most reactive variables. It means that the variables with highest passive total score will change markedly, as soon as some change occurs in the system. According to the matrix the most reactive variable is the health condition of the population. The second most reactive variables are the health expenditures (Fig. 6) and the economic growth (Fig. 7). The less reactive variable is the rate of renewable energy sources in the total energy consumption.
Evaluation:
0: No impact (When the A variable does not have or have only a weak effect on the B variable).
1: Weak impact (If a significant change in A will bring only a weak change in B).
2: Medium impact (If A require a lot of changes in order to achieve an approximately equal amount of changes in B).
3: Strong Impact (A little change in A causes a significant change in B; Vester, 2007).
Variables:
1. Rate of environmental pollution 2. Rate of renewable energy sources 3. Health condition of the population 4. Health expenditure per capita 5. Economic growth (GDP per capita) 6. Rate of fossil energy consumption
34
Impact on 1 2 3 4 5 6 Active
total Impact of
1 Rate of environmental pollution
X 1
Small/medium changes of 1st var. doesn’t affect much the 2nd variable Even if the value of 1st var.
is very high, the rate of 2nd var. has not moved significantly in the last 30 yrs.
2 Small changes in 1st var. are not visible in the number of deaths The 1st variable must change a lot to achieve noticeable changes in health situation
2 It has little direct impact.
Need few years for the 4th var.
to follow the 1st var. China has increased the total health expenditures since 2007 but environmental pollution has been going on for 30 years.
1 The rate of environmental pollution has adverse impact on the GDP due to high expenses for environmental protection and remediation.
Not immediate effect, requires more time
1 The 1st var.
must increase in order to get acceptance for reduction of 6th var. which provides 91%
of the energy consumption and promotes economic growth.
7
2 Rate of renewable energy sources
1 The 2nd var.
must increase significantly in order to reduce or affect the 1st variable.
9% of 2nd var.
had no impact on 1st var. in China. It will have a long- term impact.
X 1
The rate of the 2nd var. must increase a lot to gain some improvement in the rate of air pollution.
It does not affect water pollution
0 This has only indirect impact because if 2nd var. increases, later the total health care expenditures will be lower.
2 The rate of 2nd var. affects 5th var., because it means higher expenditure.
The energy from 2nd var. is much more expensive and decreases the 5th var.
2 If the rate of renewable energy sources will increase, and reach size of the 6th var., then fossil energy will not be necessary any more (Figure 3 & 4.)
6
3 Health condition of the population
0 There is an inverse correlation among these variables
0 There is an inverse correlation among these variables
X 3
The health deterioration of the population requires higher health expenditures (Figure 6.)
2 Higher health expenditures and social discontent Decreasing no.
active workers
1 The social dissatisfaction will force to reduce the rate of 6th variable
6
4 Health expenditure per capita
0 With the change of 4th variable, the 1st var. won’t change. Even if we make significant changes and increase the expenditure like China 2005-2012!
0 Changing the 4th variable, the 2nd variable won’t change.
From 2005 the 4th variable increased with 200 % and the rate of renewables in total energy consumption just increased a few percent.
(Fig. 3, 4 & 6)
3 Increasing the 4th variable can help to decrease the 3rd variable.
The Chinese population would be in an even worse situation without healthcare and medicines.
X 2
Increasing the 4th variable is a prerequisite for the growth of the 5th var.
However, the 4th variable reduced the growth rate of 5th variable, since the 4th variable will be paid from 5th variable.
0 The change of 4th variable will not affect the 6th var.
The impact is reciprocal
5
35
The active total’s number will indicate, how strongly the variables affect the rest of the system. We have to add up the numbers in a column. The two highest scores are 13 and 15.
These are the most influential variables and if something change these variables a little bit, the whole system will change soon too. Namely, the rate of fossil fuels energy consumption in the total energy consumption is the most influential and dominant variable. The second most influential variable is the economic growth per capita. The less influential variable is the health expenditures per capita.
It means, that we have to change a lot in order to cause a little effect in the other variables and in the system.
The highest passive total scores indicate the most reactive variables. It means that the variables with highest passive total score will change markedly, as soon as something will happen in the system. According to the matrix the most reactive variable is the health condition of the population. The second most reactive variables are the health expenditures
and the economic growth. The less reactive variable is the rate of renewable energy sources in the total energy mix.
Discussion and reconnection to theories and problem formulation
According to the impact matrix, the variables of the economic division were the most influential. It means that the Brundtland conception was justified from a socio-economic point of view. This research also strengthens the opinion of the Brundtland concept of SD, that the other SD concepts should not underestimate the relevancy and power of the economic division! The pressure of economic growth can throw a country into an ecological catastrophe and cause disastrous conditions in the public health. If we see the most reactive variable, we can understand, that the human health is the most fragile and sensitive element of a system. The health expenditure depends highly from the rate of economic growth. Therefore, both of these variables (health condition of the population and health expenditures) are similarly 5 Economic
growth
3 The 5th var.
was growing with almost the same speed in China than the 1st var. -1st variable was the direct consequence of the 5th var.
1 The 5th var. has only a small effect on the 2nd variable.
With the help of 5th variable, the population will be able to afford to buy more expensive technologies and buy or use more
expensive energy.
3 The growth of 5th variable caused the tragic situation of 3rd variable.
However, if the 5th var.
decreased quickly, the population’s health condition would become even worse.
3 If 5th variable grows, the 4th variable will increase of two reasons:
1. Higher incomes result in increasing spending on health services.
2. Indirect effect, but the 5th var. will cause more pollution and adverse impact on health. The total health expenditures must increase.
X 3
Economic growth has been achieved by using cheap fossil energy:
coal and oil.
Gas is expensive but still cheaper than going over to the
renewables.
The speed of economic growth was proportional to the use of fossil energy.
13
6 Rate of fossil fuels energy consumption
3 The values of 6th variable indicate the increase of the 1st variable The cause of air and water pollution and acid rain from fossil fuel burning.
3 There is inverse relationship between these variables, since they are mostly complementing each other (the value of energy consumption is constant) in the total energy mix. If one increase, the other should decrease.
3 The 6th var.
has direct and strong impact on the 3rd var.
Air pollution which is the main problem in China is caused by fossil fuel burning.
2 Reduced use of 6th var. would not affect the total health expenditures, but the high level of fossil fuel use and pollution will force the population to spend more on health care.
3 The extremely high level of fossil fuel use (91 %) helped the economic growth and the industrial production.
91% of energy sources was much cheaper for China, than for all other countries – a substantial advantage for industries!
X 14
Passive total 7 5 12 10 10 7
36
sensitive and reacts mostly together. If the people do not have enough money, they will not be able to spend on their own health care. We can see how fragile the economic growth from the matrix, and why China has not been ready to touch or modify its well working economic policy until it has reached the unacceptable level of environmental pollution and the catastrophic health conditions of the Chinese population. Thus, the anthropocentrism of the Brundtland conception has also been justified by this research, because the most reactive factor in the whole system is the human health, which depends on economic, social and ecological conditions.
The application and modern adaptation of the Brunswikian Lens Model in this study has been a versatile way to estimate the most probable outcomes of a set of variables, which include environmental, social, cultural, economic and even psychological factors. According to Brunswik (1943), the environment of the organism contains a lot of uncertainties and different probabilities and the adaptation to this probabilistic world requires the use of probabilistic means in order to achieve strategic goals. This "probabilistic functionalism" is gaining increasing attention in several fields related to the economic and social dimensions of applied environmental sciences such as learning, thinking, decision making processes, individual and social perception, communication and the study of curiosity. Brunswik has particularly emphasized the importance of the environment and also created the term of ecological validity. This complex view of ecologically based applied psycho-social research has greatly contributed to the development of stakeholder management conceptions, which constitute one of the cornerstones of modern environmental sociology.
The key to solve the environmental, economic and public health problems is complex. The most important goal is the reduction and the fastest possible out-phasing of fossil energy sources from the energy production. For a transitional period, improving the efficiency of energy production by new flue gas cleaning technologies and carbon sequestration methods can be viable. There are technologies available, some of them were developed as early as about 20 years ago, which can mitigate the adverse environmental effects of fossil fuel burning during the several years long period of out-phasing, by capturing the purified flue gases in biological carbon sequestration systems. One such system is algal biomass production through absorbing the CO2 content of the flue gases from power plants in algal biomass cultures. This biomass is then burned again in power plants suitable for biomass combustion (US DOE-OSTI, 2001). Other, more recently developed technologies include the biodiesel and bio-ethanol production from algal biomass (Ashokkumar et al. 2015), or even using the produced algae as animal food.
Simultaneously, measures must be taken such as increasing the rate of renewables [China has vast resources of hydroelectric power, geothermal energy and solar energy (PV) and biomass production], improving waste management and introducing environmentally acceptable waste-to-energy programs to achieve a zero-waste goal. The well-functioning health care and social security system are other prerequisites for the social and economic sustainability. In fact, the key
solution is the establishment of an efficient, all-inclusive circular economy based on the conservation and sustainable use of ecosystem services (Némethy & Kőmíves, 2016).
The health and the demographic composition of the population are key issues not only regarding the necessary development of the health care sector through the vast increase of total healthcare expenditures and it’s short – term economic consequences, but these factors concern even the resilience of society in case of crises caused by natural disasters or pandemics, such as the recent COVID-19 pandemic. Despite of the relatively well-developed health care sector and the fast reaction of the responsible authorities, a vast number of people have struggled to access adequate treatment during the last 2 months, but thanks to the efficiency of the authorities, it was possible to control the epidemic and prevent the occurrence of even larger numbers of deaths. In the recovery phase, some risk factors that might be linked to COVID-19 severity, such as tobacco use, cardio- vascular diseases, hypertension, respiratory diseases must be dealt with (WHO, 2020). The health conditions of the general public are crucial, since people with weak immune systems and/or suffering from the above mentioned diseases will be more susceptible and less resistant to infections.
Conclusions
Although the economic growth is most influential and in the same time the one of the most reactive variables, which requires increasing energy supply in order to be maintained.
The main conflict here is the environmental price of this growth, which has an adverse impact not only the natural environment, but even on public health, which in turn will require a constantly increasing level of health care expenditures, reducing herewith the rate of economic growth.
It is obvious, that an immediate “switch over” from this heavily fossil fuel-based (mostly coal and oil) energy production to renewable energy sources is both economically and socially impossible even if it would be beneficial for the environment. However, the aforementioned technologies available for the mitigation of the adverse environmental impact of fossil fuel burning might be suitable to manage the energy need of society during the period of transition from fossil to renewable energy.
Very important factor is the demographic composition of the population. The Chinese population is aging, and old people require more health care services and they are also less resistant to diseases directly related to environmental pollution. Therefore, statistics always have to take into consideration the average age of the test group.
From this study it is obvious, that too fast economic growth based entirely on quickly available, polluting fossil energy resources and without environmental responsibility and the negligence of the carrying capacity of ecosystem services is not sustainable. The solution is the out-phasing of fossil energy and the establishment of ecologically sustainable society based on circular economy and renewable energy resources.
37
References
Ashokkumar, V., Salamb, Z., Tiwari, O.N., Chinnasamy, S., Mohammed, S., Ani, F.N. (2015): An integrated approach for biodiesel and bioethanol production from Scenedesmus bijugatus cultivated in a vertical tubular photobioreactor.
Energy Conversion and Management, Volume 101, Pp. 778- 786;
https://doi.org/10.1016/j.enconman.2015.06.006
Barchfield, J. (2010): China Surpasses US as World's Top Energy Consumer.Associated Press, 20th of July 2010.
https://phys.org/news/2010-07-china-surpasses-world- energy-consumer.html
Bilgen, S. (2014): Structure and environmental impact of global energy consumption. Renew Sustain Energy Rev.
38:890 – 902.
https://doi.org/10.1016/j.rser.2014.07.004
Brandt, L. & Rawski, T. G. (2008): China's Great Economic Transformation. Cambridge University Press; 1 edition.
ISBN-10: 0521712904; ISBN-13: 978-0521712903
Brunswik, E. (1943): Organismic achievement and environmental probability. Psychological Review, 50(3), 255–272.
https://doi.org/10.1037/h0060889
China Greentech Initiative (2013): The China Greentech Report 2013, Hong Kong: Novelty Marketing & Design Solution Co. Ltd.
http://www.neec.no/sites/default/files/reports/China%20Gre entech%20Report%202013.pdf
Dong, K.Y., Sun, R-J., Li, H. & Jiang H-D. (2017): A review of China’s energy consumption structure and outlook based on a long-range energy alternatives modeling tool. Pet. Sci.
(2017) 14:214–227;
https://doi.org/10.1007/s12182-016-0136-z
Economy, E. C. (2013): China's Water Pollution Crisis. The Diplomata, 22. January.
https://thediplomat.com/2013/01/forget-air-pollution-chinas- has-a-water-problem/
Frazão, T., Camilo, D., Cabral, E. & Souza, R.P. (2018):
Multicriteria decision analysis (MCDA) in health care: a systematic review of the main characteristics and methodological steps. BMC Med Inform Decis Mak 18, 90 (2018).
https://doi.org/10.1186/s12911-018-0663-1
Hong, M. (2006): Embassy of the People Republic of China in the United Kingdom of the Great Britain and Norther Ireland. [Online] Available at:
http://www.chinese-
embassy.org.uk/eng/zt/Features/t274443.htm
IEEJ - The Institute of Energy Economics, Japan (2018):
China Energy Outlook 2050. CNPC Economics and Technology Research Institute (ETRI)
https://eneken.ieej.or.jp/data/8192.pdf
Institute for Health Metrics and Evaluation at the University of Washington, 2010. The Global Burden of Disease Study 2010 (GBD 2010).
www.thelancet.com
James, S.L., Abate, D., Abate, K.H., et al. (2018): Global, regional, and national incidence, prevalence, and years lived with disability for 354 diseases and injuries for 195 countries and territories, 1990–2017: a systematic analysis for the Global Burden of Disease Study. Lancet. 392(10159):1789- 1858.
https://doi.org/10.1016/S0140-6736(18)32279-7
Koleski, K. (2017): The 13th Five-Year Plan (FYP) (2016–
2020). United States – China Economic and Security Review Commission, Staff Research Report, February 14, 2017 https://www.uscc.gov/sites/default/files/Research/The%2013 th%20Five-
Year%20Plan_Final_2.14.17_Updated%20(002).pdf
Konrad Adenauer Stiftung Media Programme Asia (2013):
Climate Change in Asia.
http://ejap.org/environmental-issues-in-asia/health- issues.html
Liu, W., Xu, Z. and Yang, T. (2018): Health Effects of Air Pollution in China. Int. J. Environ. Res. Public Health 2018, 15, 1471;
https://doi,org/10.3390/ijerph15071471
Myers, J. (2016): China’s working-age population will fall 23% by 2050. World Economic Forum, 25th of July 2016.
https://www.weforum.org/agenda/2016/07/china-working- ageing-population/
Némethy, S., Komives, T. (2016): On ecocycles and circular economy. Ecocycles, the official online journal of European Ecocycles Society. 2:1, pp. 44-46
https://doi.org/10.19040/ecocycles.v2i1.55
Qingfeng, Z. and Crooks, R. (2012): Toward an environmentally sustainable future: Country environmental analysis of the People’s Republic of China, Philippines: Asian Development Bank. ISBN 978-92-9092-712-9 (Print), 978- 92-9092-713-6 (PDF); Publication Stock No. RPT113974 Schlange, L. E. (1995): Linking futures research methodologies. Futures, 27. (8.), p. 826.
Seghezzo, L. (2009): The five dimensions of sustainability.
Enviromental Politics, 4(18), pp. 539-540.
https://doi.org/10.1080/09644010903063669
Seidl, R., Brand, F.S., Stauffacher, M., Krütli, P., Le, Q.B., Spörri, A., Meylan, G., Moser, C., Berger González, M.,
38
Scholz, R.W. (2013): Science with Society in the Anthropocene; Ambio. 42(1): 5–12. Online, 2013-01-04.
https://doi.org/10.1007/s13280-012-0363-5
Sholz, R. W. & Tietje, O. (2002): Embedded Case Study Methods. Zurich: SAGE Publications.
https://dx.doi.org/10.4135/9781412984027
Stevens, R. (2014): Modelling Tools. Edition by University of Gothenburg. Lecture notes.
Stevens, R. L., Jankowski, M. & Larsson, O. (2005): Multi- Criteria Evaluation of Sedimentation in the Gothenburg Archipelago. Gothenburg, Sweden. Department of Earth Sciences, University of Gothenburg.
Thompson, T. N. (2013): Choking on China - The Superpower That Is Poisoning the World. Foreign Affairs.
http://www.foreignaffairs.com/articles/139141/thomas-n- thompson/choking-on-china
US. Energy Information Administration (2014): Annual Energy Outlook 2014 - With Projections to 2040 - April 2014 - China.
www.eia.gov/forecasts/aeo
U.S. DOE-OSTI (Department of Energy Office of Scientific and Technical Information, 2001): Microalgae Production from Power Plant Flue Gas: Environmental Implications on a Life Cycle Basis. Technical Report.
https://doi.org/10.2172/783405
Vester, F. (2007): The art of interconnected thinking.
München: MCB Publishing House.
WCED, (1987): Our common future, Oxford: Oxford University Press.
WHO (2020): China shows COVID-19 responses must be tailored to the local context WHO, 03-04-2020.
http://www.euro.who.int/en/health-topics/health-
emergencies/coronavirus-covid-19/news/news/2020/4/china-
shows-covid-19-responses-must-be-tailored-to-the-local- context
Wood, J. (2019): China’s pollution is so bad it’s blocking sunlight from solar panels. World Economic Forum, 05 Aug.
2019.
https://www.weforum.org/agenda/2019/08/china-air- pollution-blocks-solar-panels-green-energy/
World Bank, 2014.
https://www.google.com/publicdata/explore?ds=d5bncppjof 8f9_&met_y=ny_gdp_pcap_cd&hl=en&dl=en&idim=countr y:CHN:MYS#!ctype=l&strail=false&bcs=d&nselm=h&met _y=ny_gdp_pcap_cd&scale_y=lin&ind_y=false&rdim=regi on&idim=country:CHN&ifdim=region&hl=en_US&dl=en&
ind
Wuelser, G., Phol, C. & Hadorn, G. H. (2011): Structuring complexity for tailoring research contributions to sustainable development: framework. Integrated Research System for Sustainability Science. Sustainability Science 7:81-93 https://doi.org/10.1007/s11625-011-0143-3
Xing, L. (2008): Eyeing on the Arctic Region: China’s Search for Energy and Maritime Transportation Security, Aalborg, Denmark
Xu, B. (2014): China's Enviromental Crisis, Beijing: Council on Foreign Relation.
https://www.cfr.org/backgrounder/chinas-environmental- crisis
Zhou, M., Wang, H., Zeng, X., Yin, P., Zhu, Y., Chen, W., Li, X., Wang, L., Wang, Li., Liu, Y., Liu, J., Zhang, M., Qi, J., Yu, S., Afshin, A., Gakidou, E., Glenn, S., Krish, S.V., Miller- Petrie, M.K., Mountjoy-Venning, W.C., Mullany, E.C., Redford, S.B., Liu, H., Naghavi, M., Hay, S.I., Wang, L., Murray, C.J.L., Liang, X. (2019): Mortality, morbidity, and risk factors in China and its provinces, 1990–2017: a systematic analysis for the Global Burden of Disease Study 2017. The Lancet, Vol 394 September 28, 2019.
www.thelancet.com
© 2020 by the author. This article is an open access article distributed under the terms and conditions of the Creative Commons Attribution (CC BY) license (http://creativecommons.org/licenses/by/4.0/).