Research Article
Vessel Wall-Derived Mesenchymal Stromal Cells Share Similar Differentiation Potential and Immunomodulatory Properties with Bone Marrow-Derived Stromal Cells
Zoltán Veréb ,1,2,3Anett Mázló,3,4Attila Szabó,5Szilárd Póliska,6Attila Kiss,7
Krisztina Litauszky,8Gábor Koncz ,3Zoltán Boda,7Éva Rajnavölgyi,3and Attila Bácsi 3
1Regenerative Medicine and Cellular Pharmacology Research Laboratory, Department of Dermatology and Allergology, University of Szeged, Szeged, Hungary
2Research Institute of Translational Biomedicine, Department of Dermatology and Allergology, University of Szeged, Szeged, Hungary
3Department of Immunology, Faculty of Medicine, University of Debrecen, Debrecen, Hungary
4Doctoral School of Molecular Cellular and Immune Biology, University of Debrecen, Debrecen, Hungary
5NORMENT, Centre of Excellence (CoE), Institute of Clinical Medicine, University of Oslo, and Division of Mental Health and Addiction, Oslo University Hospital, Oslo, Norway
6Genomic Medicine and Bioinformatics Core Facility, Department of Biochemistry and Molecular Biology, Faculty of Medicine, University of Debrecen, Debrecen, Hungary
72nd Department of Internal Medicine, Faculty of Medicine, University of Debrecen, Debrecen, Hungary
8Department of Vascular Surgery, Faculty of Medicine, University of Debrecen, Debrecen, Hungary
Correspondence should be addressed to Attila Bácsi; etele@med.unideb.hu
Received 2 July 2020; Revised 4 September 2020; Accepted 9 October 2020; Published 21 October 2020 Academic Editor: Oswaldo Keith Okamoto
Copyright © 2020 Zoltán Veréb et al. This is an open access article distributed under the Creative Commons Attribution License, which permits unrestricted use, distribution, and reproduction in any medium, provided the original work is properly cited.
Purpose. This study is aimed at investigating the phenotype, differentiation potential, immunomodulatory properties, and responsiveness of saphenous vein vessel wall-derived mesenchymal stromal cells (SV-MSCs) to various TLR ligands and proinflammatory cytokines, as well as comparing their features to those of their bone marrow-derived counterparts (BM-MSCs).Methods. SV-MSCs were isolated by enzymatic digestion of the saphenous vein vessel wall. Phenotype analysis was carried out byflow cytometry and microscopy, whereas adipogenic, chondrogenic, and osteogenic differentiation potentials were tested in in vitroassays. For comparative analysis, the expression of different stemness, proliferation, and differentiation-related genes was determined by Affymetrix gene array. To compare the immunomodulatory properties of SV-MSCs and BM-MSCs, mixed lymphocyte reaction was applied. To investigate their responses to various activating stimuli, MSCs were treated with TLR ligands (LPS, PolyI:C) or proinflammatory cytokines (TNFα, IL- 1β, IFNγ), and the expression of various early innate immune response-related genes was assessed by qPCR, while secretion of selected cytokines and chemokines was measured by ELISA.Results. The isolated SV-MSCs were able to differentiate into bone, fat, and cartilage cells/directionin vitro. SV-MSCs expressed the most important MSC markers (CD29, CD44, CD73, CD90, and CD105) and shared almost identical phenotypic characteristics with BM-MSCs. Their gene expression pattern and activation pathways were close to those of BM-MSCs. SV-MSCs showed better immunosuppressive activity inhibiting phytohemagglutinin-induced T lymphocyte proliferation in vitro than BM-MSCs. Cellular responses to treatments mimicking inflammatory conditions were comparable in the bone marrow- and saphenous vein-derived MSCs. Namely, similar to BM-MSCs, SV-MSCs secreted increased amount of IL-6 and IL-8 after 12- or 24-hour treatment with LPS, PolyI:C, TNFα, or IL-1β, compared to untreated controls.
Interestingly, a different CXCL-10/IP-10 secretion pattern could be observed under inflammatory conditions in the two types of MSCs.Conclusion. Based on our results, cells isolated from saphenous vein vessel wall fulfilled the ISCT’s (International Society for Cellular Therapy) criteria for multipotent mesenchymal stromal cells, and no significant differences in the phenotype, gene expression pattern, and responsiveness to inflammatory stimuli could be observed between BM-MSCs and SV-MSCs, while the latter cells have more potent immunosuppressive activityin vitro. Further functional assays have to be performed to reveal whether SV-MSCs could be useful for certain regenerative therapeutic applications or tissue engineering purposes.
Volume 2020, Article ID 8847038, 16 pages https://doi.org/10.1155/2020/8847038
1. Introduction
Regeneration of blood vessels is essential for the homeostasis of vasculature as well as in the restoration of various forms of tissue injury. However, during inflammation or trauma, the endothelial layer of the vessels has limited regeneration potential. Furthermore, in many cases, the endothelium itself is responsible for maintaining the inflammation, which could lead to vessel malfunctions and tissue damage [1]. The remodeling of the vasculature is an intricately controlled col- laboration among stem/progenitor cells, immune cells, and the residual cells of the vessel wall as well [2, 3]. This process is balanced by proangiogenic and antiangiogenic factors secreted by the cells mentioned above, and the vessels could be regenerated by circulating stem cells, stromal cells, endo- thelial progenitor cells, and vessel wall- or endothelium- related progenitor cells in the subendothelial tissue [2–4]. Var- ious cell types and rare cell populations have the properties to differentiate to endothelial cells or to support the vasculogenic processes [5]; however, resident vascular stem/progenitor and stromal cells are thought to be a dominant subclass of the vas- cular wall cell population involved in vascular homeostasis, repair, and pathological processes [3, 6–13]. Mesenchymal stromal cells (MSCs) werefirst isolated from the bone mar- row [14, 15], but over the last decades, cells with multilineage differentiation potential were also identified in many other organs and tissues, especially within the perivascular area of large vessels [16–18]. MSCs play a key role in the mainte- nance of tissue integrity and homeostasis due to their differ- entiation potential into another cell types and their immunomodulatory capacity as well. However, responses of MSCs to microbial stimuli, such as TLR ligands, or to proin- flammatory cytokines are controversial topics, of which the details are yet to be elucidated.
In this study, we made an extended comparison of saphe- nous vein vessel wall-derived mesenchymal stem cells (SV- MSCs) and bone marrow-derived mesenchymal stem cells (BM-MSCs) regarding their phenotype, differentiation poten- tial, immunomodulatory properties, and responsiveness to various activating stimuli.
2. Materials and Methods
2.1. Bone Marrow, Saphenous Vein, and Umbilical Cord Samples. Collections of bone marrow, umbilical cord, and saphenous vein samples complied with the directive of the Helsinki Declaration were approved by the institutional eth- ical review board (Medical Research Council) of the Medical and Health Science Center of the University of Debrecen (Ethical protocol numbers: UD MHSC REC/IEC No. 2754- 2008, OSTRAT/1210-1/2008/OSTR). Tissue samples were collected corresponding to the EU Member States’Directive 2004/23/EC on tissue isolation [19].
For the isolation of BM-MSCs, approximately 10 ml of bone marrow aspirate was observed from the donors, which were diluted with saline in 1 : 3 ratio. The mononuclear cells were recovered by Ficoll Histopaque (Amersham Biosci- ences, Uppsala, Sweden) density gradient centrifugation.
The number of live cells was determined by Trypan blue
exclusion assay. Bone marrow nucleated cells were plated in 25 cm2flasks at a density of2 × 105living cells/cm2and cul- tured in DMEM-LG medium (DMEM with 1 g/L glucose, Gibco/Invitrogen, London, UK), supplemented with 10%
FSC and 1% Antibiotic-Antimycotic Solution (PAA Labora- tories GmbH, Pasching, Austria). After 3-4 days, the nonad- herent cells were removed, and the cultures were reefed with fresh medium. Thereafter, the cultures were fed every 3–4 days. When cells reached confluence, they were passaged (P1) after 0.025% trypsin-EDTA (both Sigma-Aldrich, Buda- pest, Hungary) application and replated into new 25 cm2 flasks. For positive BM-MSC control, MSCs from bone mar- row were purchased from PromoCell (Heidelberg, Germany) and cultured under the same conditions. At passage P5, phe- notypic analyses by flow cytometry,in vitro differentiation assays, and mycoplasma tests (Lonza, Basel, Switzerland) were performed. Cells positive for mycoplasma were excluded from the experiments.
Saphenous vein samples were collected from saphenec- tomies. The samples were collected and transported in ice cold PBS and processed within 4 hours. The vein was cleaned of adipose or connective tissue and then cut into small pieces.
The segments were washed in PBS and then enzymatically digested by 0.2 mg/ml collagenase type XI (Sigma-Aldrich) dissolved in DMEM-LG medium for 60 minutes at 37°C.
Cells were centrifuged at 1000 rpm for 20 minutes and washed by DMEM-LG medium. After two washing steps, cells were plated and cultured as described for BM-MSC.
The isolation and in vitro culture of human umbilical vein endothelial cells (HUVECs) were described elsewhere [20]. Briefly, HUVEC was removed from the umbilical cord with 1% collagenase type XI (Sigma-Aldrich) digestion and cultured in M199 medium (Sigma-Aldrich) supplemented with 20% FCS (Gibco, London, UK), 1% Antibiotic- Antimycotic Solution (PAA), and 1% L-glutamine (Gibco), in CO2incubator at 37°C. After 4-5 days of culturing, when cells reached confluence, they were trypsinized and inocu- lated into new culture dishes. After 3 passages, the cell mono- layers, which reached up to 70-80% confluence, were used for the experiments.
2.2. Flow Cytometry and Immunochemistry.A multiparame- ter analysis of the surface antigen expression of different MSCs, an HUVECs was performed by three-color flow cytometry using differentfluorochrome-conjugated antibod- ies: CD34, CD44, CD45, CD49f, CD73, CD106, CD144, and CD147 (all from BD Biosciences, San Jose, CA, USA); CD49a (Biolegend, San Diego, CA, USA), CD14, CD29, CD31, CD36, CD47 CD49b, CD54, CD56, CD69, CD90, CD104, CD105, CD117, CD146, CD166, CXCR4, HLA-DR, PDGFRb, and VEGFR2 (all from R&D Systems, Minneapo- lis, MN, USA); and CD133 (Miltenyi Biotech, Gladbach, Ger- many). After harvesting the cells with 0.025% trypsin-EDTA, cells were washed with normal medium and then twice with FACS buffer. Cells were incubated with antibodies according the manufacturers’ protocol on ice for 30 min then washed again with FACS buffer and fixed in 1% paraformaldehyde (PFA)/PBS and analyzed within 1 day. Samples were mea- sured by a FACSCalibur flow cytometer (BD Biosciences
Immunocytometry Systems, Franklin Lakes, NJ, USA), and data were analyzed using the FlowJo software (TreeStar, Ash- land, OR, USA). Results were expressed as means of positive cellsð%Þ± SEM. For immunohistochemistry studies, cell cultures werefixed in 4% PFA; then, samples were labeled after washing the cells three times in PBS with primary anti- bodies against iNOS (Calbiochem/Merck, Merck Millipore, Darmstadt, Germany), von Willebrand factor (R&D Sys- tems), and vimentin (Abcam, Cambridge, UK). Cell stain- ings were visualized with NorthernLights fluorochrome- conjugated secondary antibodies (R&D Systems). Actinfila- ments were stained with phalloidin-TRITC (Sigma-Aldrich).
Nuclei were labeled with Hoechst 33342 (Invitrogen, Carls- bad, CA, USA) samples mounted with mounting medium- containing Mowiol (Merck) and glycerol in PBS and exam- ined under an Olympus IX81 microscope equipped with a Hamamatsu Orca2 camera.
2.3. In Vitro Differentiation Assays. Adipogenic, chondro- genic, and osteogenic differentiations of MSC were performed by using Gibco’s StemPro® Adipogenesis, Osteogenesis, and Chondrogenesis Differentiation Kits (Gibco). All differentia- tions were evaluated as per the manufacture’s guide.
2.4. RNA Isolation, cDNA Synthesis, QPCR, and Microarray Data Analysis. Total RNA was isolated by TRIzol reagent (Invitrogen). 1.5-2μg of total RNA was reverse transcribed using SuperScript II RNase H reverse transcriptase (Invitro- gen) and Oligo(dT)15 primers (Promega, Madison, WI, USA). Gene-specific TaqMan assays (Applied Biosystems) were used to perform QPCR in afinal volume of 25μl in trip- licates using AmpliTaq DNA polymerase and ABI Prism 7900HT real-time PCR instrument (Applied Biosystems).
Amplification of 36B4 and/or cyclophylin was used as nor- malizing controls. Cycle threshold values (Ct) were deter- mined using the SDS 2.1 software (Applied Biosystems).
Constant threshold values were set for each gene throughout the study. The sequences of the primers and probes are avail- able upon request.
To compare the gene expression profiles of different MSCs, Affymetrix GeneChip Human Gene 1.0 ST Arrays (Affymetrix, Santa Clara, CA, USA) were used as described previously [21]. Based on the literature, stem/stromal cell- related genes were selected, and statistical analysis was per- formed (Oneway ANOVA with Tukey post hoc test and Benjamini-Hochberg FDR) to calculate p value and fold change. To identify the relationships between the selected genes, the Ingenuity Pathway Analysis (IPA, Ingenuity Sys- tems, Redwood City, CA, USA) was used. Excel datasheets containing gene IDs with the assigned gene expression values were uploaded into the program. The Ingenuity Pathways Knowledge Base (IPKB) provided all known functions and interactions which were published in the literature. For the representation of the relationships between the genes, the
“Pathway Designer”tool of the IPA software was used.
2.5. Mixed Lymphocyte Reaction and Mitogen-Induced Cell Proliferation.Peripheral blood mononuclear cells (PBMCs) were isolated by a Ficoll gradient centrifugation (Amersham
Biosciences). Prior to the test, 104and 105MSCs were placed in the cell culture plates, and nonadherent cells were removed by a gentle wash step. PBMCs required for the MLR test (1 × 10⁶) were added 24 hours later. Mitogen-activated T lymphocyte proliferation was induced by addition of conca- navalin A (ConA) or phytohemagglutinin (PHA, both from Sigma-Aldrich) at a final concentration of 10μg/ml and 1μg/ml, respectively, to the MSC-PBMC cocultures. On day three, proliferation was detected by a BrDU colorimet- ric assay directly in the cell culture plate according to the manufacturer’s instructions (Roche, Budapest, Hungary).
In control experiments, MSCs and PBMCs were cultured together or separately with and without mitogenic activa- tion. To compare the immunosuppressive capacity of SV- MSCs and BM-MSCs, the proliferation of mitogen- activated PBMCs (OD values, BrdU incorporation) was taken as value 1, and changes in BrdU incorporation caused by MSCs were compared.
2.6. In Vitro Activation of MSC. To investigate the role of TLR ligands and proinflammatory cytokines in MSCs, cells were plated to 24-well plates at5 × 104cell density and then incubated with 100 ng/ml LPS (Sigma-Aldrich), 25μg/ml PolyI:C (InvivoGen, San Diego, CA, USA), 100 ng/ml TNFα, 10 ng/ml IFNγ, or 10 ng/ml IL-1β (all from Preprotech, Rocky Hill, NJ, USA). After the incubation, the supernatant was harvested and kept on -20°C until measurement. For qPCR measurements, cells were plated to 25 cm2flasks and treated as mentioned above.
2.7. Measurement of Cytokine Secretion. Concentrations of secreted IL-6 cytokine as well as IL-8 and CXCL-10/IP-10 chemokines were measured using OptEIA kits (BD Biosci- ences) according to the manufacturer’s protocol. Cell culture media were used as blank samples.
2.8. Statistical Analysis.The Statistica 7.0 software (StatSoft Inc., Tulsa, OK, USA) was used for the statistical analyses.
Normality of distribution of data was assessed by Kolmogorov-Smirnov and Lilliefors tests. Nonnormally dis- tributed parameters were transformed logarithmically to cor- rect their skewed distributions. The R software was used for hierarchical clustering. Each experiment was performed at least three times, and each sample was tested in triplicate.
Data are expressed asmean ± SDor SEM. Statistically signif- icant difference was determined with two-way ANOVA anal- ysis when there were more than two groups; for analysis between two groups, paired Studentt-test was used. Signifi- cance level was set to 0.95; p values less than 0.05 (∗p< 0:05, ∗∗p< 0:01, ∗∗∗p< 0:001) were considered significant.
3. Results
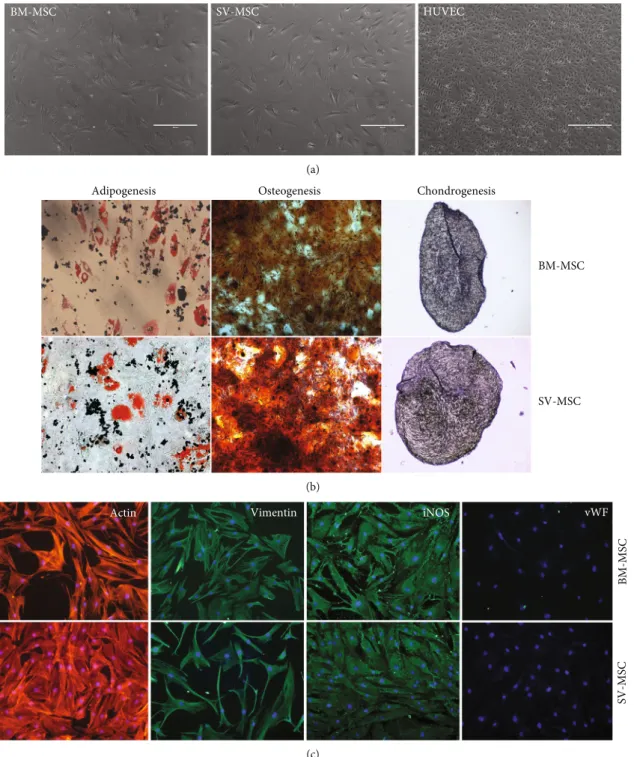
3.1. Morphology, Differentiation Potential, and Phenotype of SV-MSCs.MSCs isolated from saphenous vein showed simi- lar morphology to bone marrow-derived MSCs (Figure 1(a)).
The cultured cells never formed a cobblestone pattern, and their size was much larger than that of endothelial cells (HUVECs), which were used as vein endothelial cell controls
in our experiments (Figure 1(a)). After 2-3 passages on adherent surface, the cells achieved uniform, fibroblast-like morphology, and these cells could be propagated at least for 15 passages without further morphological changes. An MSC type cell shouldfit the criteria defined by the Mesenchy- mal and Tissue Stem Cell Committee of the International Society for Cellular Therapy (ISCT) regarding plastic adher-
ence, differentiation potential, and expression of cell surface markers [22]. In the following experiments, it was examined whether the SV-MSC cultures could be differentiated toward canonical mesodermal (adipogenic, osteogenic, chondro- genic) directions. Bone marrow-derived MSCs and SV- MSCs were differentiated in vitrousing adipogenic, osteo- genic, and chondrogenic induction media. Following three
BM-MSC SV-MSC HUVEC
(a)
BM-MSC
SV-MSC
Adipogenesis Osteogenesis Chondrogenesis
(b) Vimentin iNOS
Actin vWF
BM-MSCSV-MSC
(c)
Figure1: Comparison of morphology and multilineage differentiation potential of vessel wall- and bone marrow-derived MSCs.(a) After passage 5, the isolated MSC populations derived from bone marrow (BM) or SV and human umbilical cord vein (HUVEC) exhibited spindle-shaped morphology. (b) BM- and SV-derived MSCs exhibited the capability to differentiate into the three canonical differentiation pathways, such as fat, bone, and cartilage. (c) Cytoskeletal actin labeled by phalloidin-TRITC, vimentin, and iNOS by rabbit monoclonal antibody, visualized by anti-rabbit conjugated with NorthernLights493. Nuclei stained with Hoechst. Original magnification:×200. Data is representative of four experiments.
weeks of adipogenic differentiation induction, a large num- ber of the SV-MSCs and BM-MSCs showed oil red positive staining, a characteristic for the adipocyte phenotype (Figure 1(b)). In parallel cell cultures, dense calcium deposits were detected after osteogenic differentiation (Figure 1(b)).
In sections made from chondrogenic mass culture after 3 weeks of differentiation, metachromasy was observed upon toluidine-blue staining (Figure 1(b)). Both BM-MSC and SV-MSC cultures were positive for vimentin and iNOS;
however, none of the cultures showed von Willebrand fac- tor positivity, indicating the absence of endothelial cell contamination (Figure 1(c)).
For a detailed characterization, we compared the expres- sion of cell surface markers on BM-MSCs and SV-MSCs by flow cytometry. As documented in Table 1, within the hema- topoietic markers, no expression of CD34, CD45, CD69, CD133, and the CXCL12 receptor CXCR4 could be detected in the mesenchymal stromal cell cultures. A very small per- centage of SV-MSCs was positive for CD117/c-kit (0:02 ± 0:02%), while none of the BM-MSCs expressed this marker. Neither BM-MSCs nor SV-MSCs expressed HLA- DR antigen-presenting molecule. Due to the possibility of endothelial contamination in SV-SMC cultures, we also investigated the expression of endothelial specific markers.
CD31/PECAM, which makes up a large portion of endothe- lial cells, was absent both in the bone marrow- and saphe- nous vein-derived MSC cultures. The VEGFR2/KDR expression was very low in HUVEC cultures and was totally absent in MSC cultures. The expression of CD104/integrinβ4 was more typical for the endothelial cells; however, it was also expressed on MSCs. The percentage of CD144/VE-Cadherin positive cells in SV-MSC cultures was in between those of endothelial cells and BM-MSCs (Table 1). Any cell that is described as mesenchymal stromal cell mustfit the criteria defined by ISCT. All the expected markers such as CD73 (ecto-5′-nucleotidase), CD90 (Thy-1), and CD105 (endoglin) could be detected both on BM-MSCs and SV-MSCs. Although CD73 and CD105 were also expressed by endothelial cells, the ratio of CD90 expressing cells was low in the HUVEC cultures (2:86 ± 1:55%), which distanced them from mesenchymal stromal cell identity. No statistically significant differences were found in the CD147 (neurothelin) and PDGFRβexpres- sion among the three cell types. None of the ISCT defined markers is exclusively MSC specific; therefore, we further investigated the expression of integrins and other cell adhesion molecules (CAMs), which determine the attachment and the fate of the cells within the tissues. Only the percentage of the melanoma cell adhesion molecule (CD146/MCAM) positive cells was found to be significantly different in bone marrow- (77:54 ± 5:14%) and saphenous vein-derived MSC cultures (7:09 ± 6:56%). Besides CD146, the expression of CD54/inter- cellular adhesion molecule 1 (ICAM-1), CD166/activated leu- kocyte cell adhesion molecule (ALCAM), CD56/neural cell adhesion molecule (NCAM), and CD44/homing-associated cell adhesion molecule (H-CAM) could be detected in the cell cultures; however, no significant differences were found in their expression. The expression of CD29/integrin (Itg) β1 and CD49a/Itg α1 was similar in BM-MSC, SV-MSC, and HUVEC cultures. In contrast, CD49b/Itg α2 was expressed
at a lower level on the surface of vessel wall-derived MSCs, and the difference was found to be significant compared to HUVECs (p= 0:0186), but it was not significant compared to BM-MSCs. The CD49f/Itg α6 is mostly expressed by smooth muscle stromal cells,fibroblasts, and epithelial cells.
MSCs isolated from either bone marrow or saphenous vein vessel wall did not show CD49f positivity (Table 1).
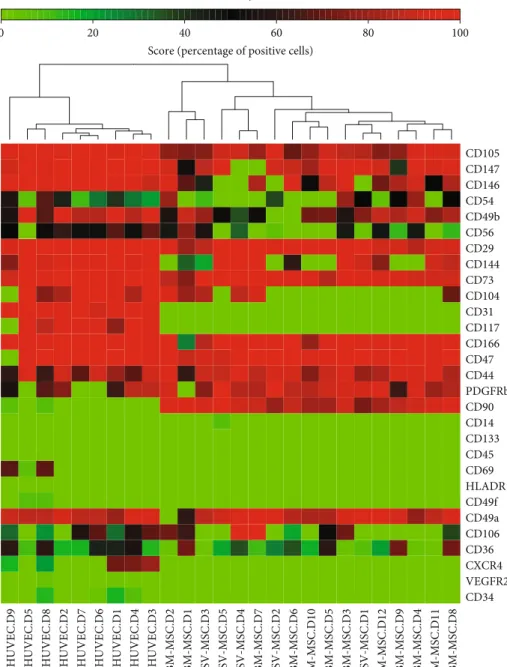
Using a cluster analysis on the expression of the above surface markers in the three cell types, we found a clear divi- sion of the endothelial cells from the mesenchymal stromal cells (Figure 2). Results on SV-MSCs from different donors integrated well into the BM-MSC cluster despite interdonor variability. These observations indicate that our isolation technique with the applied phenotype analysis is suitable to detect mesenchymal stromal cells isolated from vessel wall (Figure 2).
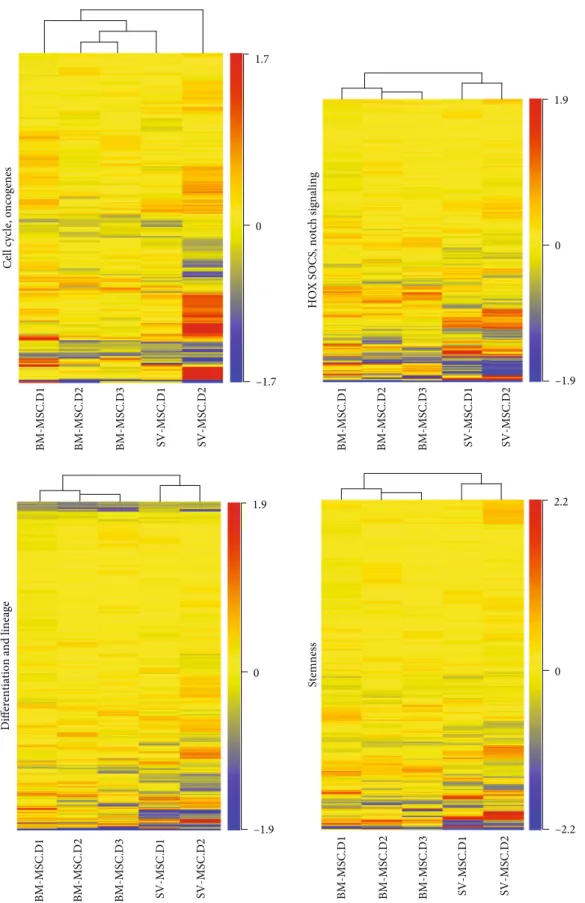
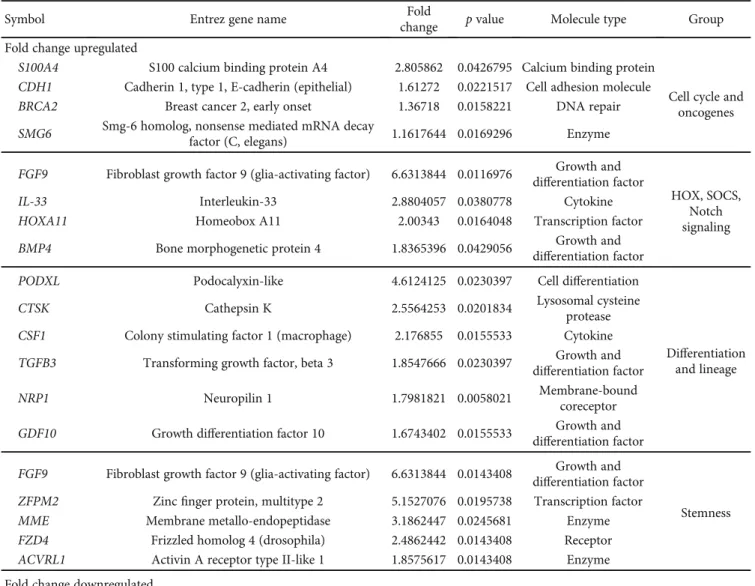
3.2. Gene Expression Analysis.Next, the gene expression pro- files of BM-MSCs and SV-MSCs were compared using microarray analyses. Genes related to differentiation and lin- eage (489 genes), stemness (422 genes), HOX (homeobox), SOCS (suppressor of cytokine signaling) and Notch signaling (380 genes), and cell cycle, oncogenes (242 genes) were col- lected into functional groups and analyzed. The hierarchical clustering clearly divided the cells with bone marrow and vessel wall origin in the case of differentiation and lineage, stemness and HOX, SOCS, and Notch signaling custom groups (Figure 3). The gene expression profile of SV-MSCs in the cell cycle and oncogenes custom group was not signif- icantly different from that of their BM-MSC counterpart (Figure 3); however, several genes related to this biological function group were differentially expressed in BM-MSCs and SV-MSCs (Table 2). In SV-MSCs, expression level of S100A4(S100 calcium binding protein A4) was significantly higher (2.8-fold change), whereas that of SMAD3 (SMAD family member 3) and CDK6 (cyclin-dependent kinase 6) was significantly lower (-2.6- and -2.2-fold change, respec- tively) than in BM-MSCs (Table 2). Significantly upregulated (≥2-fold) genes related to differentiation in SV-MSCs were found to be PODXL (podocalyxin-like), CTSK (cathepsin K), and CSF1 (colony stimulating factor 1/macrophage), while VCAM1 (vascular cell adhesion molecule 1), ACAN (aggrecan),EGR2(early growth response 2),TGFB2(trans- forming growth factor beta 2),IGF2(insulin-like growth fac- tor 2),BMP2(bone morphogenetic protein 2),BDNF(brain- derived neurotrophic factor), JAG1 (jagged 1), INHBA (inhibin, beta A),ITGA3(integrin, alpha 3),SMAD3,HES1 (hairy and enhancer of split 1), EFNB2 (ephrin-B2), PTN (pleiotrophin), and PDGFA(platelet-derived growth factor alpha) genes were significantly downregulated (≤ -2-fold).
An SV-MSC-specific pattern of stemness could be character- ized with high expression ofFGF9(fibroblast growth factor 9 or glia-activating factor),ZFPM2(zincfinger protein, multi- type 2), MME (membrane metallo-endopeptidase), and FZD4(frizzled homolog 4) genes, together with low expres- sion ofLIF(leukemia inhibitory factor or cholinergic differ- entiation factor), MGC20647 (hypothetical protein MGC20647), CXCL12 (chemokine C-X-C motif ligand 12 or stromal cell-derived factor 1), MCAM (melanoma cell
adhesion molecule), ACAN, LTBP1 (latent transforming growth factor beta binding protein 1), BMP2, SMAD3, ALCAM,ITGAV(integrin, alpha V, or vitronectin receptor), GDF6(growth differentiation factor 6), andFGF7(fibroblast growth factor 7) genes (Table 2). In the HOX, SOCS, and Notch signaling, superfamily FGF9, IL-33 (interleukin-33), andHOXA11(homeobox A11) genes were determined as sig- nificantly upregulated (≥2-fold) ones in SV-MSCs (Table 2).
Focusing on the expression of MSC-related genes, our micro- array data were validated by a qPCR-based gene array as well (Supplementary Figure 1). During characterization of MSCs, the study of senescence is particularly important. Our gene expression analysis revealed that only 18 out of 160 genes known to be important in the development of senescence are
expressed differently in BM- and SV-MSCs (Supplementary Figure 2 and Supplementary Table 1).CHEK2, GAA, TP53, CDKN1A, SQSTM1, CTSB, GLB1, ATP6V1G2, and ETS2 genes were upregulated, whileMCL1,CDK6, BAT1,TGFB1, FN1, PLAU, GALNT5, IGF1R, and IGFBP7 genes were downregulated in SV-MSCs compared to BM-MSCs. Most of the upregulated genes are responsible for maintaining replicative capacity and inhibiting cellular senescence. Taken together, our data suggest that BM-MSCs and SV-MSCs display very similar pattern of the gene expression.
3.3. Immunomodulatory Properties of BM-MSCs and SV- MSCs. The immunosuppressive properties of MSCs have been extensively studied over the past years, for their Table1: Detailed phenotypic analysis of BM-MSCs and SV-MSCs.
BM-MSC SV-MSC HUVEC
Percentage of positive cells (%)
Hematopoietic markers
CD14 0:22 ± 0:11 1:37 + 1:15 0 + 0
CD34 0 ± 0 0 ± 0 4:62 + 2:05
CD36 32:51 ± 8:18 18:12 ± 5:28 36:6 + 17:60
CD45 0 ± 0 0 ± 0 0 + 0
CD47 97:00 ± 0:86 96:65 ± 1:55 85:06 + 12:49
CD69 0 ± 0 0 ± 0 27:24 + 10:93
CD133 0 ± 0 0 ± 0 0 + 012:03
CD117 0 ± 0 0:02 ± 0:02 81:57 + 11:26∗∗∗
CXCR4 0 ± 0 0 ± 0 37:37 + 8:18∗∗
HLA-DR 0 ± 0 0 ± 0 0:19 + 0:12
Endothelial markers
CD31 0 ± 0 0 ± 0 96:78 + 0:82∗∗∗
CD144 45:33 ± 12:61 61:55 ± 18:18 93:91 + 2:45
VEGFR2/KDR 0 ± 0 0 ± 0 0:75 + 0:41
CD104/integrinβ4 28:25 ± 12:20 34:42 ± 17:82 76:42 + 11:50
MSC/fibroblast markers
CD73 91:99 ± 1:92 97:90 ± 0:80 97:85 + 0:94
CD90/Thy-1 89:05 ± 1:49 89:68 ± 3:63 2:86 + 1:55∗∗∗
CD105/endoglin 82:64 ± 2:56 89:62 ± 2:54 97:94 + 0:52∗∗∗
CD147/neurothelin 77:33 ± 8:87 81:11 ± 13:59 98:31 + 0:91
PDGF Rβ 78:01 ± 8:28 90:77 ± 3:74 54:67 + 11:90
Cell adhesion molecules
CD29/integrinβ1 92:96 ± 1:71 97:02 ± 1:87 98:77 + 0:64
CD44/H-CAM 87:28 ± 2:87 88:66 ± 2:38 79:28 + 5:06
CD49a 79:60 ± 7:77 94:25 ± 1:55 89:44 + 1:64
CD49b 68:52 ± 7:95 48:44 ± 12:25 85:32 + 5:42∗
CD49f 0 ± 0 0 ± 0 2:21 + 1:27
CD54/ICAM 14:95 + 8:36 19:89 + 8:59 34:29 + 7:24
CD56/NCAM 20:53 ± 8:41 19:18 ± 9:10 50:33 + 7:94
CD146/MCAM 77:54 ± 5:14∗∗∗ 7:09 ± 6:56 96:68 + 1:02∗∗∗
CD166/ALCAM 89:57 ± 6:27 96:22 ± 2:13 98:54 + 0:45
Expression of surface markers related to different cell types was measured byflow cytometry. The percentage of positive cells in SV-MSC culture was compared to that of BM-MSCs as well as HUVECs, as vein endothelial control. (Data are presented asmeans ± SEM;N= 5for SV-MSC,N= 12for BM-MSC,N= 7for HUVEC.p< 0:05∗,p< 0:01∗∗,p< 0:001∗∗∗vs. SV-MSCs determined by Studentt-test).
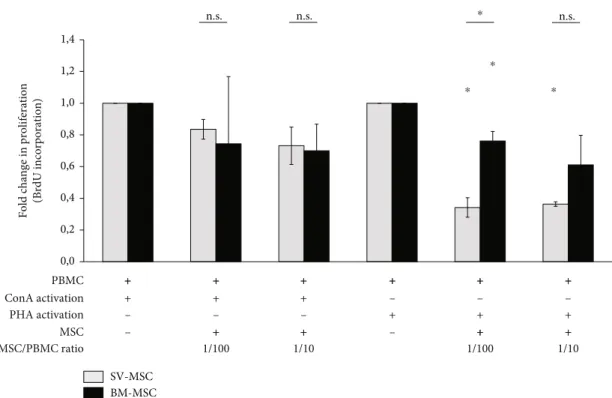
promising clinical application potential. In the present study, mitogenic mixed lymphocyte reaction (MLR) was used to compare the immunosuppressive properties of BM-MSCs and SV-MSCs. Human PBMCs from healthy donors were applied as responder cells and ConA or PHA as mitogenic activators. As expected, PBMCs proliferated in response to ConA or PHA treatment (data not shown). The addition of either BM-MSCs or SC-MSCs to PBMCs stimulated with ConA resulted in a moderate, statistically insignificant reduc- tion of BrDU incorporation (Figure 4). In contrast, statisti- cally significant suppressions of lymphocyte proliferation by both BM-MSCs and SV-MSCs could be detected in PBMCs cultures activated with PHA (Figure 4). At both cell ratios
(MSC/PBMC 1 : 100 and 1 : 10), the suppression of PBMC proliferation by SV-MSCs was more prominent; however, a significant difference between SV-MSCs and BM-MSCs in their suppressive effects was observed only at a ratio of 1 : 100 (Figure 4).
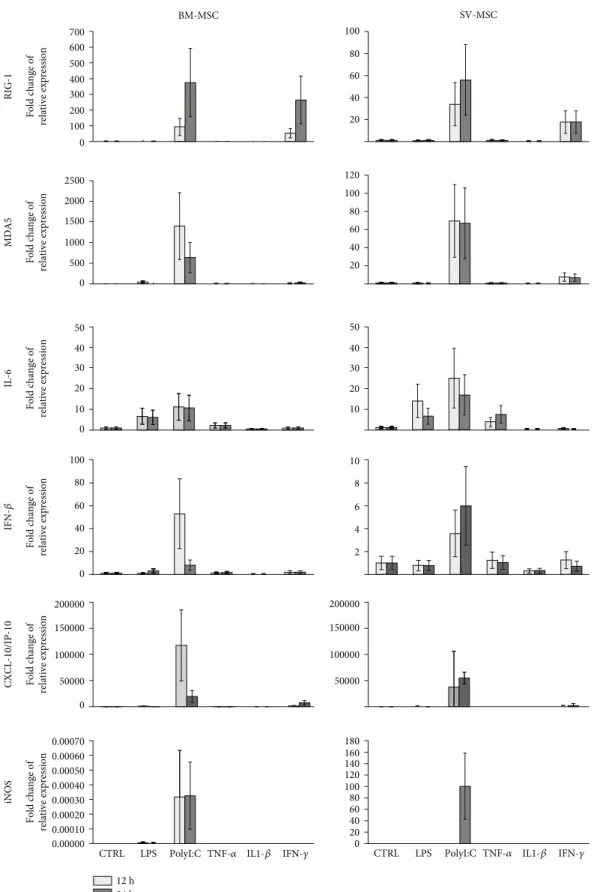
3.4. Activation of BM-MSCs and SV-MSCs. Although the immunosuppressive function of MSCs is well described, much fewer details are available about their response to pro- inflammatory cytokine exposure or TLR ligand activation, especially in case of vessel wall-derived MSCs. Therefore, in the next series of our experiments, BM-MSCs and SV- MSCs were treated with LPS, PolyI:C, TNFα, IL-1β, or IFNγ
HUVEC.D9 HUVEC.D5 HUVEC.D8 HUVEC.D2 HUVEC.D7 HUVEC.D6 HUVEC.D1 HUVEC.D4 HUVEC.D3 BM-MSC.D2 BM-MSC.D1 SV-MSC.D3 SV-MSC.D5 SV-MSC.D4 BM-MSC.D7 SV-MSC.D2 BM-MSC.D6 BM-MSC.D10 BM-MSC.D5 BM-MSC.D3 SV-MSC.D1 BM-MSC.D12 BM-MSC.D9 BM-MSC.D4 BM-MSC.D11 BM-MSC.D8
CD34 VEGFR2 CXCR4 CD36 CD106 CD49a CD49f HLADR CD69 CD45 CD133 CD14 CD90 PDGFRb CD44 CD47 CD166 CD117 CD31 CD104 CD73 CD144 CD29 CD56 CD49b CD54 CD146 CD147 CD105
0 20 60 100
Score (percentage of positive cells) Color key
40 80
Figure2: Hierarchical clustering of surface markers expressed by BM-MSCs and SV-MSCs. Robust hierarchical clustering of cell surface molecules’expression divided the BM-MSCs and SV-MSCs from the endothelial cells isolated from the umbilical cord tissue (HUVEC).
SV-MSCs were more closely related to BM-MSC than to endothelial cells (a). (Color key represents percentage of positive cells in the in vitro cell cultures,NHUVEC= 9,NSV−MSC= 5, andNBM−MSC= 12.)
Stemness
Cell cycle, oncogenesDifferentiation and lineage
–1.7 1.7
0
HOX SOCS, notch signaling
BM-MSC.D1 BM-MSC.D2 BM-MSC.D3 SV-MSC.D1 BM-MSC.D1 BM-MSC.D2 BM-MSC.D3
SV-MSC.D2 SV-MSC.D1 SV-MSC.D2
BM-MSC.D1 BM-MSC.D2 BM-MSC.D3 SV-MSC.D1 SV-MSC.D2
BM-MSC.D1 BM-MSC.D2 BM-MSC.D3 SV-MSC.D1 SV-MSC.D2
–1.9 1.9
0
–1.9 1.9
0
–2.2 2.2
0
Figure3: Heat maps of the differentially expressed genes in BM-MSCs and SV-MSCs. Genes related to stemness, HOX, Notch and SOX signaling, differentiation and lineage, cell cycle, and oncogenes were selected. The functional cluster analysis of the different expression levels of selected genes shows the difference between the cell types suggesting different tissue origin. (Color key represents relative gene expression levels.)
Table2: Top up- and downregulated custom selected genes in SV-MSCs.
Symbol Entrez gene name Fold
change pvalue Molecule type Group
Fold change upregulated
S100A4 S100 calcium binding protein A4 2.805862 0.0426795 Calcium binding protein
Cell cycle and oncogenes CDH1 Cadherin 1, type 1, E-cadherin (epithelial) 1.61272 0.0221517 Cell adhesion molecule
BRCA2 Breast cancer 2, early onset 1.36718 0.0158221 DNA repair
SMG6 Smg-6 homolog, nonsense mediated mRNA decay
factor (C, elegans) 1.1617644 0.0169296 Enzyme
FGF9 Fibroblast growth factor 9 (glia-activating factor) 6.6313844 0.0116976 Growth and differentiation factor
HOX, SOCS, Notch signaling
IL-33 Interleukin-33 2.8804057 0.0380778 Cytokine
HOXA11 Homeobox A11 2.00343 0.0164048 Transcription factor
BMP4 Bone morphogenetic protein 4 1.8365396 0.0429056 Growth and
differentiation factor
PODXL Podocalyxin-like 4.6124125 0.0230397 Cell differentiation
Differentiation and lineage
CTSK Cathepsin K 2.5564253 0.0201834 Lysosomal cysteine
protease CSF1 Colony stimulating factor 1 (macrophage) 2.176855 0.0155533 Cytokine TGFB3 Transforming growth factor, beta 3 1.8547666 0.0230397 Growth and
differentiation factor
NRP1 Neuropilin 1 1.7981821 0.0058021 Membrane-bound
coreceptor GDF10 Growth differentiation factor 10 1.6743402 0.0155533 Growth and
differentiation factor FGF9 Fibroblast growth factor 9 (glia-activating factor) 6.6313844 0.0143408 Growth and
differentiation factor
Stemness ZFPM2 Zincfinger protein, multitype 2 5.1527076 0.0195738 Transcription factor
MME Membrane metallo-endopeptidase 3.1862447 0.0245681 Enzyme
FZD4 Frizzled homolog 4 (drosophila) 2.4862442 0.0143408 Receptor
ACVRL1 Activin A receptor type II-like 1 1.8575617 0.0143408 Enzyme Fold change downregulated
SMAD3 SMAD family member 3 -2.579574 0.0108465 Transcriptional
modulator
Cell cycle and oncogenes
CDK6 Cyclin-dependent kinase 6 -2.243104 0.0237225 Enzyme
KRAS|LYRM5
v-Ki-ras2 Kirsten rat sarcoma viral oncogene
homolog|LYR motif containing 5 -1.901833 0.0461384 Proto-oncogene TGFB1 Transforming growth factor, beta 1 -1.731404 0.0158221 Growth and
differentiation factor RARA Retinoic acid receptor, alpha -1.566421 0.0337291 Nuclear receptor
HUS1 Checkpoint protein HUS1 -1.287702 0.0108465 Genotoxin-activated
checkpoint complex SUN1|C7orf20
Sad1 and UNC84 domain containing 1|chromosome
7 open reading frame 20 -1.263087 0.0108465 Nuclear envelope protein PURA Purine-rich element binding protein A -1.253684 0.0108465
Multifunctional DNA- and RNA-binding
protein
CDON Cdon homolog (mouse) -1.5534242 0.0691849 Cell surface receptor
HOX, SOCS, Notch signaling
HOXA2 Homeobox A2 -1.6179696 0.0280393 Transcription factor
SNAI1 Snail homolog 1 (drosophila) -1.6272678 0.0442530 Transcription factor PYGO1 Pygopus homolog 1 (drosophila) -1.6621072 0.0924799
NOTCH2 Notch homolog 2 (drosophila) -1.6733813 0.0177410 Transmembrane protein
for 12 and 24 hours, and the expression of various early innate immune response-related genes was investigated. As shown in Figure 5, the mRNA expression level of a dsRNA sensor RIG-I(retinoic acid-inducible gene I) was increased after 12 and 24 hours upon PolyI:C and IFNγtreatment both in BM-MSCs and SV-MSCs. Activation with PolyI:C also induced a marked rise in the expression ofMDA5, another dsRNA sensor of the RIG-I-like receptor family [23]. Induc- tion of both RIG-I and MDA5 gene expression was more
robust in BM-MSCs. The expression of IL-6 gene was increased upon LPS, PolyI:C, and TNFαtreatments at both time points in both MSC types. The IFNβ expression was markedly upregulated in the case of PolyI:C activation fol- lowing 12- and 24-hour treatments in both type of MSCs.
A robust increase in the gene expression level of CXCL- 10/IP-10 (interferon gamma-induced protein 10) was observed when MSCs were treated with PolyI:C at both time points (Figure 5). Inducible nitrogen-oxide synthase (iNOS) Table2: Continued.
Symbol Entrez gene name Fold
change pvalue Molecule type Group
MAML2 Mastermind-like 2 (drosophila) -1.6876673 0.0481715 Transcriptional coactivator VCAM1 Vascular cell adhesion molecule 1 -17.354261 0.0058021
Differentiation and lineage
ACAN Aggrecan -5.5746202 0.0192411
EGR2 Early growth response 2 -4.387574 0.0191151
TGFB2 Transforming growth factor, beta 2 -3.9135396 0.0058021 IGF2|INS-
IGF2
Insulin-like growth factor 2 (somatomedin A)|INS-
IGF2 readthrough transcript -3.4904327 0.0192411
BMP2 Bone morphogenetic protein 2 -3.314717 0.0230696
BDNF Brain-derived neurotrophic factor -3.2864723 0.0155533
JAG1 Jagged 1 (Alagille syndrome) -3.0462105 0.0058021
INHBA Inhibin, beta A -2.8667028 0.0422998
ITGA3 Integrin, alpha 3 (antigen CD49C, alpha 3 subunit of
VLA-3 receptor) -2.775381 0.0155533
SMAD3 SMAD family member 3 -2.5795743 0.0078861
HES1 Hairy and enhancer of split 1 (drosophila) -2.220433 0.0192411
EFNB2 Ephrin-B2 -2.1113176 0.0358564
PTN Pleiotrophin -2.1063795 0.0155533
PDGFA LOC100132080
Platelet-derived growth factor alpha
polypeptide|hypothetical LOC100132080 -2.0340111 0.0155533
LIF|MGC20647
Leukemia inhibitory factor (cholinergic differentiation factor)|hypothetical protein
MGC20647
-9.517681 0.0154874
Stemness CXCL12 Chemokine (C-X-C motif) ligand 12|chemokine (C-
X-C motif) ligand 12 (stromal cell-derived factor 1) -8.499458 0.0414186
MCAM Melanoma cell adhesion molecule -5.909656 0.0080718
ACAN Aggrecan -5.5746202 0.0193145
LTBP1 Latent transforming growth factor beta binding
protein 1 -4.3929467 0.0398936
BMP2 Bone morphogenetic protein 2 -3.314717 0.0236414
SMAD3 SMAD family member 3 -2.5795743 0.0087946
ALCAM Activated leukocyte cell adhesion molecule -2.1179285 0.0080718 ITGAV Integrin, alpha V (vitronectin receptor, alpha
polypeptide, antigen CD51) -2.0977302 0.0143408 GDF6 Growth differentiation factor 6 -2.054666 0.0427049 FGF7 Fibroblast growth factor 7 (keratinocyte growth
factor) -2.0363815 0.049803
FGFR2 Fibroblast growth factor receptor 2 -1.8906314 0.0324610
Top up- and downregulated genes in SV-MSCs related to stemness, HOX, Notch and SOX signaling, differentiation and lineage, cell cycle, and oncogenes were selected by the significance.
is a key element of MSC-mediated immunosuppression [24].
The expression of iNOSwas notably induced in SV-MSCs after a 24-hour PolyI:C treatment, whereas its expression level in BM-MSCs remained almost unchanged under the same conditions. Overall, there were no significant differ- ences between SV-MSCs and BM-MSCs in the expression pattern of genes associated with TRL ligand- and proin- flammatory cytokine-triggered activation (Supplementary Figure 3).
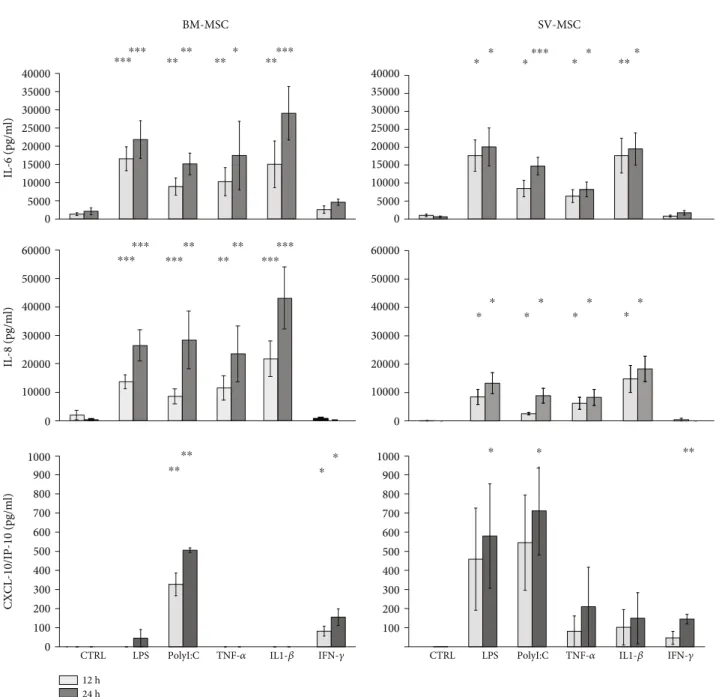
To validate ourfindings at protein level, secreted cyto- kine and chemokine concentrations were also determined in MSC cultures upon activation of the cells with TLR ligands or proinflammatory cytokines (Figure 6). IL-6 was constantly secreted by both types of MSCs under normal conditions.
Secretion patterns of IL-6 cytokine and IL-8 chemokine were similar in both MSC cultures. Exposure to LPS, PolyI:C, TNFα, or IL-1βfor 12 and 24 hours triggered a significant increase in the concentrations of both above mentioned secreted mediators, whereas treatments with IFNγdid not modify their production by BM-MSCs and SV-MSCs. More intense IL-6 and IL-8 production was observed in BM-MSC than SV-MSC culture (Figure 6). Both type of MSCs secreted CXCL-10/IP-10 chemokine upon TLR- and cytokine recep- tor ligation. In contrast to IL-6 and IL-8 levels, SV-MSCs produced more CXCL-10/IP-10 in response to activation than BM-MSCs. Based on our measurements, in BM-MSCs cultures, PolyI:C and IL-1β stimuli were the most potent inducers of CXCL-10/IP-10 production, while SV-MSCs released this chemokine in increased concentrations as a result of any applied activations; however, the changes were
statistically significant only when the cells were exposed to the TLR ligands, LPS, or PolyI:C (Figure 6).
4. Discussion
Mesenchymal stromal cells reside in various tissues of meso- dermal origin. They are multipotent cells, which are able to differentiate into various types of specialized cells including osteoblasts, chondrocytes, and adipocytes [25]. This ability endows MSCs with a broad regenerative potential in adult tissues [26]. However, MSCs do not only contribute to tissue repair processes but also have strong immunomodulatory properties and may inhibit inflammation by modulation of local environment [27].
In this study, we separated MSCs from saphenous vein vessel wall and compared their morphology, phenotype, and functions to those of bone marrow-derived MSCs to reveal the differences and similarities, which could be associ- ated with their regulatory role in angiogenesis or their immu- nomodulatory properties under physiologic and pathologic conditions. Pericytes and MSCs share morphology, expres- sion of several cell surface molecules, and even differentiation potentialin vitro; however, MSCs can be characterized by a combination of perivascular (CD146, PDGFRβ) and MSC markers (CD29, CD44, CD73, CD90, CD105) as well as by the lack the expression of hemato-endothelial cell markers (CD31, CD34, CD45, CD144) [28]. According to our find- ings, the cells isolated from saphenous vein (SV-MSC) showed similar morphology to bone marrow-derived MSCs (BM-MSC). The plastic adherent MSCs have been shown to
Fold change in proliferation (BrdU incorporation)
⁎ ⁎
0,0 0,2 0,4 0,6 0,8 1,0 1,2 1,4
BM-MSC SV-MSC PBMC
ConA activation PHA activation
+ +
MSC
+
+ + +
+ + + ++ ++ ++
+ + +
– – –
– – –
+ +
+ + ++ ++
– –
1/10
1/100 1/100 1/10
MSC/PBMC ratio
⁎
⁎ n.s.
n.s. n.s.
Figure4: Immunomodulatory effect of SV- and BM-MSCsin vitro. Fold change in PBMCs’proliferation showed that bone marrow- and vessel wall-derived MSCs were capable to inhibit the proliferation of lymphocytes activated by either PHA or ConAin vitro; however, statistically significant reductions in BrDU incorporation were observed only in the case of PHA. (Data shown aremean ± SEM,N= 3;p<
0:05∗.)
RIG-1
0
MDA5
500 1000 1500 2000 2500
IL-6
0 100 200 300 400 500 600 700
20 40 60 80 100
20 40 60 80 100 120
Fold change of relative expressionFold change of relative expressionFold change of relative expression 10
20 30 40 50
BM-MSC SV-MSC
100 80 60 40 20 0
0 50000 100000 150000 200000
IFN-𝛽CXCL-10/IP-10iNOS
0.00000 0.00010 0.00070 0.00060 0.00050 0.00040 0.00030 0.00020 Fold change of relative expressionFold change of relative expressionFold change of relative expression
10 8 6 4 2
0 20 40 60 80 100 120 140 160 180
CTRL LPS PolyI:C TNF-𝛼 IL1-𝛽 IFN-𝛾
24 h 12 h 0 10 20 30 40 50
50000 100000 150000 200000
CTRL LPS PolyI:C TNF-𝛼 IL1-𝛽 IFN-𝛾
Figure5: Relative expression levels of selected genes in MSCs derived from bone marrow and saphenous vein in resting and stimulated cells.
Mesenchymal stromal cells were treated with 100 ng/ml LPS, 25μg/ml PolyI:C, 100 ng/ml TNFα, 10 ng/ml IL-1β, or 10 ng/ml IFNγfor 12 and 24 hours as described in Methods. Relative levels of mRNA were measured in triplicates by qPCR, and fold changes in the gene expression were calculated from the ratio of expression levels in treated and untreated cells asmean ± SEM(N= 3in both cell types).
differentiate toward multiple mesodermal lineages including fat, bone, and cartilage cells. SV-MSC cultures could be dif- ferentiated toward canonical mesodermal; adipogenic, osteo- blastic, and chondrogenic directions culturing the cells in the appropriate induction media. Similar to BM-MSCs, the SV- MSCs are also fit to the criteria defined by ISCT, which means that all expected markers could be detected. The populations of BM- and SV-MSCs were well identified;
they differed from the myoblasts, smooth muscle cell pre- cursors, or from the control HUVEC cells. The only sig- nificant difference identified was the higher expression of CD146 on the surface of BM-MSCs than on that of SV- MSCs. Previous findings in in vitro and animal models
suggest that higher CD146 level on MSCs is associated with more plasticity, better ability for transendothelial migration but lower regenerative potential of the cells [29, 30]. Further studies examining the human relevance of these observations need to be performed.
Our results provide an evidence that the isolation tech- nique invented by our group is suitable to collect a pure vessel wall-derived mesenchymal stromal cell population. To inves- tigate differences and similarities between the gene expres- sion profile of BM-MSCs and SV-MSCs, we examined the genes related to differentiation and lineage, stemness, HOX, SOCS, Notch signaling, cell cycle, and oncogenes. These data were collected into functional groups to reveal and compare
10000 20000 30000 40000 50000 60000
BM-MSC
IL-8 (pg/ml)
SV-MSC
IL-6 (pg/ml)
0
CXCL-10/IP-10 (pg/ml)
0 5000 10000 15000 20000 25000 30000 35000 40000
0 5000 10000 15000 20000 25000 30000 35000 40000
0 100 200 300 400 500 600 700 800 900 1000
100 200 300 400 500 600 700 800 900 1000 10000 20000 30000 40000 50000 60000
0
CTRL LPS PolyI:C TNF-𝛼 IL1-𝛽 IFN-𝛾
24 h 12 h
CTRL LPS PolyI:C TNF-𝛼 IL1-𝛽 IFN-𝛾
⁎⁎⁎⁎⁎⁎
⁎⁎⁎⁎
⁎⁎ ⁎ ⁎⁎⁎⁎⁎ ⁎⁎⁎
⁎⁎
⁎ ⁎
⁎ ⁎ ⁎ ⁎
⁎ ⁎
⁎ ⁎
⁎ ⁎
⁎ ⁎
⁎⁎⁎⁎⁎⁎
⁎⁎⁎
⁎⁎⁎⁎⁎ ⁎⁎⁎⁎ ⁎⁎⁎
⁎⁎⁎⁎
⁎ ⁎ ⁎ ⁎ ⁎⁎
Figure6: Cytokine secretion by activated MSCs derived from bone marrow and saphenous vein. IL-6, IL-8, and IP-10 cytokine production of TRL ligands (LPS, PolyI:C), as well as proinflammatory cytokine- (TNFα, IFNγ, IL-1β) stimulated MSCs. In vitro cultured cells were treated in 12 h and 24 h intervals. (Data shown aremean ± SD;p< 0:05∗,p< 0:01∗∗,p< 0:001∗∗∗;N= 6for the BM-MSCs andN= 3for the SV- MSCs, respectively.)
the functional properties of the BM-MSCs and SV-MSCs.
According to the hierarchical clustering in case of the genes related to the cell cycle and oncogenes custom group, we did not detect any significant difference between the BM- and SV-MSCs. In contrast, the expression profile clearly divided the cells isolated from bone marrow and saphenous vein into two groups in case of the differentiation and lineage, stemness and HOX, SOCS, and Notch signaling groups as well as senescence. Above described differences could be the consequences of the variant origin and localisation of MSCs [31], functions of BM-MSCs in the bone marrow to support the differentiation and survival of hematopoietic stem cells (HSC) while the SV-MSCs are responsible for the regenera- tion and wound healing, angiogenesis, and neovasculariza- tion [32]. The immunosuppressive activity of BM-MSCs is already published in details underlying their importance in the treatment or their possible application in case of a wide array of nonphysiologic conditions like autoimmune and inflammatory diseases or cancer. Based on our present data, we can state that SV-MSCs also have a potential to suppress the mitogenic activation of PBMCs. Moreover, in our exper- iments, SV-MSCs displayed better immunosuppressive activ- ity inhibiting PHA-induced T lymphocyte proliferation in vitrothan BM-MSCs.
When MSCs are exposed to degraded ECM products, they exhibited an increased migratory capability [33]. These changes prove the activation of MSCs in the presence of var- ious stimuli such as injury, infection, or sterile inflammation resulted in the enhanced secretion of various cytokines, like basic-fibroblast growth factor (b-FGF), chemotactic and mitogenic molecules, or vascular endothelial growth factor (VEGF) modulating the angiogenesis [34]. Like many other cells, the MSCs also express extra- and intracellular pattern recognition receptors (PRRs). Immunomodulatory functions of MSCs can be influenced by either ligation of PRRs or via exposure to cytokines and other immunomodulatory factors [35]. Response of MSCs to different stimulatory factors determinates the differentiation and functions of neighbour- ing immune and not immune cells thus the immune responses themselves [36, 37]. Both BM- and SV-MSCs could be stimulated by PolyI:C leading to the increased expression of RIG-I, MDA5, IL-6, IFNβ, CXCL-10/IP-10, and iNOS. However, we detected differences in the intensity of cellular responses following the PolyI:C treatments. BM- MSCs are able to react to PolyI:C to a greater extent by expressing higher levels of RIG-I, MDA-5, IFNβ, and CXCL-10/IP-10 than SV-MSCs. In agreement with previous findings [38], both BM-MSCs and SV-MSCs could be acti- vated with LPS despite the fact that MSCs express CD14, which plays a vital role in TLR4 signaling pathway, at a very low level. LPS treatment may induce slight expression of cytokines and chemokines in MSCs without activation of AKT, NF-κB, and P38 [38]. TLR and cytokine receptor liga- tion resulting in upregulated secretion of IL-6, IL-8, and CXCL-10/IP-10, although a treatment with IFNγ had no effect on their cytokine and chemokine production. Priming of MSCs by PRR ligands to alter their immunomodulatory activity is known to be essential to use these cells in the treat- ment of various diseases [39]; however, it seems that MSCs
isolated from bone marrow or saphenous vein respond to priming stimuli in slightly different ways.
Under physiologic and pathologic conditions, MSCs express a wide array of surface markers and produce various factors by which they can communicate with different cell types including immune cells. The immunomodulatory capac- ity of MSCs may result in the inhibited proliferation of lym- phocytes and suppressed function of activated inflammatory cells. Furthermore, they are able to drive and determine the differentiation of myeloid-derived cells and the polarization of the T cell response [40]. Based on our results, SV-MSCs ful- fill the ISCT criteria for multipotent mesenchymal stromal cells and share almost identical phenotypic and functional characteristics with BM-MSCs. Furthermore, SV-MSCs are easy to obtain and could be alternative sources of MSCs with tissue origin. Therefore, SV-MSCs can be considered as good candidate for further thorough investigations (e.g., assays test- ing proliferative capacity, sensitivity to apoptosis, and karyo- type changes during replication) to reveal whether these cells could be useful for certain regenerative therapeutic and tissue engineering applications (e.g., 3D bioprinting).
Data Availability
The gene array data used to support thefindings of this study are available from the corresponding author upon request.
Disclosure
The funders had no role in study design, data collection and analysis, decision to publish, or preparation of the manuscript.
Conflicts of Interest
The authors declare that they have no conflicts of interest.
Authors’Contributions
Zoltán Veréb and Anett Mázló contributed equally to this work. Attila Bácsi and Éva Rajnavölgyi contributed equally to this work. Conceived and designed the experiments were done by Zoltán Veréb and Éva Rajnavölgyi. Performed the experiments was done by Zoltán Veréb, Anett Mázló, Gábor Koncz, Attila Szabó, and Szilárd Póliska. Provided the mate- rials was done by Attila Kiss, Krisztina Litauszky, Gábor Koncz, Zoltán Boda, and Attila Bácsi. Analyzed the data was done by Zoltan Veréb, Anett Mázló, Attila Szabó, and Szilárd Poliska. Wrote the paper was done by Zoltan Veréb, Anett Mázló, Attila Bácsi, and Éva Rajnavölgyi. Zoltán Veréb and Anett Mázló contributed equally and co-first authors.
Éva Rajnavölgyi and Attila Bácsi contributed equally and co-last authors.
Acknowledgments
The authors thank Ms. Anikó Gergely Pálné and Erzsébet Nagyné Kovács for their excellent technical assistance. This work was supported by the National Research, Development and Innovation Office (NKFIH PD 132570 to ZV, NN