Rapid One-Pot Synthesis and Photoelectrochemical Properties of Copper Vanadates
Mohammad K. Hossain,
†Paola Sotelo,
†Hori P. Sarker,
‡Miguel T. Galante,
§Attila Kormányos,
∥,⊥Claudia Longo,
§Robin T. Macaluso,
†Mohammad N. Huda,
‡Csaba Janáky,
∥,⊥and Krishnan Rajeshwar*
,††Department of Chemistry and Biochemistry and‡Department of Physics, The University of Texas at Arlington, Arlington, Texas 76019, United States
§Institute of Chemistry, University of Campinas−UNICAMP, 13083-970, Campinas, Brazil
∥Department of Physical Chemistry and Materials Science, University of Szeged, Rerrich Square 1, Szeged, H-6720, Hungary
⊥MTA-SZTE, Lendület Photoelectrochemistry Research Group, Rerrich Square 1, Szeged, H-6720, Hungary
*S Supporting Information
ABSTRACT: Solution combustion synthesis (SCS) is shown to be versatile for the rapid-one-pot synthesis of three compounds and four polymorphs in the Cu−V−O ternary family:α-CuV2O6,α- andβ-Cu2V2O7, andγ-Cu3V2O8. These compounds feature copper/vanadium stoichiometric ratios ranging from 1:1 to 3:1; their structural, electronic, optoelectronic, and photoelectrochemical attributes were comprehensively characterized by a combination of theoretical and experimental techniques. The main contribution of the present study is the demonstration that a range of stoichiometries in this compound family can be derived simply by tuning the precursor mole ratio in the SCS procedure. The Cu−V−O family of samples, derived by SCS, is shown to exemplify the strong effect of compound stoichiometry on the optoelectronic and photoelectrochem- ical properties. Overall,α-CuV2O6showed the best performance, rooted in the direct nature of the optical transition in this material. Finally, SCS is very time- efficient and the various compositions can be obtained in a matter of minutes, as opposed to hours or even days in classical solution-based or ceramic synthesis routes.
KEYWORDS: solar fuels, inorganic semiconductors, optical excitation, solar energy conversion, energy band gap, electronic band structures
1. INTRODUCTION
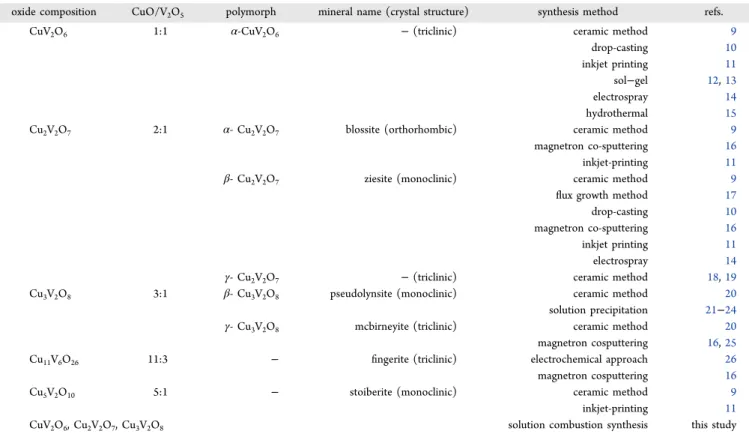
We show in this paper that solution combustion synthesis (SCS)1−5 is versatile for preparing various compound stoichiometries within the Cu−V−O ternary family simply by varying the copper/vanadium mole ratio in a “one-pot” precursor mixture. Trends in the materials chemistry properties and photoelectrochemical (PEC) activity6,7 are presented as are corresponding trends in polymorphic modifications and electronic band structures. The stoichiometries of the various compounds in this family may be visualized8 in terms of the CuO/V2O5 combining ratio in the ultimate ternary composi- tion, as shown in the second column inTable 1.
The combination of a narrow energy bandgap (in the∼2 eV range) and excellent stability against photocorrosion has thrust copper vanadates into the forefront of emerging photoanode materials for solar fuels generation.10−12,14,16,25−29
In the continuing search for a magic bullet semiconductor material, it is imperative that the synthesis technique is time-efficient.
Otherwise, materials screening is bound to be inefficient and cost-ineffective from a practical standpoint. In this vein, this study seeks to demonstrate the virtues of SCS as a screening
tool to generate a series of compounds with progressively tuned stoichiometries from a single“pot”.
Interest in the structural aspects of Cu−V−O materials appears to have begun in 1958;30 this early study identified stoichiometries ranging from 1:1 to 5:1 within the system.
Notably, the 4:1 stoichiometry was missing from a subsequently reported phase diagram31 and, accordingly, previous authors were unable to prepare Cu4V2O9 (see ref 32and references therein.) Other than the PEC applications of immediate interest within the present study context, copper vanadates are also of technological interest as lithium- intercalating battery cathodes9,13,15,23,33,34
(or even anodes35), thermal batteries,9,36 unique magnetic materials,16,17,20,37−39
flame retardants,40 photocatalysts for environmental remedia- tion,21,23or as catalysts in solar thermochemical water splitting cycles.41−43
Received: January 24, 2019 Accepted: March 8, 2019 Published: March 8, 2019
www.acsaem.org Cite This:ACS Appl. Energy Mater.XXXX, XXX, XXX−XXX
© XXXX American Chemical Society A DOI:10.1021/acsaem.9b00179
ACS Appl. Energy Mater.XXXX, XXX, XXX−XXX
Downloaded via 160.114.157.146 on March 22, 2019 at 08:06:47 (UTC). See https://pubs.acs.org/sharingguidelines for options on how to legitimately share published articles.
Polymorphic transformations have been of interest right from the early history of study of the Cu−V−O family to the present.18,19,32,44−48 Thus, Cu2V2O7 features three poly- morphs, α-, β-, and γ- whose thermal interconversions have been studied18 by the combined use of X-ray diffraction (XRD) and thermal analysis (specifically, differential thermal analysis or DTA). Similar studies have been performed on phase transitions in Cu3V2O8, where again three modifications were reported.44Single crystals ofα-CuV2O6and theβ- andγ- Cu2V2O7phases have been grown by theflux growth method or in melts.17,38 A variety of polymorphs was also seen in studies employing high throughput combinatorial method- ology11,16on CuV2O6(α-), Cu2V2O7(α- andβ), and Cu3V2O8 (γ-). We were able to delineate the various polymorphs in our SCS samples using XRD (with Rietveld refinement) as a function of their thermal anneal history. The photoactivity of these polymorphs will be shown to depend crucially on the stoichiometry of the copper vanadates.
Finally, experimental results on the four SCS-derived copper vanadates in this study (α-CuV2O6,α- andβ-Cu2V2O7, andγ- Cu3V2O8) were corroborated by electronic band structure calculations. Precedent theoretical studies, involving density functional theory (DFT) or relativistic and ab initio calculations, are noted here for Cu2V2O7, Cu3V2O8, and Cu11V6O26.16,27,39,47
In the Cu2V2O7 case, the electronic, structural, and magnetic properties of all three phases (α-, β-, and γ-) were mapped in the first-principles study.16 The electronic structures have been experimentally mapped via the use of X-ray absorption spectroscopy.25 The overlapping aspects of our new results with the corpus of literature information summarized in this introductory section, and also presented inTable 1, will be further elaborated in what follows below.
2. EXPERIMENTAL SECTION
Materials. Copper nitrate hemi-(pentahydrate) [Cu(NO3)2·2.5 H2O (Alfa Aesar)] and ammonium vanadate [NH4VO3(Alfa Aesar)]
were used as Cu and V source, respectively.DL-malic acid [C6H4O5 (Alfa Aesar)] was used as fuel as well as complexing agent for vanadate ion in the solutions. Sodium tetraborate decahydrate [(Na2B4O7·10 H2O (Sigma-Aldrich)] and boric acid (H3BO3) were used to prepare electrolyte solutions for PEC characterizations.
Double-distilled water (Corning Megapure) was used to prepare all the solutions. All the chemicals were used as received without further purification.
Solution Combustion Synthesis. Stoichiometric amounts of precursors were calculated and are shown ineqs 1−3.
3Cu(NO ) 2.5H O 6NH VO C H O
3CuV O (s) 6N (g) 4CO (g) 22.5H O(g)
3 2 2 4 3 4 6 5
2 6 2 2 2
· + +
→ + + + (1)
12Cu(NO ) 2.5H O 12NH VO 7C H O 6Cu V O (s) 18N (g) 28CO (g) 75H O(g)
3 2 2 4 3 4 6 5
2 2 7 2 2 2
· + +
→ + + + (2)
3Cu(NO ) 2.5H O 2NH VO 2C H O Cu V O (s) 4N (g) 8CO (g) 17.5H O(g)
3 2 2 4 3 4 6 5
3 2 8 2 2 2
· + +
→ + + + (3)
A stoichiometric amount of copper nitrate was dissolved in water while stoichiometric proportions of ammonium vanadate andDL-malic acid (1:1 mol ratio) were dissolved in water. Then, the two solutions were mixed together with continuous stirring leading to the homogeneous precursor solution with afinal concentration listed in Table 2. The precursor mixtures were then transferred to a preheated muffle furnace set at a temperature of ∼300 °C (Figure 1). The precursor mixture wasfirst dehydrated and brought to ignition;finally sintering of the sample set in. It took 5−10 min to complete the reaction; the product at this stage is termed“as-synthesized”in what follows. The as-synthesized samples were then annealed at different temperatures, both to remove remaining organic traces and to secure improved crystallinity.
Table 1. Synthetic Methods for Copper Vanadates
oxide composition CuO/V2O5 polymorph mineral name (crystal structure) synthesis method refs.
CuV2O6 1:1 α-CuV2O6 −(triclinic) ceramic method 9
drop-casting 10
inkjet printing 11
sol−gel 12,13
electrospray 14
hydrothermal 15
Cu2V2O7 2:1 α- Cu2V2O7 blossite (orthorhombic) ceramic method 9
magnetron co-sputtering 16
inkjet-printing 11
β- Cu2V2O7 ziesite (monoclinic) ceramic method 9
flux growth method 17
drop-casting 10
magnetron co-sputtering 16
inkjet printing 11
electrospray 14
γ- Cu2V2O7 −(triclinic) ceramic method 18,19
Cu3V2O8 3:1 β- Cu3V2O8 pseudolynsite (monoclinic) ceramic method 20
solution precipitation 21−24
γ- Cu3V2O8 mcbirneyite (triclinic) ceramic method 20
magnetron cosputtering 16,25
Cu11V6O26 11:3 − fingerite (triclinic) electrochemical approach 26
magnetron cosputtering 16
Cu5V2O10 5:1 − stoiberite (monoclinic) ceramic method 9
inkjet-printing 11
CuV2O6, Cu2V2O7, Cu3V2O8 solution combustion synthesis this study
ACS Applied Energy Materials
DOI:10.1021/acsaem.9b00179 ACS Appl. Energy Mater.XXXX, XXX, XXX−XXX B
Physical Characterizations.To study the combustion pattern of the precursor mixture, a simulation of combustion reactions was performed using thermogravimetric analysis (TGA) and differential scanning calorimetry (DSC) in a TA Instruments-Q600 instrument using an alumina crucible. Approximately 20 mg of precursor mixture was loaded in the crucible and heated from room temperature to 800
°C with 5°C/min ramp under a constant airflow of 100 mL/min.
Powder XRD data were collected at room temperature on a PANalytical Empyrean powder diffractometer equipped with Cu Kα radiation, a Bragg−Brentano HD optical module and a position- sensitive PIXcel 3D detector. The angular range covered was 2θ = 10−70°and a step size ofΔ2θ= 0.008°was used. Rietveld refinement of XRD patterns was carried out using X’Pert Highscore Plus49 software package employing a pseudo-Voigt function.
Scanning electron microscopy (SEM) images and energy-dispersive X-ray spectroscopy (EDX) were performed on a Hitachi-S3000 instrument. Optical analyses of the bulk powder samples were performed on a PerkinElmer Lambda 35 UV−vis spectrophotometer equipped with an integrating sphere over the range of 400−1000 nm.
The Kubelka−Munk transformation (eq 4) was applied to transform diffuse reflectance (R) to absorption coefficient,α50
F R s
R
( ) (1 R )
2 α 2
= = − ∞
∞ (4)
Energy bandgaps were estimated using the Tauc plot based oneq 550
hν=α ν(h −Eg)n (5)
Here,Egdenotes the bandgap andnrepresents the mode of transition, i.e.,n= 1/2 for direct transition andn= 2 for indirect transition.
Electrode Preparation and Photoelectrochemical Measure- ments.Electrodes of the various samples were prepared from bulk powder using spray-coating. Details of the preparation can be found elsewhere.51 The photoelectrochemical (PEC) measurements were performed in a classical one-compartment, three-electrode electro- chemical cell (CH Instruments, Model CHI720C). A Ag/AgCl/4 M KCl electrode was used as the reference and a Pt wire was used as the counterelectrode. All potentials in this study are reported versus the reversible hydrogen electrode according toeq 6.
E E 0.0591pH E
E 0.1976V versus NHE at 25 C
RHE Ag/AgCl 0Ag/AgCl(4M KCl)
Ag/AgCl(4M KCl) 0
= + +
= ° (6)
A 400 W Xe-arc lamp (Newport) was used as the radiation source equipped with an IRfilter. The incident light was adjusted to 1 Sun (100 mW/cm2) at the surface of working electrode using a calibrated Si reference cell (Oriel). Photocurrent measurements were performed in 0.1 M borate buffer (pH 9.2) (in some cases with addition of 0.1 M Na2SO3) with potential scan at 1 mV s−1sweep rate.
Photoelectrochemical electrode stability tests employed chronoam- perometric measurements at afixed potential for 2 h. The irradiation was blocked after each 30 min for a few seconds to confirm that dark current remained negligible. ICP-AES analysis of the electrolyte solution after the photostability experiment was performed using a Shimadzu ICPE-9000 instrument.
Kelvin-Probe Microscopy and Surface Photovoltage Spec- troscopy. Measurements were performed using a KP Technology APS04 K-probe instrument. First, the Fermi level (EF) of the 2 mm in diameter gold alloy-coated tip was determined by measuring the Fermi level of a silver reference target (EF,Au tip= −4.73 eV). Thin films identical to those investigated in the PEC experiments were studied. The tip was vibrated over the sample surface at afixed height (∼1 mm) and amplitude (0.2 mm) with a constant frequency (70 Hz). Contact potential difference (CPD) was measured between the sample and the Kelvin probe tip after electrical equilibrium was reached. Surface photovoltage spectroscopy (SPV) data were recorded under ambient conditions. The vibrating Kelvin-probe tip functioned as the reference electrode. The samples were illuminated with a 150 W quartz halogen lamp (Fiber-Lite DC950) which was coupled to a monochromator.
Computational Methodology. The present calculations were performed using the density functional theory (DFT)52,53 as implemented in the Vienna ab initio simulation package (VASP).54,55 Exchange and correlation were treated through the generalized gradient approximation (GGA) formalized by Perdew− Burke−Ernzerhof (PBE).56 The projector augmented plane wave (PAW) method57 was used to treat the core electrons. The Monkhorst−Pack (MP) scheme was used to generate the k-points grid. In the present calculations, a 9×9 ×5 k-point mesh forα- Cu2V2O7, a 9×9×7 k-point mesh forβ-Cu2V2O7andγ-Cu3V2O8, and a 9×7×5 k-point mesh forα-CuV2O6were used respectively for cell relaxation which gave well-converged results. A plane wave kinetic energy cutoff,Ecutof 500 eV forα-Cu2V2O7, 550 eV forβ- Cu2V2O7, 600 eV for γ-Cu3V2O8, and α-CuV2O6 were used respectively throughout the calculations. EffectiveUvalues (Ueff) of 3.1 and 5.0 eV were used for the strongly correlated d electrons of V and Cu, respectively. The visualization, VESTA, was used to visualize and analyze the crystal structure.58
Table 2. Concentration of precursor mixtures for different copper vanadates
concentration in precursor mixtures targeted ternary oxide
composition [Cu(NO3)2·2.5 H2O] [NH4VO3] [C6H4O5]
CuV2O6 0.25 M 0.50 M 0.75 M
Cu2V2O7 0.50 M 0.50 M 1.0 M
Cu3V2O8 0.75 M 0.50 M 1.25 M
Figure 1.Schematic diagram of the solution combustion synthesis process. Refer to refs1−4for further details.
ACS Applied Energy Materials
DOI:10.1021/acsaem.9b00179 ACS Appl. Energy Mater.XXXX, XXX, XXX−XXX C
3. RESULTS AND DISCUSSION
Malic acid served as both fuel and chelating agent in the precursor mixture for SCS. A possible mechanism of complexation can be inferred from earlier reports.59,60In this scheme, Cu(NO3)2and NH4VO3dissolved in the solution by forming their respective ions (eqs 7-8). Malic acid (MA) served as a chelating agent for these metal ions leading to the formation of a polymeric complex network (eq 9).
Cu(NO )3 2 →Cu2++2NO−3 (7) NH VO4 3 →NH+4 +VO3− (8) Cu2+−MA+ VO3−−MA→ −Cu2+−MA VO− −3−MA−
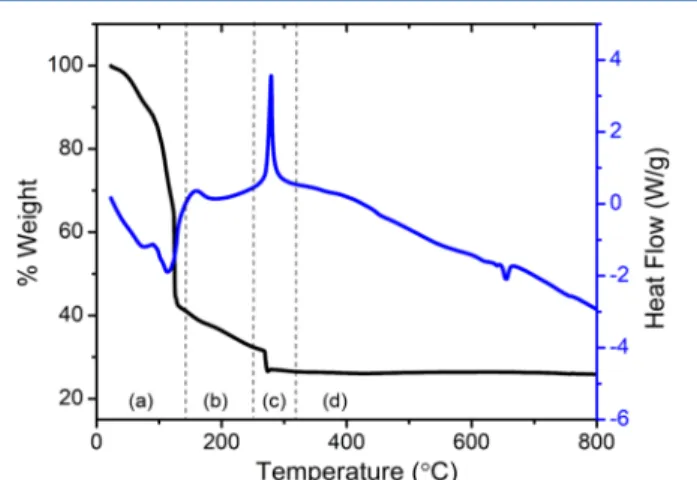
(9) Once the ignition temperature was attained, combustion of MA led to thermal breakdown of the complex and culminated in oxide formation. The SCS process can be simulated61,62by heating the precursor mixture in a TGA/DSC analysis environment; Figure 2 contains the TGA and DSC results for the formation of CuV2O6.
The TGA/DSC trace can be divided into four distinct regions: (a) evaporation of water, (b) complexation of ions (see above) and removal of hydrated water, (c) ignition and combustion and, (d) removal of any carbonaceous remnant as well as product anneal. Thefirst step was dehydration, which is an endothermic process and reflected in the DSC trace as a peak with negative heatflow. Once all the water evaporated, further heating caused removal of hydrated water and ionization-complexation of the precursor mixture which was then ignited (Region c) with a positive heatflow peak in DSC trace. In the case of CuV2O6, the ignition temperature appeared at∼280 °C. As the combustion reaction took place only for a short time (a few min), the as-synthesized sample contained a mixture of amorphous and crystalline compounds which upon further heating yielded well-defined crystalline products (see below).
The effect of different anneal temperatures on the as- synthesized CuV2O6sample is presented in the XRD data in Figure 3a. Annealing at 550°C showed a well-defined triclinic α-CuV2O6 phase along with the minority phase, α-Cu2V2O7. Increasing the anneal temperature to 600 °C resulted in a diminution of the α-Cu2V2O7 phase. Further increasing the anneal temperature to 610°C led to the formation of another
compound in admixture, assigned asβ-CuV2O6. Synthesis ofα- CuV2O6using electrospray and sol−gel methods also reported mixed phase oxides14,15 presumably arising from their similar thermal history.
On the other hand, Cu2V2O7 crystallized in two stable polymorphs, namely, low temperatureβ-Cu2V2O7(zeisite) and high temperatureα-Cu2V2O7(blossite) as shown inFigure 3b.
Notably, these phases were pure unlike in the CuV2O6 case above. Thermal anneal at 500°C for 1 h yielded a high purity β-polymorph which started transforming to α-polymorph at higher temperatures; complete transformation occurred at 610
°C. These observations on the SCS samples are consistent with earlier reports on Cu−V−O samples synthesized by other methods, which showed theβtoαtransition at 605−610°C.19 The SCS of Cu3V2O8showed behavior contrasting the other two compounds with lower Cu content. The as-synthesized sample showed mostly the crystalline phase of γ-Cu3V2O8 along with zeisite (β-Cu2V2O7) (Figure 3c). Although we expected the formation of the low-temperature polymorph,β- Cu3V2O8 (pseudolynsite),44 the formation of the high- temperature modification,γ-Cu3V2O8, was presumably favored by the SCS environment. Once we annealed the as-synthesized sample, zeisite (β-Cu2V2O7) transformed to blossite (α- Cu2V2O7). At 550 °C for 1 h, γ-Cu3V2O8 coexisted with both α- and β-Cu2V2O7, whereas at 600 °C complete conversion of β-Cu2V2O7 to α-Cu2V2O7 occurred. However, Cu2V2O7was always present in admixture withγ-Cu3V2O8, a trend which also corroborates previous reports which show thatγ-Cu3V2O8cannot be found as a single pure phase.25
Rietveld refinement was used to determine the crystal systems, unit cell parameters (Table S1), and compositions of different phases present in the SCS sample. Figure S1 represents the refinement of four compounds. For α- CuV2O6, the XRD pattern of the sample annealed at 600 °C was employed for the refinement while the XRD pattern ofγ- Cu3V2O8at 610°C was used for refinement. More details on the refinement results are presented inTable S2.
Briefly, Rietveld refinements of the XRD data for the different copper vanadate samples indicated that in the case of α-CuV2O6, there was a minority phase of α-Cu2V2O7 of
∼6.7%. Similarly,β-Cu2V2O7showed two minority phases,α- Cu2V2O7 andα-CuV2O6 to the extent of∼3.0% and ∼6.5%, respectively, along with the major phase β-Cu2V2O7. The γ- Cu3V2O8 sample also consisted of two minor phases, α- Cu2V2O7(6.1%) and Cu11V6O26(7.0%).Figure 3d shows the phase composition for the four SCS samples. Morphological characteristics of the annealed samples are presented inFigure S2; elemental analyses (via EDX) are contained inFigure S3 and Table S3.
Turning next to optical properties of the SCS samples, a structural analysis of the four copper vanadates was performed as a prelude to the DFT calculations.Figure 4 contains the structures on the left side panels.α-CuV2O6consists of CuO6 and VO6 octahedral layers (Figure 4a), while the crystal structures ofα-Cu2V2O7andβ-Cu2V2O7(Figures 4b, c) both share a common feature of CuO5square pyramids connected by V2O7(dimerization of two VO4tetrahedra). On the other hand,γ-Cu3V2O8(Figure 4d) contains a network of two types of Cu motifs: CuO5square-pyramids and CuO4square-planar units that are cross-linked by VO4tetrahedra. Similar structures may be found forα-, β-, andγ-Cu2V2O7in ref 37and for α- CuV2O6,β-Cu2V2O7,γ-Cu3V2O8, and Cu11V6O26in ref16.
Figure 2.Simulation of solution combustion synthesis using TGA/
DSC analysis for CuV2O6.
ACS Applied Energy Materials
DOI:10.1021/acsaem.9b00179 ACS Appl. Energy Mater.XXXX, XXX, XXX−XXX D
The electronic band structures and the partial density of states (PDOS), as estimated using the DFT + U method, are shown in Figure 4 (right-hand panels, e−h) for the four different copper vanadates (i.e., α-CuV2O6, α-Cu2V2O7, β- Cu2V2O7, and γ-Cu3V2O8, respectively.) Because the focus in this study was optical (rather than magnetic), no magnetic ordering was considered here unlike in the two precedent theoretical studies. As shown in the PDOS plots, all four phases have the V 3d states at the conduction band minima and the valence band maxima is mostly O 2p and Cu 3d states and they are strongly hybridized near the Fermi level.
Furthermore, the Fermi level is dominated by O 2p states forα-CuV2O6,β-Cu2V2O7, andγ-Cu3V2O8while Cu 3d states are the dominant contribution at the Fermi level for α- Cu2V2O7. These conclusions are in broad accord with the previous theoretical studies.16,39,47
For α-CuV2O6 and γ-Cu3V2O8, the bands were dispersive throughout all high symmetry points. For α-Cu2V2O7, the conduction band was less dispersive along the Y→ T → Z direction and along A1 →Y direction; both conduction and valence bands were less dispersive indicating the effective masses of the electrons and holes. For β-Cu2V2O7, both conduction and valence bands wereflat along the X→Y1→ H1 direction which also indicates that the carriers are“heavy.” For all the copper vanadates studied, the valence band was
composed of Cu 3d and O 2p and the conduction band was mostly V 3d states. Because the d−d transition is forbidden, the transition is predicted to occur from occupied O 2p to unoccupied V 3d states. It is worth noting here that among other copper vanadates α-CuV2O6 would be a prominent photoabsorber because of its direct bandgap and dispersed band on both valence band maxima and conduction band minima.
All the copper vanadates in this study showed indirect bandgaps exceptα-CuV2O6. The calculated indirect band gap values forα-Cu2V2O7,β-Cu2V2O7, andγ-Cu3V2O8were 2.12, 2.28, and 2.11 eV, respectively, whereas the direct band gap value for α-CuV2O6 was 1.89 eV. Diffuse reflectance spectroscopy was employed to experimentally determine the absorbance coefficient of these oxides (c.f.,Figure S4). While all the SCS samples strongly absorbed visible radiation, weak absorbance was detected below the absorption cutoff. Similar behavior was also found in the previous reports.25,26 The reason for the weak absorption is believed to be due to the on- site excitation of d-shell electrons into the half-filled Cu dx2‑y2 orbitals of Cu2+.25
Previous theoretical and experimental studies suggested that all these oxides have indirect bandgaps.16,25 However, α- CuV2O6 showed a direct transition in our theoretical study (see above) although the difference between indirect and Figure 3.XRD-patterns of as-synthesized samples (a) CuV2O6, (b) Cu2V2O7, (c) Cu3V2O8, and (d) phase compositions from Rietveld refinement.
In panels a−c, the minority components are marked with dashed lines.
ACS Applied Energy Materials
DOI:10.1021/acsaem.9b00179 ACS Appl. Energy Mater.XXXX, XXX, XXX−XXX E
direct bandgaps was very low (0.02 eV). Table 3 shows a comparison among the theoretical and experimental bandgaps
along with the reported literature bandgaps. Clearly, our experimental bandgaps agree well with theoretically derived Figure 4.Chemical structures (panels a−d) and electronic band structures and density of states (DOS) (panels e−h) forα-CuV2O6(a,e),α- Cu2V2O7(b,f),β-Cu2V2O7(c,g), andγ-Cu3V2O8(d,h). The unit cells are shown on panels a−d as dashed lines.
ACS Applied Energy Materials
DOI:10.1021/acsaem.9b00179 ACS Appl. Energy Mater.XXXX, XXX, XXX−XXX F
values as well as reported data in the literature on samples synthesized by other methods. The systematic discrepancy between the values derived from DRS and SPS (fourth and fifth columns inTable 3) will be addressed later.
The PEC activity of the four SCS-derived copper vanadate samples were evaluated using linear sweep voltammetry scan under chopped irradiation (Figure 5a). Sodium borate buffer (0.1 M, pH ∼ 9.2) was used as electrolyte due to improved stability of electrodes as suggested by previous reports.22,25 Linear sweep voltammograms were obtained sweeping the potentials from open circuit potential (OCP) to the positive directions. All four copper vanadates showed n-type photo- activity (positive photocurrents under reverse bias). Photo- current onset potentials were found as∼0.8 V versus RHE for all four copper vanadates. However, photocurrents were very low initially and slowly increased up to 1.0 V versus RHE.
Beyond this value, the photocurrents increased gradually with applied positive bias and finally saturation of photocurrents was achieved.
Photocurrents (inμA/cm2) at the thermodynamic oxidation potential of water (1.23 V versus RHE) were found to be 55, 30, 65, and 25 for α-CuV2O6,α-Cu2V2O7,β-Cu2V2O7, and γ- Cu3V2O8 respectively. Admittedly, these photocurrents were quite low; however, some of these values (55μA/cm2 forα- CuV2O6and 65μA/cm2forβ-Cu2V2O7) are 2-fold higher than the maximum reported photocurrent (25 μA/cm2 for α- CuV2O6 and 35 μA/cm2 for β-Cu2V2O7) under similar conditions.10These improved photocurrents are attributed to better crystallinity of these SCS-derived oxides as inferred from their XRD patterns. An alternative possibility is the presence of more oxygen vacancies in the samples, although this requires further experimental verification, beyond the scope of the present study.
Interestingly α-CuV2O6 showed very little photocurrent at low applied bias, however, the photocurrent increased drastically with applied bias more than 1.2 V versus RHE and attained a maximum value of∼400μA/cm2at 1.8 V versus RHE which is more than 2-fold higher than the other copper vanadates. A previous study28showed that surface states in Cu- rich vanadates are responsible for electron−hole recombina- tion; this would be in line with the good performance noted here with the Cu-lean vanadate sample. However, the exceptional high photocurrent of α-CuV2O6 can also be correlated with its electronic band structure (see Figure 4e) that shows a direct bandgap.
Moreover, the coordination of Cu and V in α- CuV2O6(CuO6 and VO6 octahedra) are different from the other three copper vanadates (CuO5 square-pyramid and/or CuO4 square-planar and VO4 tetrahedra) and hybridize differently. This structural nuance could contribute to a higher mobility of minority carriers through the α-CuV2O6 crystal lattice although a separate (solid-state transport) study (beyond the scope of this work) is required to validate this presumption.
Because of the sluggish kinetics of these oxides to water oxidation, photocurrent onset potentials were obtained from sulfite (a kinetically fast hole acceptor) oxidation with the addition of 0.1 M Na2SO3to the 0.1 M borate buffer; these data are shown inFigure 5b. The potentials were swept from a value, a little negative of the rest (open circuit) valuei in a positive direction to accurately record the photocurrent onset potentials (see inset inFigure 5b) The onset of photocurrents shifted toward more negative direction than water oxidation consistent with a previous report.10,22,25The onset potentials were found to be 0.72, 0.70, 0.69, and 0.66 V versus RHE for α-CuV2O6, α-Cu2V2O7, β-Cu2V2O7, and γ-Cu3V2O8 respec- tively. Approximating these onset potentials as the flat-band Table 3. Experimental and Calculated Bandgap Valuesaalong with Literature Data
experimental bandgap (eV)
oxide EF/eV theoretical bandgap (eV) DRS SPS reported experimental bandgap refs
α-CuV2O6 −4.91 1.89 (direct) 2.09 (direct) 2.07 1.76 1.96 10,12
α-Cu2V2O7 −4.93 2.12 2.13 1.86 1.9±0.1 16
β-Cu2V2O7 −4.85 2.28 2.22 1.94 2.0±0.2 10,16
γ-Cu3V2O8 −4.89 2.11 2.18 1.73 1.8±0.1 16,25
aAll the optical transitions are indirect unless otherwise noted.
Figure 5.Photovoltammogram under interrupted irradiation of the samples (a) in 0.1 M borate buffer solution (pH = 9.2), (b) 0.1 M borate buffer solution with 0.1 M Na2SO3(pH 9.2). All linear sweep voltammetry scans were performed under front side illumination with a scan rate of 1 mV/s.
Inset of (b) shows an extended view at the onset potential.
ACS Applied Energy Materials
DOI:10.1021/acsaem.9b00179 ACS Appl. Energy Mater.XXXX, XXX, XXX−XXX G
potentials afford estimates of theEFlevels of these oxides. As the conduction band is a few hundred millivolts more negative than the Fermi level,63all these oxides have conduction band minima in the range of 0.65−70 V versus RHE (Figure 6) in line with reported values.10,22,25
Importantly, note that none of the copper vanadate samples in this study are thermodynamically capable of generating hydrogen from water. This is seen from the fact that the Fermi levels in all the cases lie positive of the hydrogen evolution potential (Figure 6). On the other hand, the photogenerated holes in all the cases will have sufficient energy to oxidize water.
The relative insensitivity of the band edge positions as a function of chemical composition in the Cu−V−O system deserves comment. Scrutiny of the conduction band edge position does reveal a slight but systematic shift with greater Cu/V ratio: 0.72, 0.70, 0.69, and 0.66 V versus RHE for α- CuV2O6,α-Cu2V2O7,β-Cu2V2O7, andγ-Cu3V2O8, respectively.
On the other hand, the valence band edge of V2O5is derived from O 2p orbitals and lies at ∼3.0 V versus NHE. On incorporation of Cu, Cu 3d9hybridizes with O 2p and“lifts” the valence band edge to∼2.6 V versus NHE. However, the conduction band edges of both V2O5and copper vanadates are made of V 3d orbitals and hence they lie in similar positions (0.5−0.6 V versus NHE).
The optoelectronic properties were further investigated with Kelvin-probe measurements and surface photovoltage spec- troscopy (Figure 7a,b). TheEFof the various copper vanadate
samples were estimated from their contact potential differences (CPD),Figure 7a. The purple dashed lines in Figure 6show the correspondingEFfor each oxide which lie close to theflat- band potential values, determined from the photovoltammo- grams (seeFigure 5), as expected for reasonably doped n-type semiconductors.
The wavelength-dependence of light driven charge separa- tion was monitored by SPV measurements. All spectra show negative photovoltage values (Figure 7b), which can be associated with the transfer of electrons to the ITO layer.64 These data show (and corroborate the trends inFigure 5) that all samples behave as n-type semiconductors.64−66The highest photovoltage was recorded in the case of the γ-Cu3V2O8 sample (≈ −130 mV). Interestingly, this trend was not reflected by the photovoltammograms where γ-Cu3V2O8gave the lowest photocurrents. Since the buildup of photovoltage is connected to both charge separation and transport in the electrode bulk, these data suggest that the reason behind the poor PEC performance is rooted in the sluggish water/sulfite oxidation kinetics on the surface.
Bandgap values (EBG) were determined from the photo- voltage onset on the SPV spectra (Table 3). These are consistently lower than the values derived from our diffuse reflectance spectroscopy data, but much closer to those reported in the literature. These systematic differences are possibly linked to the higher sensitivity of SPV to sub-bandgap transitions67and to the bandwidth of the monochromatic light (i.e., 40 nm).
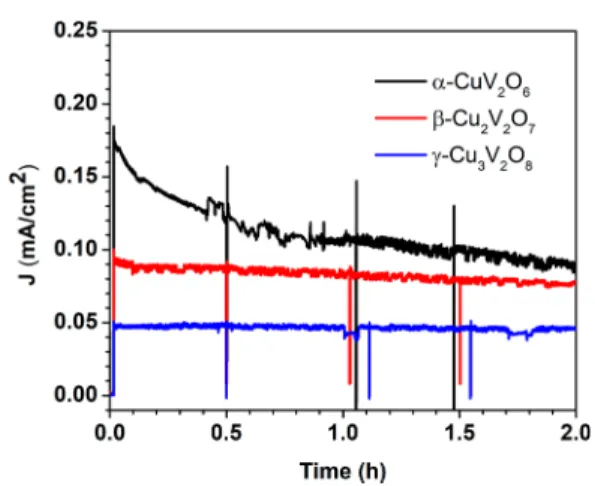
Finally, the PEC stability of three SCS-derived copper vanadate samples with increasing Cu/V ratio, was compared (Figure 8). These chronoamperometric data pertain to afixed potential of 1.4 V versus RHE under 100 mW/cm2irradiation.
The photocurrent for theα-CuV2O6sample decreased sharply at the beginning and∼30% of the photocurrent loss took place during thefirst 30 min. After that time frame, the photocurrent appeared quite stable for at least another 2 h at which time the experiment was discontinued (black curve,Figure 8). On the other hand, the photocurrent forβ-Cu2V2O7showed a sharp fall during thefirst 5 min, then slowly decreased and∼20% of photocurrent was lost after 2 h (red curve, Figure 8). In contrast, photocurrent loss forγ-Cu3V2O8was negligible after 2 h.
Importantly, this study shows that a higher Cu/V ratio in the copper vanadate compositions renders better PEC stability for the corresponding oxide. We attribute the sharp loss of Figure 6.Band-edge positions based on experimental photocurrent
onsets for the four copper vanadate samples considered in this study.
Purple dashed lines show Fermi levels derived from the contact potential difference measurement.
Figure 7.Contact potential difference (CPD) (a) and surface photovoltage spectra (b) for the four copper vanadate samples.
ACS Applied Energy Materials
DOI:10.1021/acsaem.9b00179 ACS Appl. Energy Mater.XXXX, XXX, XXX−XXX H
photocurrent for α-CuV2O6 to initial photoleaching of vanadium leaving behind a CuO layer on the surface.68 Thus, CuO acts as a passive layer for the film, suppressing further corrosion of vanadium from the bulk matrix.68 Accordingly, the V/Cu ratio in the electrolyte solution after the stability experiment was analyzed using ICP-AES which confirmed the presence of four-times higher V than Cu in the solution. This observation is entirely consistent with the stabilization mechanism proposed by previous authors.68
■
CONCLUSIONSThe main contribution of the present study and its differentiator from the considerable number of reports that have emerged on copper vanadates is the demonstration that a range of molar stoichiometries from 1:1 to 3:1 in this compound family can be derived simply by tuning the precursor mole ratio in the solution combustion synthesis procedure. Importantly, SCS is very time-efficient and the various compositions can be obtained in a matter of minutes (as opposed to hours or even days in classical solution-based or ceramic synthesis routes, Table 1). In this regard, SCS is eminently suited for incorporation into the high throughput screening methods16,27that have been deployed for the Cu− V−O family of n-type semiconductors. A secondary feature of this study is that it builds upon the corpus of structural, electronic, and optoelectronic body of information on copper vanadates, derived from a variety of synthetic procedures (c.f., Table 1). While a number of attributes of these family of compounds are appealing from a solar fuels materials design perspective, their charge transport characteristics (limited by small-polaron hopping)69 certainly would need further optimization, beyond the scope of this particular study.
■
ASSOCIATED CONTENT*S Supporting Information
The Supporting Information is available free of charge on the ACS Publications websiteat DOI:10.1021/acsaem.9b00179.
Rietveld refinement of XRD data for α-CuV2O6, β- Cu2V2O7,γ-Cu2V2O7, andα-Cu3V2O8, SEM and energy dispersive X-ray analysis (EDX) data, V/Cu ratios for the various samples, diffuse reflectance spectra (PDF)
■
AUTHOR INFORMATION Corresponding Author*E-mail:rajeshwar@uta.edu.
ORCID
Robin T. Macaluso:0000-0002-0021-0775
Mohammad N. Huda:0000-0002-2655-498X
Csaba Janáky: 0000-0001-5965-5173
Krishnan Rajeshwar:0000-0003-4917-7790 Notes
The authors declare no competingfinancial interest.
■
ACKNOWLEDGMENTSC.J. and A.K. acknowledge the support of the“Széchenyi 2020” program within the framework of the GINOP-2.3.2-15-2016- 00013 project. M.T.G. and C.L. acknowledge CAPES-PDSE (Process#88881.131530/2016-0) for partialfinancial support under the Coordenação de Aperfeiçoamento de Pessoal de Nivel Superior Program. M.N.H. was supported by thé National Science Foundation (Award No. DMR-1609811).
M.N.H. and H.P.S. thank the Texas Advanced Computing Center (Austin, TX) facility for their computational needs.
The authors thank the three anonymous reviewers for perceptive comments on an earlier version of this manuscript.
■
(1) Merzhanov, A. G. The Chemistry of Self-Propagating High-REFERENCES Temperature Synthesis.J. Mater. Chem.2004,14, 1779−1786.(2) Rajeshwar, K.; de Tacconi, N. R.; Chanmanee, W. Combustion Synthesis of Oxide Semiconductors for Solar Energy Conversion and Environmental Remediation.Chem. Soc. Rev.2009,38, 1984−1998.
(3) Hossain, M. K.; Kecsenovity, E.; Varga, A.; Molanar, M.; Janaky, C.; Rajeshwar, K. Solution Combustion Synthesis of Complex Oxide Semiconductors.Int. J. Self-Propag. High-Temp. Synth.2018,27, 129−
140.
(4) Li, F. T.; Ran, J.; Jaroniec, M.; Qiao, S. Z. Solution Combustion Synthesis of Metal Oxide Nanomaterials for Energy Storage and Conversion.Nanoscale2015,7, 17590−17610.
(5) Wen, W.; Wu, J. M. Nanomaterials via Solution Combustion Synthesis: A Step Nearer to Controllability. RSC Adv. 2014, 4, 58090−58100.
(6)Solar Hydrogen Generation: Toward a Renewable Energy Future;
Rajeshwar, K., McConnell, R., Licht, S., Eds.; Kluwer Academic: New York, 2008.
(7) Rajeshwar, K. Photoelectrochemistry and the Environment. J.
Appl. Electrochem.1995,25, 1067−1082.
(8) Rajeshwar, K.; Hossain, M. K.; Macaluso, R. T.; Janáky, C.;
Varga, A.; Kulesza, P. J. Copper Oxide-Based Ternary and Quaternary Oxides: Where Solid-State Chemistry Meets Solar Fuels.J. Electro- chem. Soc.2018,165, H3192−H3206.
(9) Hillel, T.; Ein-Eli, Y. Copper Vanadate as Promising High Voltage Cathodes for Li Thermal Batteries. J. Power Sources2013, 229, 112−116.
(10) Guo, W.; Chemelewski, W. D.; Mabayoje, O.; Xiao, P.; Zhang, Y.; Mullins, C. B. Synthesis and Characterization of CuV2O6 and Cu2V2O7Two Photoanode Candidates for Photoelectrochemical Water Oxidation.J. Phys. Chem. C2015,119, 27220−27227.
(11) Newhouse, P. F.; Boyd, D. A.; Shinde, A.; Guevarra, D.; Zhou, L.; Soedarmadji, E.; Li, G.; Neaton, J. B.; Gregoire, J. M. Solar Fuel Photoanodes Prepared by Inkjet Printing of Copper Vanadates. J.
Mater. Chem. A2016,4, 7483−7494.
(12) Khan, I.; Qurashi, A. Shape Controlled Synthesis of Copper Vanadate Platelet Nanostructures, Their Optical Band Edges, and Solar-Driven Water Splitting Properties.Sci. Rep.2017,7, 14370.
Figure 8.Chronoamperometric measurements of copper vanadates at 1.4 V versus RHE in 0.1 M sodium borate buffer (pH 9.2) under 100 mW/cm2irradiation.
ACS Applied Energy Materials
DOI:10.1021/acsaem.9b00179 ACS Appl. Energy Mater.XXXX, XXX, XXX−XXX I