DOI: 10.1556/606.2019.14.3.7 Vol. 14, No. 3, pp. 63–74 (2019) www.akademiai.com
VISIBILITY STUDIES AT ROUNDABOUTS ENTRIES
1 Zsófia MAGYARI*, 2 Csaba KOREN
1,2 Department of Transport Infrastructure, Faculty of Architecture, Civil Engineering and Transport Sciences, Széchenyi István University, Egyetem tér 1, H-9026 Győr
Hungary, e-mail: 1mzsofi@sze.hu, 2koren@sze.hu Received 19 July 2018; accepted 12 March 2019
Abstract: Most accidents in roundabouts occur at the entries, partly due to poor visibility. To analyse this problem a sample roundabout with some visibility obstacles was measured by laser scanner and data were put into a 3D model. The fields of view were studied from the viewpoint heights of car and truck drivers as well. To assess the results, three indicators were defined: the hidden sight distance, the hidden sight triangle area and the angle of hide. These indicators were measured in the point cloud model. Through these indicators the adequacy of visibility conditions can be assessed.
Keywords: Road safety, Visibility at roundabouts, Site distance triangle, Angle of view
1. Introduction
Intersections are dangerous part of the road network because paths of different vehicles can cross each other here. Approaching to intersections drivers have to collect information about the traffic regulation, positions of other vehicles and decide quickly about entering the junction or not. If parts of the junctions are hidden, this could be a risky manoeuvre. The purpose of this paper is to investigate visibility at roundabouts and to define indicators helping the assessment of general adequacy of visibility conditions of road junctions.
*
2. Safety aspects of roundabouts
Roundabouts are simpler and safer than other types of intersections. By reconstructing critical intersections into roundabouts, many benefits can be gained but the practice still brings up some design weaknesses as well. The following list contains the main characteristics of this node type.
Advantages of roundabout
• The roundabout can accommodate high traffic volumes;
• The maintenance costs are favourable;
• Road users can easily understand the Highway Code rules;
• Fewer conflicting spots then in other types of junctions;
• Vehicles have to reduce their speed before entry;
• In roundabouts there are less crashes with injuries compared to intersections with stop or yield signs.
Disadvantages of roundabout
• It is required to pay attention to two directions: circulating stream and entering stream;
• It is hard to estimate real speeds due to the circular path;
• Effect of possible visibility obstacles;
• Bicycle and pedestrian crossings are reducing high traffic capacity.
Although many studies have shown the positive impact of the establishment of roundabouts on road safety, statistical data show that there are still some types of accidents occurring more frequently than others. Table I contains accident data at roundabouts in Hungary for the past ten years [1]. As the numbers show the highest proportion of accidents takes place at the entries of intersections. The following chapters are describing the relevant guidelines and then dealing with visibility difficulties at roundabouts.
Table I
Vehicle accidents at roundabouts in Hungary (2007 - 2016) (own collection from [1])
Accident type Number of
accidents
Percentage of accidents Crashes between vehicles in the circulatory roadway and
entering vehicles. 418 40%
Crashes between vehicles in in the circulatory roadway
and vehicles leaving this. 136 13%
Run-off-road accidents. 165 16%
All other types of accidents. 316 31%
3. Guidelines related to roundabout entry visibilities
Different countries use various approaches to roundabout visibility investigations.
The Hungarian solution is similar to the United States one. Roundabout sight distance ensures that drivers can safely enter the junction without disturbing the traffic flow within the circulatory roadway. The entry field of view is analysed from 15 meters before the intersection.
The left legs of the sight distance ‘triangle’ are based on two conflicting approaches that are typically checked independently. First (d1): ‘Entering stream, comprised of vehicles from the immediate upstream entry. The speed for this movement can be approximated using the average of the entering speed and circulating speed.’ Second:
(d2): ‘Circulating stream, comprised of vehicles that entered the roundabout prior to the immediate upstream entry. This speed can be approximated the speed of left turning vehicles’, [2].
Fig. 1 shows the two directions of sight distances and the manuals can give the value of their lengths.
Fig. 1. Sight distances at roundabouts (Source: Author)
According to another approach, the sight distance depends on the inscribed diameter; this approach is applied for example in the UK and in Austria. An interesting point can be found in the UK design manual: ‘Excessive visibility to the right (with left- hand traffic!) can result in high speeds, potentially leading to accidents’, [3].
4. Characterization of visibility obstacles with numbers
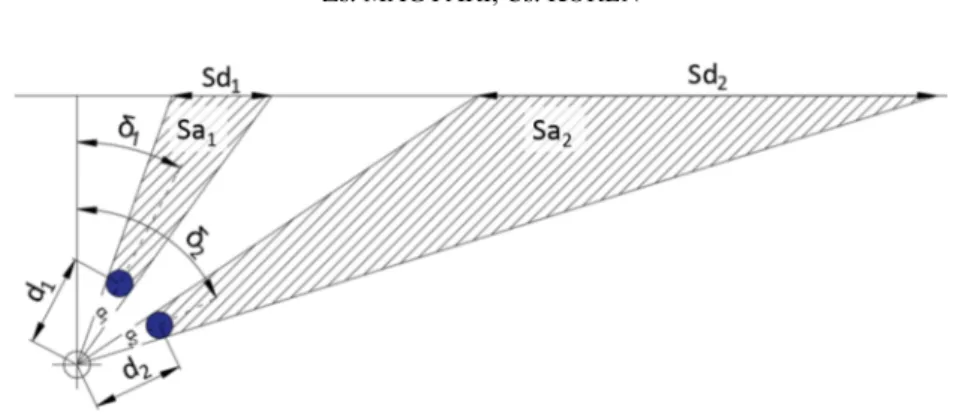
Knowing the layout of the junction and having some visibility obstacles, some indicators can be defined and measured. These are the hidden part of sight distance (Sd), and the hidden area (Sa), which are giving valuable information about safe entry to the junction. Furthermore, two angles can be defined to analyse the visibility obstacles to get more details (Fig. 2).
Fig. 2. Indicators to visibility investigation (Source: Author)
The angle of the hidden part (α) is a central angle for each object that shows how each obstacle reduces the field of view. From two same sized objects the closer one causes larger hide. From two same sized objects at same distance, the one on the edge of the field of view creates larger hidden length. The length hidden by the circle to the right is larger than the hidden length by the first one. For details the directional angle (δ) can be calculated as well [4].
The next chapters present these four indicators in an example of roundabout visibility investigation.
5. Roundabout visibility survey with laser scanner
The laser scanner surveys the surroundings with a high frequency laser range signal and stores the distance of returned signs and the spatial angles. The result is a point cloud - a virtual copy of the original area - where each object can be recognized [5].
Laser scanning is a great method to investigate the road junction because the instrument does not disturb the traffic and gives three dimensional detailed results [6].
Photogrammetry is another option to producing point clouds. Creating images with Unmanned Aerial Vehicle (UAV) cameras can also be used to produce a spatial model of an intersection. The precision of this model does not approach that of the laser scanner, but it is sufficient for visibility investigations [7].
5.1. The investigated roundabout
The investigated roundabout is located in Győr close to Széchenyi István University.
Due to some problems is hard to enter the roundabout from the West side leg marked with an arrow (Fig. 3). On one hand traffic volume from the North direction is quite high and on the other hand, the inscribed circle diameter is large, so that cars can move fast in N-S direction. Besides the high speed, the some critical parts of the roundabout are hidden.
Fig. 3. Roundabout at Kálóczy Square (Source supplemented with Author’s markings:
© OpenStreetMap contributors, openstreetmap.org/copyright) 5.2. Survey and point cloud process
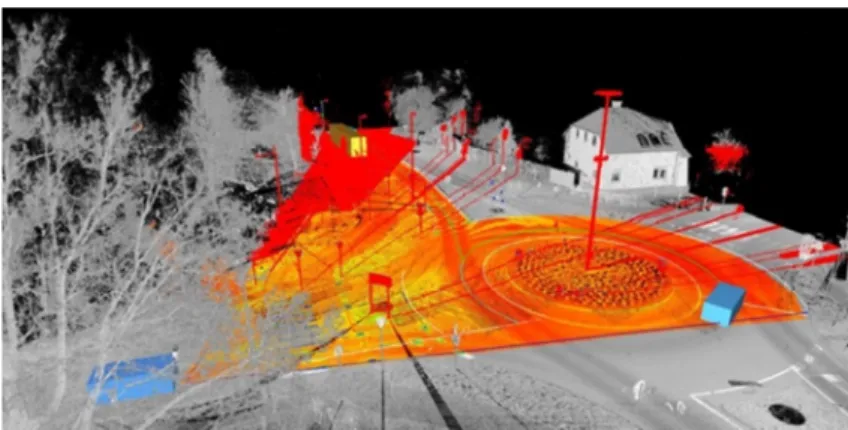
The roundabout was investigated with a Leica HDS6200 laser scanner. Its maximal range of distance is 80 meters but to reach a continuous point cloud from pavement 35 - 40-meter length was used between stations. The total numbers of stations was 12 and two people were working on the site four-hour long. The recording was executed twice at all stations, in order to avoid that moving objects (vehicles) hide important parts of the field and make data ‘noisy’ (Fig. 4).
Fig. 4. Point cloud with data noise of vehicles (Source: Author)
To prepare the three-dimensional model, Leica Cyclone software was used. After the data import from the instrument, each record was matched with identic points. Later the data noise caused by vehicles was removed and for the last step the point density was
reduced to simplify the processing tasks. The results were suitable for modelling different traffic situations and for visibility analysis.
There are several point cloud processing programs available. For example CloudCompare is an open-source software, which contains a plugin called Hidden Point Removal, which is suitable for visibility analyses. The Cyclone from Leica belongs to the instrument, which was used for the survey. The software produces an own file type (ZFS), which cannot be directly imported by the open source software, therefore Cyclone was used [8]. The Cyclone point cloud processing software has a drawing module and it is also suitable to edit the field of view.
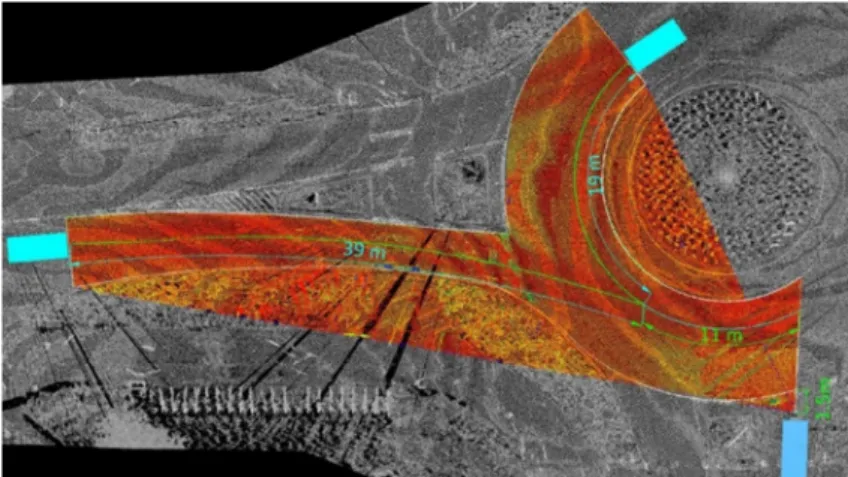
6. Visibility analysis in point cloud
The Hungarian guideline: Design of Intersections (e-UT 03.03.21) makes a difference between two situations. First when the driver has to stop before entering the intersection that is the starting field of view (Fig. 5). The second situation is the approaching field of view when the driver does not have to stop to decide whether to cross or not (Fig. 6). In the test case an obstacle (a stopped articulated bus) was placed in the model in the bus stop, which is in the sight triangle area. The pictures show the required sight triangle area as well as the cars as boxes and the bus as a longer box.
These two situations were analysed from two driver eyes’ height: 1.05 m (car) and 2 m (truck) [9].
Fig. 5. Starting field of view (Source: Author)
6.1. The required sight distances
The required sight distances (d1 and d2 in Fig. 1) are depending on the speed of the main stream. In this case the speed was supposed to be 40 km/h from the entering directions and 25 km/h in the circular roadway as the design speed corresponding to the radius [10].
The Design of Roundabouts (e-UT 03.03.11) does not give clear values or method to calculate the required sight distances at roundabouts; it just refers to connections with speed, therefore starting field of view parameters were used belonging to priority intersections. As a result, the entering stream leg of the triangle (d1) was set at 50 meter, and the circulating leg (d2) was 30 m. The lengths d1 and d2 have a combined section, which is 11 meter long [9], [10].
The approaching field of view (Fig. 6) was calculated according to the American guideline ‘Roundabouts: An informational Guide’. The US manual gives a formula to calculate sight , which depending on the speed and using a 6.5 second critical time gap.
The resulting d1 is 72.3 meter and d2 is 45.2 meter in this case [2].
Fig. 6. Approaching field of view (Source: Author)
The Hungarian guideline does not explicitly mention the critical time gap, which is the time between two vehicles on the main road needed to cross the junction safely, but it can be back-calculated by dividing the sight distance [m] by the speed [m/s].
In the starting situation if d1 is 50 m and the speed, v1 is 40 km/h (11.12 m/s), the required time gap is 4.5 seconds and if d2 is 30 m and v2 25 km/h (6.95 m/s), the time gap is 4.3 seconds. Consequently, from the starting situation the required time gap is about two second less than that in the approach situation where the required time gap is 6.5 seconds and the approaching vehicle is in 15 meters distance from the entry.
6.2. Visibility measurements
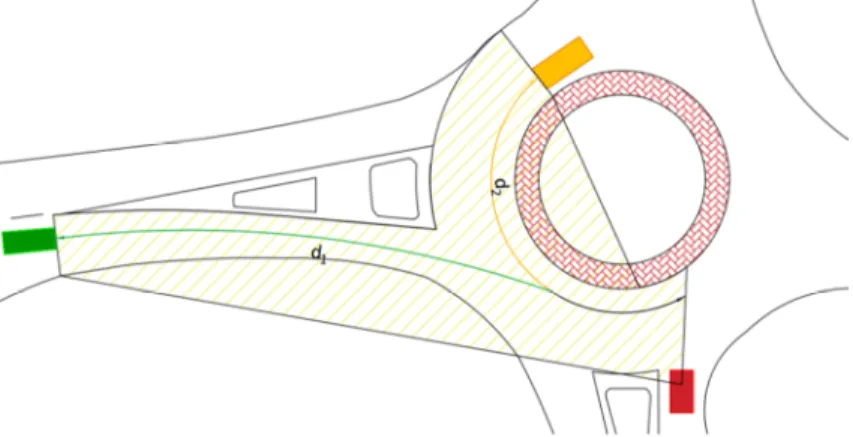
The four indicators shown in Fig. 2 have to be interpreted in roundabout geometry.
Fig. 7 shows these indicators applied to roundabouts.
To the visibility investigation first the 3D view points of the drivers were set, and then all object points were selected, which are in the area of the required sight triangle (Fig. 8). This is a three-dimensional procedure therefore all points were selected, which was behind the obstacles as a shadow from the view point, so each object and their hides are recognizable [11].
Fig. 7. Visbility indicators in roundabouts (Source: Author)
Fig. 8. Hides of visbility obstacles (Source: Author)
Before the survey each object or group of objects, which were supposed to be obstacles from the viewpoint, were labelled with a number to help identify them. The following list in Table II contains the obstacles shown in Fig. 9.
Table II List of visbility obstacles 1. Parking cars, parking bus,
bicycle parking; 6. Bicycle path sign –
3; 11. Széchenyi István
University panel – 2;
2. Bicycle path sign – 1; 7. Roundabout and
yield control sign; 12. Large street lamp in the middle of roundabouts;
3. Bicycle path sign – 2; 8.
Széchenyi István University panel – 1;
13. Directional sign – 3;
4. Street lighting pole with
pedestrian crossing sign; 9. Directional sign – 1; 14. Directional sign – 4;
5. Bicycle no entry sign; 10. Directional sign – 2; 15. Directional sign – 5.
Fig. 9. Visbility obstacles (Source: Author)
The results of visibility analysis were imported to the AutoCAD Help with AutoCAD Recap, where measurements can be taken by the dimensions function (Fig. 10).
Fig. 10. Visbility measurement in case of starting field of view (Source: Author) The hidden parts of sight distances were surveyed along the sight distances lines.
The hidden parts of sight triangle area were identified by considering the visibility obstacles. In case of starting field of view the area hidden by object No3 was found in the required free area, but it does not intersect the line of sight distance, therefore in Table II some values (Sd and δ) are missing. The directional angles were measured from the right sight field of view. The average of the angles of both legs gave the directional angles and their differences are the angles of hides.
7. Results
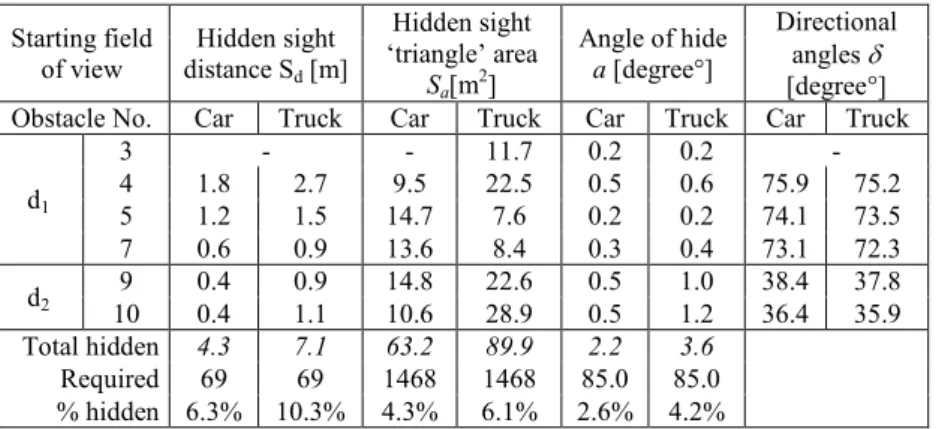
The measurements are summarised in Table III and Table IV. The two major directions, the entering and the circulating stream have a common part which is 11 meters long, therefore is not possible to separate them clearly, so the summary of the tables includes the both directions together. When summing the required sight distances, the common part was taken just once in consideration (d1+d2-11). The required fields should be free of any visibility obstacles to safely cross the roundabouts.
In case of cars the total values of all indicators stayed under ten percent of the required value. For trucks where the driver’s eye height is two meters, the hidden percentage was higher. This can be explained by the position of traffic signs. The car drivers can see under the traffic signs, for them only the narrow poles are obstacles.
Table III
Results of visibility measurements in the starting field of view situation Starting field
of view
Hidden sight distance Sd [m]
Hidden sight
‘triangle’ area Sa[m2]
Angle of hide a [degree°]
Directional angles δ [degree°]
Obstacle No. Car Truck Car Truck Car Truck Car Truck d1
3 - - 11.7 0.2 0.2 -
4 1.8 2.7 9.5 22.5 0.5 0.6 75.9 75.2
5 1.2 1.5 14.7 7.6 0.2 0.2 74.1 73.5
7 0.6 0.9 13.6 8.4 0.3 0.4 73.1 72.3
d2 9 0.4 0.9 14.8 22.6 0.5 1.0 38.4 37.8
10 0.4 1.1 10.6 28.9 0.5 1.2 36.4 35.9 Total hidden 4.3 7.1 63.2 89.9 2.2 3.6
Required 69 69 1468 1468 85.0 85.0
% hidden 6.3% 10.3% 4.3% 6.1% 2.6% 4.2%
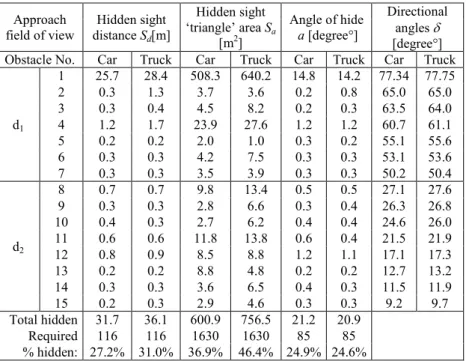
In the approach field of view (Table IV) there are more objects in the sight of view.
Most of them are traffic signs, which usually do not form a large obstacle, but in case of multiple signs next to each other from the view point, the hidden part can be larger, e.g.
the street lighting pole and yield control sign marked 4. They can together hide more than one meter from the sight field (which is enough to cover a pedestrian).
Obstacle No. 1 is a group of objects, being close together (parking cars, bus stop, bicycle parking, and articulated bus). These objects seem to be just at the edge our view of angle, but together they cause a large hide. They are reducing the required sight distance by 25 meter and shadowing thirty percent of the area.
8. Conclusion
Laser scanner is a practical tool to create 3D models for road visibility surveys. The sample survey required a half day measurement and a half day data preparation processing. Although the traffic was not disturbing the survey, it would be better to have shorter measurement times, in order to reduce data noise caused by vehicles.
Fitting the records from different spots into one model and filtering noise of it are partly automated tasks which required strong computing resources. The resulting 3D point cloud gives sufficient details for visibility analysis.
Table IV
Results of visibility measurements in the of approach field of view situation Approach
field of view
Hidden sight distance Sd[m]
Hidden sight
‘triangle’ area Sa
[m2]
Angle of hide a [degree°]
Directional angles δ [degree°]
Obstacle No. Car Truck Car Truck Car Truck Car Truck
d1
1 25.7 28.4 508.3 640.2 14.8 14.2 77.34 77.75
2 0.3 1.3 3.7 3.6 0.2 0.8 65.0 65.0
3 0.3 0.4 4.5 8.2 0.2 0.3 63.5 64.0
4 1.2 1.7 23.9 27.6 1.2 1.2 60.7 61.1
5 0.2 0.2 2.0 1.0 0.3 0.2 55.1 55.6
6 0.3 0.3 4.2 7.5 0.3 0.3 53.1 53.6
7 0.3 0.3 3.5 3.9 0.3 0.3 50.2 50.4
d2
8 0.7 0.7 9.8 13.4 0.5 0.5 27.1 27.6
9 0.3 0.3 2.8 6.6 0.3 0.4 26.3 26.8
10 0.4 0.3 2.7 6.2 0.4 0.4 24.6 26.0
11 0.6 0.6 11.8 13.8 0.6 0.4 21.5 21.9
12 0.8 0.9 8.5 8.8 1.2 1.1 17.1 17.3
13 0.2 0.2 8.8 4.8 0.2 0.2 12.7 13.2
14 0.3 0.3 3.6 6.5 0.4 0.3 11.5 11.9
15 0.2 0.3 2.9 4.6 0.3 0.3 9.2 9.7
Total hidden 31.7 36.1 600.9 756.5 21.2 20.9
Required 116 116 1630 1630 85 85
% hidden: 27.2% 31.0% 36.9% 46.4% 24.9% 24.6%
Using 3D model helps to describe objects more accurately than 2D views, for instance the narrower, upward widening objects (trees, traffic signs).
The following observations can be made after the evaluation of the presented indicators. The length of hidden part of sight distance is a good parameter to characterize the effect of obstacles. The size of the hidden area does not give new information for the analysis. The angles of hide help to group the effects of similar objects.
The defined indicators (percentage of hidden length and hidden angles) are able to assess the general adequacy of visibility of road junctions and at the same time the individual obstacles or obstacle groups can be identified and evaluated.
There are more possibilities to further research: the first is to investigate the opportunity of using the three dimensional counterparts of these indicators. Another direction is the automatization of the analyses in point clouds, as mobile laser scanners are able to effectively collect measurements data from whole settlements. Therefore the visibility of intersections would be quickly verifiable in a 3D environment.
Acknowledgements
This work has been sponsored by the EFOP-3.6.1-16-2016-00017 project at Széchenyi István University.
Open Access statement
This is an open-access article distributed under the terms of the Creative Commons Attribution 4.0 International License (https://creativecommons.org/licenses/by/4.0/), which permits unrestricted use, distribution, and reproduction in any medium, provided the original author and source are credited, a link to the CC License is provided, and changes - if any - are indicated. (SID_1)
References
[1] WEB-BAL software homepage, http://91.120.23.53/webbal_kkk/DBSCANBlackSpot.aspx, (last visited 1 December 2017).
[2] Robinson B. W., Rodegerdts L., Scarborough W., Kittelson W., Troutbeck R., Brilon W., Bondzio L., Courage K., Kyte M., Mason J., Flannery A., Myers E., Bunker J., Jacquemart G. Roundabouts: An informational guide, Federal Highway Administration, June 2000 [3] The Highways Agency: Geometric design of roundabouts, Vol. 6, Section 2, Part 3, TD
16/07, UK 2007.
[4] Magyari Zs. Connetions between visibility difficulties at road junctions and accidents, (in Hungarian) Műszaki Katonai Közlöny, Vol. 2018/1, 2018, pp. 49‒59.
[5] Berényi A. Laser scanning in engineering survey - an application study, Pollack Periodica, Vol. 5, No. 2, 2010, pp. 39‒48.
[6] Hegyi P., Mester M. Support of road safety on-site investigations with terrestrial laser scanners, in: Koren Cs. (Ed.) Safety of road infrastructure, (in Hungarian) Universitas- Győr, Nonprofit Kft, Győr, 2012.
[7] Somogyi Á., Lovas T., Barsi Á. Comparison of spatial reconstruction software packages using DSLR images, Pollack Periodica, Vol. 12, No. 2, 2017, pp. 17‒27.
[8] Katz S., Tal A., Basri R. Direct visibility of points sets, ACM Transactions on Graphics, Vol. 26, No. 3, 2007, Paper No. 24.
[9] Fi I., Golarits P., Kőrössy G., Takács F. Design of intersections, (in Hungarian) Hungarian Road Society, Budapest, 2004.
[10] Tóthné T. K., Érsek L., Hegyi Z., Hóz E., Maklári J., Mihályka P., Mocsári T., Rankli K., Rigó M. Design of roundabouts, (in Hungarian) Hungarian Road Society, Budapest, 2010.
[11] Mester M. Road junction visibility investigation with terrestrial laser scanners, (in Hungarian) MSc Thesis, Széchenyi István Egyetem, Győr, 2012.