Published online: http://hae-journals.org/
HU ISSN 0864-7410 (Print) / HU ISSN 2415-9751(Online) DOI: 10.17676/HAE.2020.38.5
Received: 01.07.2020 - Accepted: 01.10.2020
ENGINEERING OF
THE HUNGARIAN ACADEMY OF SCIENCES and
SZENT ISTVÁN UNIVERSITY Faculty of Mechanical Engineering
IMPROVEMENT OF THE BSC MODEL WITH KPI-TREE METHOD THROUGH A DAIRY FARM CASE STUDY
Author(s):
S. Gáspár1, M. Czikkely2, G. Thalmeiner3 Affiliation:
1Institute of Finance, Accounting and Controlling, Faculty of Economy and Social Science, Szent István University Páter K. u. 1., Gödöllő, H-2103, Hungary
2Climate Change Economics Research Centre, Faculty of Economy and Social Science, Szent István University Páter K. u. 1., Gödöllő, H-2103, Hungary
3Institute of Finance, Accounting and Controlling, Faculty of Economy and Social Science, Szent István University Páter K. u. 1., Gödöllő, H-2103, Hungary
Email address:
sandor.gaspar@gtk.szie.hu, czikkely.marton@gtk.szie.hu, thalmeiner.gergo@gtk.szie.hu
Abstract: In the dairy sector, the operation of the various control systems operates at the strategic level in the same way as other industries, but at the level of the task control, they operate specifically way. The Balance Scorecard is an excellent tool for measuring our strategic performance, but does not necessarily provide a clear feedback on causality and subsystems related to indicators. In our research, we highlight the deficiencies and the development possibilities of the balance scorecard through the operation process and conrol system of a dairy farm operating in Hungary. The model will be further developed using the KPI-tree method, which will be illustrated in through an example of a causal relationships with a financial KPI.
Keywords: agribusiness, dairy sector, balance scorecard, control system, KPI-tree 1. Introduction
Controlling as an important branch of management science today is undergoing extensive and widespread change. Different mathematical and IT solutions enable organizations to be able to extend their systems holistically. It is necessary to retrieve information from the information accumulated by information systems through various structures, which, by their weaponry, facilitate management decision-making and thus lead to more productive, more efficient organizational operations. Agriculture is a specialized industry, but the various management functions work the same here. Modern management tools and methods are also effective in planning, controlling and strategy making. In the case of task control and management control, different methodologies can, in many cases, create deterministic circumstances due to industry regulation and operation under these rules. In such an environment, these modern systems have the highest efficiency. In the dairy cow sector, the operation of control systems is very specialized at task control levels, but at higher levels this specialized character disappears. For organizations operating in the dairy sector, information systems are well established and sector specific. Strategic control systems (BSCs in particular) are quite common in the industry, but in most cases between measurement points and strategic control systems is lacking the level of task control.
In this study, we present a case study and model development in which the BSC model of a dairy farm is led through a causal structure of a given KPI and a variety of metrics and ratios up to different metering points. The methodology for the extension is KPI-tree, which is a well-functioning information system. With dynamic data uploads, it can provide management with continuous feedback on both organizational performance and intervention points for a given time period.
2. Literature processing
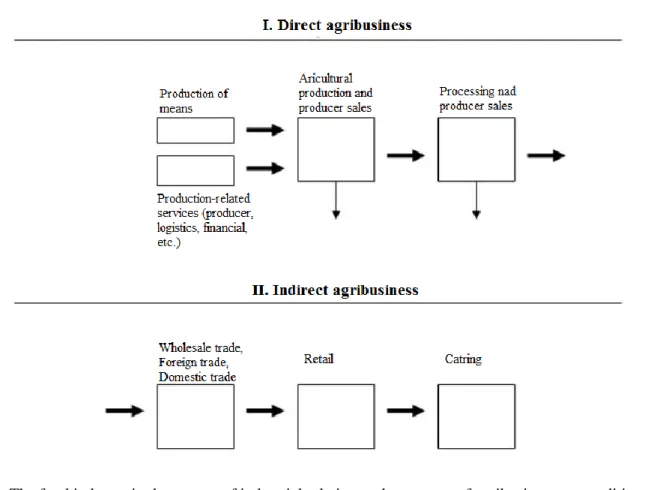
The term agribusiness was first introduced in American literature as a collective term for horizontal and vertical industry relationships related to agricultural production. As illustrated in the diagram of The food industry in the system of industrial relations - the concept of agribusiness, the central element of agribusiness
is the production of agricultural raw materials (both of plant and animal origin) and the economic links of the product lines of the processing industries.
Figure 1. The food industry in the system of industrial relations - the concept of agribusiness, own editing, based on: (Buday & Sántha, 2011)
In the extended sense, however, the economic embeddedness of the sectoral system and its functional relations are also included in the value chain of agricultural production. Based on these, agribusiness systematizes a value chain approach to agricultural production with a focus on the agricultural production and processing sectors (Buday & Sántha, 2011). The forces of the sectoral vertical of agribusiness and the criteria of competitiveness in the sectors are determined by the characteristics of the sectoral chain structure.
Its main characteristics are capital concentraton, economies of scale and the pace of technological change (Hajdu & Lakner, 2000).
Agribusiness has to take into account the so-called agricultural specificity, which influence the tools and methods of farm management. Among the agricultural specificity, the effects of natural exposures, biological cycles of reproduction, and the ongoing satisfaction of human nutritional necessities factors due constraint, risk and impact frequent in value creation (Székely, 2016).
Dairy cow farm management
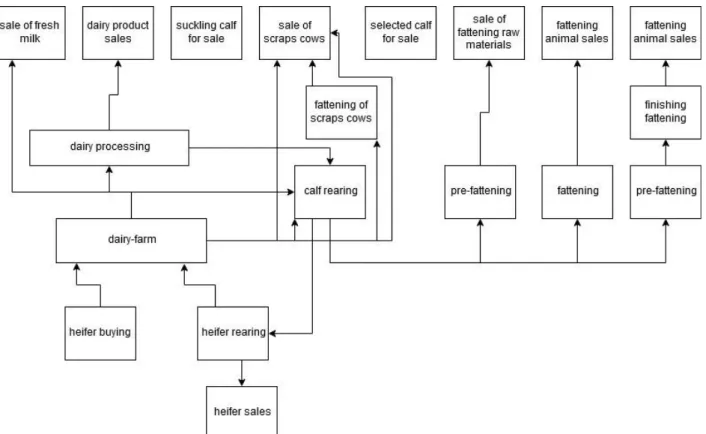
The cattle sector is a complex business of agricultural holdings, the main processes and their connections are shown in Figure 2. Planning, analyzing, accounting for changes in livestock for different age and utilization purposes requires process-oriented event tracking and records (Tonchia & Quagini, 2010). Although the whole business economics has already included all the economic, organizational and technical-economic knowledge, their combined application can only answer the complex business organization questions (Zéman et al, 2014).
Operational organization activities are primarily driven by the goals set by the company. Due to the complexity of the operational hierarchical target system, it is not always transparent, therefore it is necessary to specify them. Another major challenge for farm management is the production problems. In most cases, problems are recognized when the two extremes are the result for the period and the goal set different from
functioning controlling mechanism is required to develop action opportunities. Collecting and processing information is a very important management task. Today, the modern economy is permeated by the phenomenon of precise information management. In essence, information as such is a resource, so acquiring and managing it is just as important as other traditional corporate resources. With the help of the available information it is possible to evaluate the situation of the production with the help of analyzes and controlling activities depending on the specified goals (Castle et al., 1987).
Figure 2. Production processes and opportunities in the dairy sector, own editing, based on: (Nábrádi et. al.
2008)
With the information available, both operation and production become more efficient. In the course of the organization of production, production processes must be regulated, the order of work processes based on each other, their placement in time, the optimal use of equipment, as well as the preparatory work and the service of animal must be organized (Beierlein, et. al., 2014). Nowadays, efficient management and organization of business cannot be achieved without the help of specialized plant management systems. In addition to recording and reporting production and breeding data, these database management programs provide online communication and collaboration with service and management agencies (Mikó & Jónás, 2006).
In Hungary, the sector is characterized by a lack of capital, technical backlog, inadequate market relations and the resulting uncompetitiveness. After the change of regime the number of animals and the production of animal products decreased by 30-40%. However, in 1997, the breed structure and genetic basis of the cattle population were at an appropriate level for the development of milk production. This was also illustrated by the production indicators. On the other hand, the domestic spread of the Holstein-Friesian breed played a significant role in the sharp increase of the specific yields of milk-producing farms at that time (Nagy, 2003). In the subsequent period, however, only the increase in specific yields resulting from the change of breed was no longer sufficient, producers had to adapt to the new requirements and to market competition (Antal et al., 2004). In order to meet these new requirements, there is a need to introduce both different management and management organization methods.
Balanced Scorecard (BSC) application in agriculture
The development of Kaplan and Norton (1998): Balanced Scorecard (BSC) as a model for a balanced indicator system is one of the most significant advances in controlling today. Organized around four distinct perspectives, the scorecard system is specifically linked to organizational strategy through its measurement and multidimensional approach (Otley, 1999). The four key areas of performance are financial performance, customers, operational processes, and innovation and learning (Kaplan - Norton, 2000).
BSC is a tool for executives that has a strong impact on competitiveness. Essentially, it translates the organization's vision into a comprehensive set of indicators that also define a strategic performance measurement and management system framework (Hanyecz, 2006). This is not another classic strategic planning method, but a tool to help implement the strategy, which assumes that there is a sound strategic plan with quantified elements. When applying the Balance Scorecard, it is important that organizations strive for balance. A balance needs to be struck between short and long-term indicators, financial and non-financial indicators, backward and forward indicators, external and internal performance components (Kaplan - Norton, 2000).
As a new management system, the Balance Scorecard covers clarifying vision and strategy, linking strategic goals and indicators, recording planning and expectations, strategic feedback and facilitating learning. But in today's accelerated information age, IT support and information technology have become essential in most of the areas listed. It can be said that in our increasingly globalized and digitized world, information technology has become a vital resource, both for implementing competitive strategies and for managing business processes. Thanks to the explosive development of information systems and information technology, organizations have accessed a lot of data that has not been studied before but contains useful information. Nowadays the Balance Scorecard also has access to large amounts of data, which can make the organization's process mapping and strategy definition more sophisticated and complex (Huang - Hu, 2007).
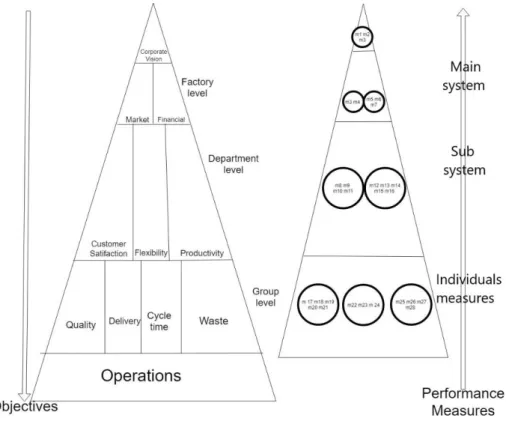
Figure 3. General goals and measurement points in organizational operating systems, own editing, based on: (Ante, Facchini, Mossa, & Digiesi, 2018) (Schnellbach & Reinhart, 2015)
The balance scorecard can be used in any industry, but all systems must be industry specific (Bigliardi &
Bottani, 2010). Universities and research institutes can improve the economic efficiency of BSC
2006). In the case of agriculture, the types and sizes of farms and the life cycle stages of farms can be called specialized factors. These standardized BSCs could be further refined and tailored to practical needs and made more accessible to farmers through advisory services. Compliance with the above requirements requires close cooperation between the university, research institutes and the consultant service. The specific, low level of BSC agriculture is due to the fact that existing consultants do not have the necessary competencies and methods (Noell & Lund, 2002).
The applied KPI tree model
KPI Tree is a controlling model used and developed in most cases by multinational organizations operating in the industry. The KPI tree organizes KPIs in different ways into groups based on specific goals and correlations (Schnellbach & Reinhart, 2015) and systematize them with a logical structure based on each other (Ante, Facchini, Mossa, & Digiesi, 2018). The various KPIs measured are determined by both the literature and the corporate practice. Big data and industry 4.0 data, on the other hand, allow for the creation of new KPIs and the collection of accurate KPIs up to the minute (Peral, Maté, & Marco, 2016). These new KPIs provide an opportunity to both compare daily plan factual and objective daily analysis based on it, as well as to measure different lean management and other organizational methods. (Schnellbach & Reinhart, 2015).
The literature does not specifically define structures for building the KPI tree model, but it is possible to implement multiple cross-structures in case studies. The Figure 3. is based on the structure used in our model development.
3. Material and method
During our research, we conducted an extended case study. Our case study in Hungary served as a dairy farm in the Baja district. The body under study has a Holstein-Friesian population with an annual milk production of approximately 1 800 000 liters.
We chose the extended case study method to discover the shortcomings of existing theories and the methods used in practice (Babbie, 2013), and to further develop the applied model along a model formulated in a given theoretical literature, using various parameters (Burawoy, 2002 )
In our research we looked for points that do not necessarily agree with the theory. We aimed to analyze the interrelation of different controlling models and their sequential logical structure in the dairy cow management system. We further aim to develop a complex controlling model for use in general dairy organizations. In order to illustrate the operation of the model, we set profitability as an aggregated KPI. We chose this because it is a critical and well-defined KPI in the management of dairy cows, according to both the managers of the organization under study and the literature. Because the model serves to describe reality, profitability as an aggregate target KPI is interchangeable with other aggregate target KPIs in the model, but does not affect the logical structure of the model.
4. Results
During our research we analyzed the controlling system of a dairy cow and its related structure. In our analysis, we illustrate in detail the logical structure of the KPI tree through a financial KPI. During the development of the model, the data and operational processes of the examined organization were taken as the basis.
Case Study - Dairy Cows KPI Management – BSC
The various metrics appear as aggregates in the Balance Scorecard system of the organization under study.
The organization does not measure these metrics and their content of information with the KPI- tree method, but only using various simple mathematical operations and reporting operations. The information required for these purposes is extracted from the information management system and from the accounting ledgers and processed by the finance department and integrated into the Balance Scorecard.
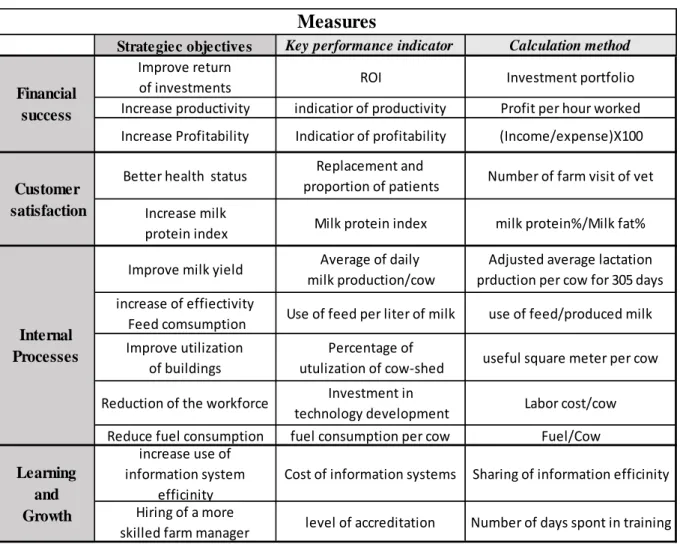
The figure below shows the BSC system used by the organization. It is clear from the chart that few KPIs are used, and most of them can be classified in the financial statements or in the BSC financial section.
Table 1. BSC model, goals and indicators
Critical Analysis of the Model
The balance scorecard system shown in the model above illustrates the operation of the examined organization. The KPIs defined in the system and their calculation method are based on the specified calculation methods. The information content of the various aggregated indicators is not necessarily complete, and the various fundamental interrelationships do not appear in the logical context of KPIs.
In most cases, the content of information derived from KPIs is only an aggregate unit of measurement and an analysis of this fact relative to past data. In goal definition, goal definition does not include possible optimum and deterministic data for the KPI, but rather a comparison and expectation with past data. The information content of the various KPIs defined in the model needs to be as diverse and comprehensive as possible for management to make a well-informed decision (Anthony & Govindarjan, 2006).
Further disaggregation of KPIs is not applied during organizational operations and therefore the model is not able to adequately provide causal information to management. The model lacks the level of detail and functionality required for effective decision making. Various aggregate indicators such as ROI, profitability, increase in milk yield have several and different causal factors. The goals assigned to these complex metrics and the status derived from a plan-fact analysis of the performance measured in the current period, not only illustrates the actual results, but also some level of performance.
As we associate the appropriate target formulation associated with a particular indicator in the model, the relevance of the indicator information content can be significantly increased. Similarly, if a given aggregate KPI is further analyzed in a causal relationship analysis with the indicators associated with the aggregate, then the metastatic effects of the studied complex KPI can be observed. The more detailed and further a causal analysis we analyze the main KPIs in the BSC, the more relevant and detailed information content is available to management. The objectives set for other indicators related to the aggregate indicator and their plan-fact analysis at a given point in time support the evaluation, judgment and relevance of the aggregate
Strategiec objectives Key performance indicator Calculation method Improve return
of investments ROI Investment portfolio
Increase productivity indicatior of productivity Profit per hour worked Increase Profitability Indicatior of profitability (Income/expense)X100
Better health status Replacement and
proportion of patients Number of farm visit of vet Increase milk
protein index Milk protein index milk protein%/Milk fat%
Improve milk yield Average of daily milk production/cow
Adjusted average lactation prduction per cow for 305 days increase of effiectivity
Feed comsumption Use of feed per liter of milk use of feed/produced milk Improve utilization
of buildings
Percentage of
utulization of cow-shed useful square meter per cow Reduction of the workforce Investment in
technology development Labor cost/cow Reduce fuel consumption fuel consumption per cow Fuel/Cow
increase use of information system
efficinity
Cost of information systems Sharing of information efficinity Hiring of a more
skilled farm manager level of accreditation Number of days spont in training Internal
Processes
Learning and Growth
Measures
Financial success
Customer satisfaction
further causal analysis, we obtain a complex model that, both in depth and in methodological terms, contains more extensive and relevant information than the BSC model used in the study organization.
All in all, the Balance Scorecard analysis method is an excellent management control tool in the dairy sector as well. It provides excellent assistance in planning and controlling , but the level of task control are not necessarily appropriate and are not applied by the organization. Task level of control require the further development of the BSC analysis method, the most basic foundation of which is an efficient and holistic information system. By extending the analytical method, a model is created in which relevant targets are assigned to the various points or KPIs, and dynamic actual data needs to be uploaded. This creates a structure in which aggregate KPIs and nested aggregates themselves carry performance levels, predefined categories.
For this extension, the KPI tree method, as formulated in the literature, is best suited. The indicator at the top of the model is one of the aggregated KPIs from the BSC.
Further development of the BSC model using the KPI tree methodology
The KPI tree used to extend the BSC analysis method is a hierarchical structure that includes various metrics, KPIs, and complex metrics. The hierarchical arrangement of KPIs in a given tree is not necessarily the same as the vertical hierarchical arrangement of another tree.
The advanced model we have presented is an illustrative tool because out of the aggregate KPIs in table 1, we selected it at the peak of our profitability model. Our choice for profitability, among other things, is the aggregate peak of the illustrated model because the purchase price of milk as one of the most influential factors in profitability in the dairy sector depends on predetermined buying factors. The target defined for the aggregate peak indicator is determined by management (such as the rating at the time of acquisition). The aggregate indicator itself can be read from the various dairy cow management information systems, but due to the task controllers, and due to the lack of a relationship system, the meaning of this information in the causal context is not representative. A report from a peak KPI plan analysis shows the milk grade category projected for the period under review, thereby forecasting the expected milk purchase price. If the report does not meet expectations, then the KPIs and metrics associated with the tree's peak pointer are in themselves indicative of the achievement of the deterministic and expected goals. This clearly indicates the need for the manager to intervene in different areas.
You can assign a projected rate to most KPI-tree indicators, especially those in the lower third of the tree.
Most of these ratios are not always convertible into monetary units, but currency ratios and absolute amounts must be used at the levels above where possible. This is because the company calculates profitability as a ratio of revenue to cost, and is measured in currency, therefore, the revenue shown in the model- the indicators at the horizontal level of costs must also be expressed in absolute terms. In cases where it is not possible to set a special complex ratio for the plan-fact analysis there the relative relation between the absolute value of the plan and the fact must be defined relative to one another.
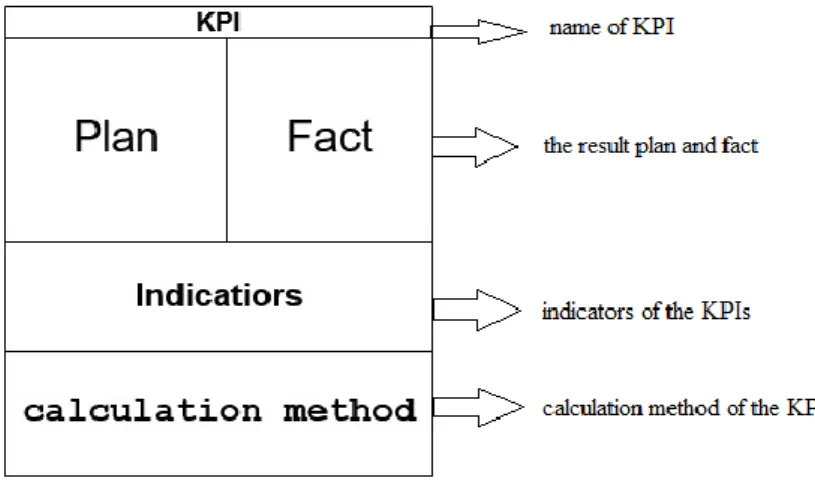
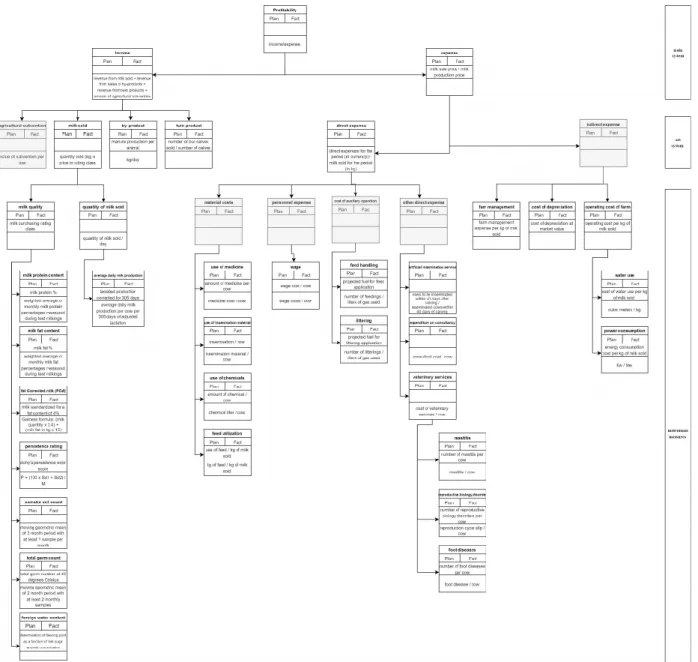
The Figure 4. illustrates the structure of the measurement points required for the KPI-tree structure. These measuring points include the name of the KPI, the data of the plan-fact analysis, the name of the indicator and the calculation method of the indicator. There are exceptional cases where no indicator or calculation method can be defined for the measurement points. If the measurement points in Appendix 1 (An illustration of a KPI tree in terms of profitability aspect), then the plan fact analysis can only be expressed in currency.
The illustration above shows three large hierarchical groups. The topmost group is called main system group, which contains aggregate metrics. Aggregate metrics here already have complex target definitions.
Information from these indicators provides management with appropriate feedback on the achievement of strategic goals and opportunities. In our model, such an indicator is profitability, which is also the top indicator of the tree under study. The profitability indicator is examined by the organization in terms of revenue per cost distribution. Another indicator in the main system group is revenue. There is no proportional ratio for this indicator, but the relative indicator from plan-fact analysis can be determined. Revenue is expressed in absolute value as follows: (revenue from milk sold plus revenue from sales of by-products plus revenue from twins plus subventions). In addition to the revenue metric, the cost indicator appears. The cost indicator must also be interpreted in absolute value, as this standardization is needed to calculate profitability.
However, another metric with relevant information content is also used in the model. This metric is structured as: (cost = 1 kg milk sales price per 1 kg milk production price). This indicator adequately reflects the profitability of the milk produced by the organization in proportion to its costs. The second level in the model is called sub system group. There are already several KPIs in this group, as shown above. At this level is located the income from the subvention, which is measured both in absolute value and per cow. The milk sold indicator can only be interpreted in the model in absolute terms or as a result of a plan-fact analysis.
Calculation value of the indicator: (quantity of milk sold in kg multiplied buying-in price in currency). By- product is sold product that additionally income. In the dairy sector, this means the organic manure. In our model, the average fertilizer production per animal was measured for the by-product and expressed as kg per day. In addition, the target is defined by the average daily organic manure production as determined by the literature. The twin product can also be called a source of additional income. In the diary production sector, this means bull calves sold. The number of bull calves per calves has information for decision-makers on reproductive performance and may provide guidance for intervention options. Monitoring this is important in the model because the calf calving is an alternative loss because the heifer represents a higher value in milk production. The value of the indicator can be expressed in absolute value. The bull calf can be sold at market price, so it is income and it can be express in terms of currency. On the cost side, the direct and indirect costs are appear in the sub system grouping level. Direct costs are costs that are closely related to production.
Figure 4. The structure of the measurement points
For this indicator, it may be possible to specify a metric other than the one in absolute currency: Direct costs over the period under review in currency per kg of milk sold for the period under consideration. For the indicator, past data is the best basis for defining a goal. As a result of the plan-fact analysis, the indicator illustrates the ratio of costs to 1 liter of milk for the period under consideration compared to past results. In the case of indirect costs, no specific ratio can be defined and is therefore an aggregate indicator in absolute terms. These are costs that are not closely related to production.
At the lowest level is the individuals measures group. Within this group, several KPIs and metric points have been formulated which are closely causally related to the various aggregate indicators at the above levels. In most cases in levels of task control, these indicators can be interpreted as reporting specific tasks and processes. The importance of milk quality in the model is pronounced as it has a major influence on entering the different class of selling. There is a significant difference in the milk buying departments purchase price per liter. The factors that determine the milk quality class are specified in the contract with the milk purchaser and thus become deterministic goals in the model. Factors determining milk quality are continuously monitored and uploaded to the farm management information system.
The volume of milk sold is also at this level in the model. The indicator can be interpreted in absolute terms, but it is not in currency terms but in kilograms. Further indicator related to the quantity of milk sold is average daily milk production. This indicator refers to lactated production per cow adjusted for 305 days, which is expressed in kg per day. Further indicator is the cost of materials, which can be expressed in absolute terms.
Material cost indicators can be expressed in currency vaule, with the exception of feed utilization KPI, the information content of which is most relevant in vaule of feed consumption per 1 kg of milk. Personnel costs are all costs that include personal payments. This indicator can be expressed in absolute value. The related indicator is the wage, which can be clearly expressed in currency, but its information content can be expanded if the wage cost is compared to 1 cow. Cost of auxilary operating, as well as other costs in this class, are expressed in currency value. In connection with the auxiliary costs indicator, we have highlighted feed movement and littering in our model. For both indicators, we compare work operations to the fuel costs used.
This gives the management more detailed information to assess the effectiveness of the work. Other direct
status of our herd and also the absolute value cost of veterinary services. The value and status included in these indicators were also expressed in relation to 1 cow. This will illustrate the extent and proportion of the various animal health problems in the farm. Direct costs at the level of individual measures, as shown in the illustration is the, farm management, cost of depreciation and operating cost of farm. Amortization is calculated at market value. In the case of the farm operation indicator, the indicators per 1 kg of milk are an excellent illustration of the cost-effectiveness of investments in and investment subvention in the water and energy system.
5. Summary
It is clear from our research that although agriculture is a specialized sector, different control models can still be applied in this industry. The applicability of a balanced scorecard is excellent for strategic planning and control, but does not fully illustrate all levels of controlling. Our extended model, which is based on the cause and effect relationships of various KPIs in the balance scorecard, enables a KPI-tree with plan-fact analyzes to generate more relevant information and provides greater transparency at both hierarchical and vertical levels. In addition to more relevant and extensive information aggregation, our model has several enhancements point. The various hierarchical and vertical levels do not provide feedback on the exact reason for the good or bad performance of the aggregated KPI. By using different mathematical-statistical methods and different algorithms to determine changes and relationships, more accurate information can be provided to the management through the system.
Supported by the ÚNKP-19-3-I New National Excellence Program of the Ministry for Innovation and Technology.
References
[1] Antal K. & Guba M. & Kovács H. (2004): A magyarországi agrárgazdaság helyzete az uniós taggá válás küszöbén. Gazdálkodás. XLVIII. évf. 2.sz. 1-14.p.
[2] Ante, G., Facchini, F., Mossa, G., & Digiesi, S. (2018). Developing a key performance indicators tree for lean and smart production systems. IFAC PapersOnline 51-11, 13-18.
[3] Babbie, E. (2013). The practice of social research (13th. kiad.). USA Belmont: Wadsworth, Cengange Learning.
[4] Beierlein, J. G., Schneeberger, K. C., & Osburn, D. D. (2014). Principles of Agribussines Management.
Illinois.
[5] Bigliardi, B., & Bottani, E. (2010). Performance measurement in the food supply chain: A balance scorecard approach. Emerald Insight, 249-260. doi:10.1108/02632771011031493
[6] Buday-Sántha A. (2011): Agricultural and Rural Policy. Saldo, Budapest.
[7] Burawoy, M. (2002 . 12 17). The extended case method. Sociological Theory, 4-33.
doi:https://doi.org/10.1111/0735-2751.00040
[8] Castle, E. N.-Becker, M. H.–Nelson, A. G. (1987): Farm Business Managemenet p. 23-27.
[9] Hajdu I. – Lakner Z. (2000): Nemzetközi tendenciák – hazai dilemmák: a magyar élelmiszeripar világgazdasági környezete és stratégiai fejlődési irányai az ezredfordulón. Élelmezési Ipar, 4, pp. 97-103.
[10] Hanyecz L. (2006): A controlling rendszere, Saldo Pénzügyi Tanácsadó és Informatikai Rt., Budapest, pp. 52-57.
[11] Huang C.D. - Hu Q. (2007): Achieving IT-Business Strategic Alignment via Enterprise-Wide Implementation. Information Systems Management Vol. 24, No: 2, 173 p.
[12] Kaplan R. S. - Norton D. P. (2000): Balanced Scorecard. Kiegyensúlyozott stratégiai mutatószám- rendszer KJK-KERSZÖV Jogi és Üzleti Kiadó Kft. Budapest 14, 71-75 p.
[13] Mikó J. & Jónás E. (2006): A tejtermelő szarvasmarhatartás adatgyűjtésének és feldolgozásának fejlődése, Agrár- és Vidékfejlesztési Szemle, Vol 1. pp.21-26.
[14] Nagy F. (2003): Az Európai Unió élelmiszergazdasága. FVM. Képzési és Szaktanácsadási Intézet, Budapest
[15] Nábrádi A., Pupos T, Takácsné Gy. K.(2008): Üzemtan II. Szaktudás Kiadó, Budapest
[16] Nefstead, W., & Gillard, S. (2006. 07 23-26). Creating an excel-based balance scorecard to measure performance of colleges of agriculture. Amirican agricultural economics association (AAEA), 1-25.
doi:10.22004/ag.econ.21421
[17] Noell, C., & Lund, M. (2002). The Balanced Scorecard (BSC) for Danish Farms―Vague Framework or Functional Instrument? In A. Hegrenes (Szerk.), Farm management, pp.187-205.
[18] Otley D. (1999): Performance management: a framework for management control systems research, Management Accounting Research, Vol. 10 No: 4, 363-382 p.
[19] Peral, J., Maté, A., & Marco, M. (2016). Application of data mining techniques to identify relevant key performance indicators. Computer standards and interfaces, pp.1-20.
doi:https://dx.doi.org/10.1016/j.csi.2016.11.006
[20] Robert. N. Anthony & Vijay Govindarjan (2006): Management controll systems, McGraw.Hill Education, New York 12th edition.
[21] Schnellbach, P., & Reinhart, G. (2015). Evaluating the effects of energy productivity measures on lean production key performance indicators. Procedia CIRP, pp.492-497. doi:https://doi.org/10.1016/j- procir.
[22] Székely, Cs. (2016). A magyar mezőgazdaság stratégiai kérdései. Gazdálkodás, pp.16-30.
[23] Tonchia, S., & Quagini, L. (2010). The Monte dei Paschi di Siena “Controlling Data Farm”, the CPM of the Oldest Bank in the World. Performance Measurement, 113-133.
[24] Zéman Z, Tóth A, Hajos L, Gábor Á (2014): The application of an operative controlling system based on process costing (process-controlling) through production process of an agricultural Plc. Controller Info Studies, pp. 211-216
Appendix 1. Illustration of a KPI tree in terms of profitability aspect