DOI: 10.1556/606.2020.15.3.1 Vol. 15, No. 3, pp. 3–14 (2020) www.akademiai.com
HUMAN GAIT CYCLE ANALYSIS USING KINECT V2 SENSOR
1 Péter MÜLLER*, 2 Ádám SCHIFFER
1,2 Department of Information Technology, Faculty of Engineering and Information Technology, University of Pécs, Boszorkány u. 2, H-7624 Pécs, Hungary
e-mail: 1muller.peter@mik.pte.hu, 2schiffer.adam@mik.pte.hu
Received 5 May 2020; accepted 16 June 2020
Abstract: Examining a human movement can provide a wealth of information about a patient’s medical condition. The examination process can be used to diagnose abnormal changes (lesions), ability development and monitor the rehabilitation process of people with reduced mobility. There are several approaches to monitor people, among other things with sensors and various imaging and processing devices. In this case a Kinect V2 sensor and a self-developed LabView based application was used, to examine the movement of the lower limbs. The ideal gait pattern was recorded in the RoboGait training machine and the measured data was used to identify the phases of the human gait. During the evaluation, the position of the skeleton model, the associated body joints and angles can be calculated. The pre-recorded ideal and natural gait cycle can be compared.
With the self-developed method the pre-recorded ideal and natural gait cycle can be compared and processed for further evaluation. The evaluated measurement data confirm that a reliable and mobile solution for gait analysis has been created.
Keywords: Gait analysis, Kinect V2 sensor, Biomedical engineering, Vision-only measurement
1. Introduction
Analyzing the gait process can provide important data about the patient’s condition in many ways [1]. It can be a diagnosis or the tracking of the rehabilitation progress and ability development. Conventionally, this type of examinations is performed by
* Corresponding Author
professionals with many years of experience and expertise. Basic movement patterns can be observed visually, but they also require the involvement of experts or physiotherapists [2]. To detect advanced patterns of movement, multiple data sources are required. The currently available solutions use various sensors. Certain measurement methods apply visual markers attached to the body or use wearable pressure-sensitive sensors or measure the muscle work [3], [4].
The recorded ElectroMyoGraphy (EMG) signals can be used for creating a wired solution for monitoring the motion of the human body. With developed solution the upper and lower extremities can be measured as well. By using this type of information, the researchers are able to create a decision support system, combined with machine learning [5], [6].
In the case of body-attached sensors, the sensors have to be fastened on specific positions of the body parts. The sensors are connected by wires to each other and the central processing device. The disadvantage of this kind of method is, that the examined person is restricted in movement by the attached devices; therefore the intended patterns of movement can be distorted and misobserved [4]. It is also possible, that the Signal to Noise Ratio (SNR) rises significantly, due loose wire interconnections. For these problems optical sensors can provide a solution, as they can identify the body joints based on visual markers [3]. For wireless, visual-only measurements an image sensor with high frame-rate is required, as well as to use of depth sensitive cameras.
Measurements performed in this way, require special preparations and are excessively expensive.
2. Methodology of the measurement
During the measurement, a widely available Kinect V2, also known as Microsoft Kinect ONE sensor was used [7]. This type of sensor transmits 11 data streams in real time. The stream includes Red-Green-Blue (RGB) color video [8], depth image data and a skeleton stream for up to 6 people at the same time. The skeleton model, captured by the Kinect’s cameras, consists of 25 connection points (joints) for each person. The geometric properties, of each connection points determine the position of the person in space. In addition to spatial data, the sensor also can determine the speed of the moving objects and the distance between them. During the measurement the sensor was fixed.
The reason for this restriction is that the device would lose focus otherwise, which would change the reference value. The Kinect sensor has its own technical bottlenecks, for example it needs reference points to identify people and to calculate the distance. To preserve the reference points, it requires a static background and constant light conditions [8].
2.1. The measurement layout
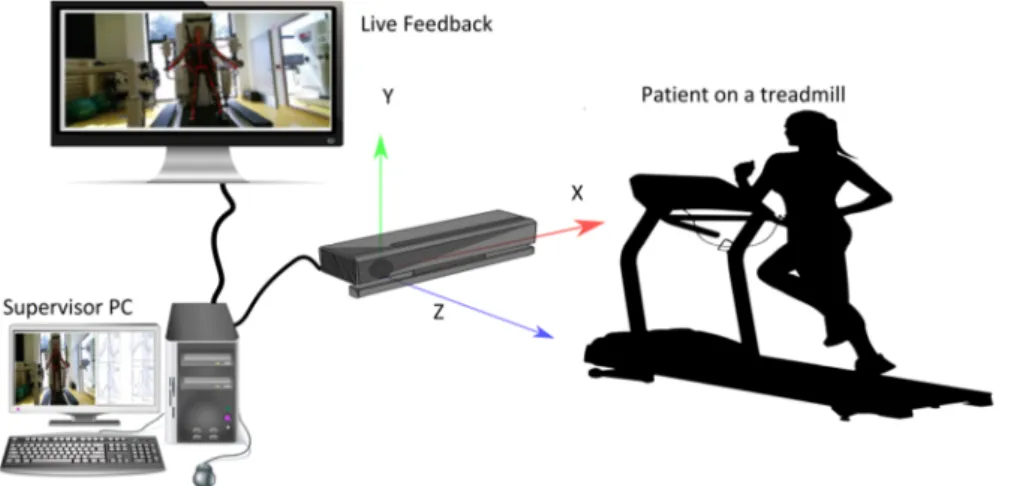
The scheme of the measuring system can be seen in Fig. 1. The main component of the system is a stationary positioned Kinect sensor, which is connected to the central processing unit. As it is shown in Fig. 1, the sensor is positioned opposite the patient and the horizontal distance of the subject is represented on the Z-axis. If the sensor is
not able to detect all of the body points, it estimates the joint’s spatial position. The placement of the sensor is justified by the fact, that in this way the sensor is able to measure the points, instead of estimating them. For example, estimation may occur when the sensor is directed to the side of the body, looking in the X direction, where one limb may block out the points of the body or the other limb. The ideal distance for the measurement is between 0.5 meter and 3.5 meters. Two different scenarios are laid out.
In the first arrangement, the subject was in the RoboGait [9], which is a locomotor therapy system. In this case, the person is secured to the device with an elastic harness, at multiple points. It follows that the displacement of the center of the body-mass is not significant, less than a centimeter. In the second arrangement (non-secured arrangement) the subject moves freely on a treadmill.
Fig. 1. The measurement layout (Source: Müller)
To analyze the individual phases of the gait cycle the ideal movement pattern has to be established. For this reason, the patient is solely moved by the RoboGait, while being recorded.
In case if it is not possible to walk on a treadmill, the measuring range can be adjusted for recording 4-5 complete cycles.
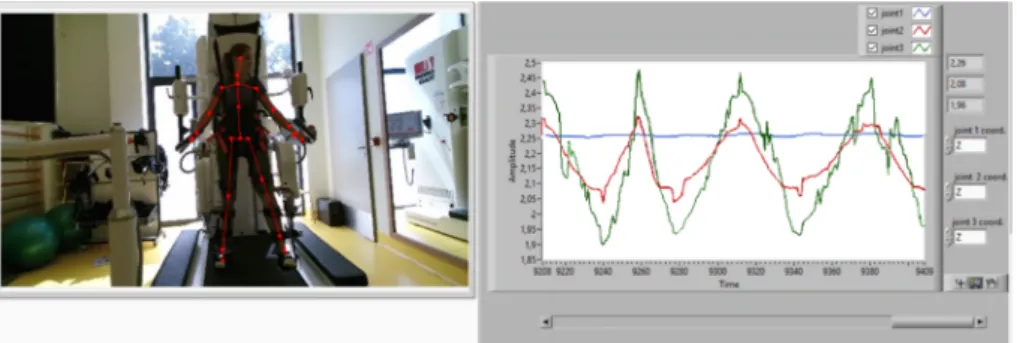
2.2. Real-time monitoring system
The self-developed computer-based monitoring system is capable of displaying data in real time and storing the measured data for processing later. For this purpose, a LabView based measuring and data recording application has been developed, which is directly connected to the sensor (see Fig. 2). The application establishes the communication between the sensor and computer. After the verification process is done, the measurement should be started. In any other case, the application sends short messages about the warning state. The application provides a graphical user interface with real-time data representation and gives feedback to experts or to the patient. For this reason, the joints to be examined can be selected before the beginning of the
measurement, of which the distance or calculated angle or angular velocity can be continuously monitored. This way the system is capable of verifying rehabilitation processes and repetitive movement tasks prescribed by a movement therapist; an example is the inspection of the raising arm, where the magnitude and change rate of the angle measured at the shoulders can be tracked in real time.
During the measurements the application store all recorded information in a Comma Separated Values (CSV) file, what consists of the timestamps, and the joints coordinate in spatial space.
Fig. 2. Block diagram of the measurement system
Fig. 3 shows an example of the measurement and the real-time monitoring system.
In the figure the distances can be seen for different joints, what are calculated from the RoboGait measurement data. The joints can be selected in real time in the application.
Fig. 3. RoboGait measurements with distance values from Kinect V2 for hips, knees and ankles (Source: Müller)
2.3. Post-processing of measurement data
The phases of the gait can be identified during post-processing. The self-developed data acquisition and processing application, does not only derive the data relevant to the selected joints, but can also calculate and store all data of the whole measurement cycle into the same single file. The data format of this file allows for the recording of the X, Y, Z coordinates of the 25 tracked joints simultaneously with timestamps. The processing continues with a script, which serves multiple purposes. The first step of the evaluation process is to filter the samples with a low-pass filter and to determine the point in time from which the gait cycle can be considered periodic. The gait cycle starts with a transient phase and the periodic movement starts only after a few steps. The data points after this can be used to identify the gait cycle phases. The flattening and averaging filter serves the purpose of eliminating the inaccuracies of the measurement system and helps to reduce the noise especially in case of a handicapped person [9].
To analyze the individual phases of the gait cycle the ideal movement pattern has to be established. For this reason, the patient is solely moved by the RoboGait, while being recorded.
3. Gait cycle analysis
3.1. Identifying gait cycles
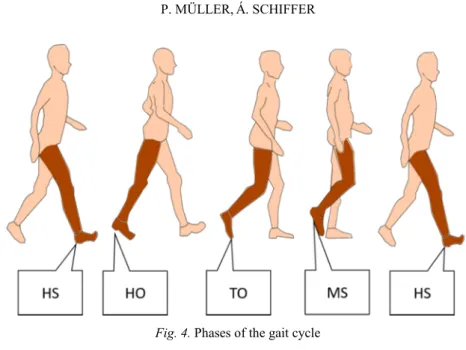
To characterize the gait pattern the kinematic properties describing the temporal nature of the gait can be used, such as the step time, cycle time, support phase duration, swing phase duration and dual support phase duration. Another group of kinematic features are the angular parameters used to characterize the joint’s movements. In the literature a lot of models for gait cycle identification can be found: for example, it can be divided into eight phases [10], but in that case the patients use orthoses and rehabilitation aids, and the smaller signs are difficult to identify. In this paper the normal gait cycle is divided into 4 main phases [11], where the step states are named after the spatial position of the foot at the beginning of the phase (see Fig. 4):
a. Heel Strike (HS): At this moment the heel-surface contact with the ground. The angle of the ankle is maximal at this phase. (see Fig. 5, angle β);
b. Heel Off (HO): In this phase the heel (see Fig. 5, IV) is being lifted of the ground;
c. Toe Off (TO): At this stage the toes (see Fig. 5, III) are still in contact with the ground;
d. Mid Swing (MS): The feet pass beneath the body, lunges forward. In this case the angle of the knee is maximal (see Fig. 5, angle α).
The ratios of the times spent in the different phases of the gait cycle [11] are shown in Table I. The percentage distribution shows the healthy gait cycle and phases, but patients with moving disabilities have different percentage distribution. This means, the certain phases may be reduced radically or even in the worst case completely [12].
Fig. 4. Phases of the gait cycle
Fig. 5. Lower limb model
Table I
Percentage distribution of phases of the step cycle in healthy people
Phase Percentage distribution
Heel Strike 0% - 10%
Heel Off 10% - 50%
Toe Off 50% -60%
Mid Swing 60% - 100%
3.2. Calculating of the gait cycle phases
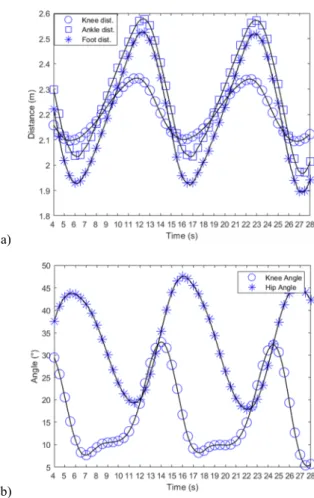
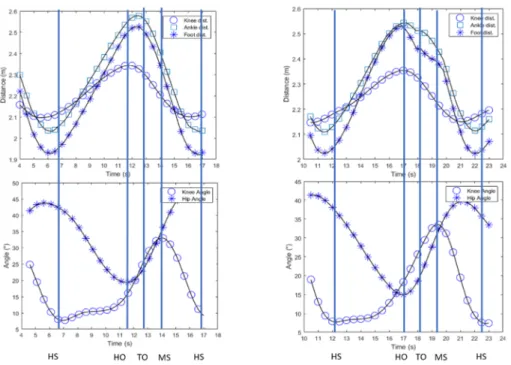
Fig. 6 shows the measured and calculated time-independent and time-dependent values of a RoboGait measurement session for the three joints (ankle, knee, hip), which are indispensable to the analysis of the gait cycle. The measured quantitates are the following:
○
(circle) belongs to knee distance from the sensor, ☐ (square) is the ankle distance and ✳ (star) is the foot distance. Fig. 6a represents the absolute distance between the sensor and the points of the knee (V. point), the ankle (IV. point), and the peg[feet] (III. point), and Fig. 6b shows the angles α, β and γ respectively, where○
(circle) belongs to knee angle, ☐ (square) is the ankle angle and the angle at hip is the ✳ (star).a)
b)
Fig. 6. a) Distance values; b) angle values measured and calculated for the ideal stationary gait at relevant joints
In Fig. 7 a steady gait cycle can be seen, measured in RoboGait. The vertical lines in the figures follow the phases of the gait cycle derived from the movement analysis (HS, HO, TO, MS).
Fig. 7. Stationary step cycle measured in RoboGait
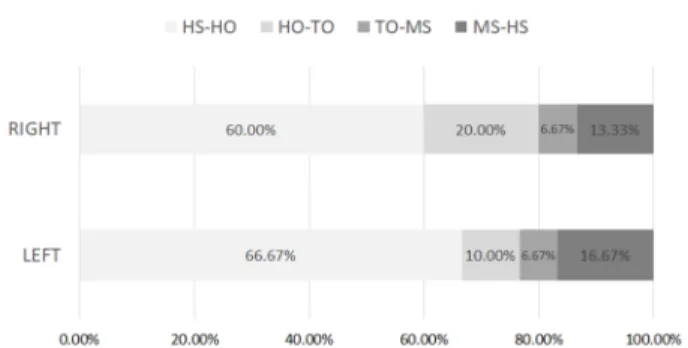
The distribution of the identified phases, over a single step-cycle is shown in Fig. 8.
The distribution demonstrated in the figure provides a good match to the well-known 60%-40% ratio, where 60% belongs to the stance phase, what is including the Heel Strike, Heel Off and the Toe Off, the rest to the swing phase [11].
Fig. 8. Identified phases of RoboGait measurement per step cycle
3.3. Evaluate the measurement
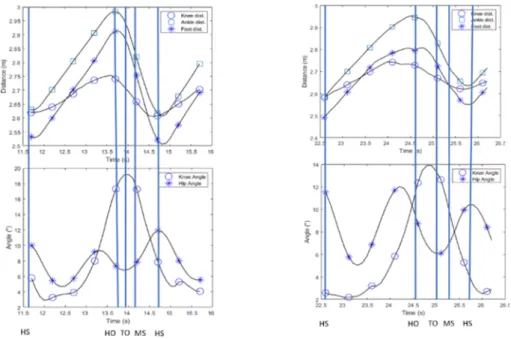
The period of a steady step of a non-fastened, normal walk can be seen in Fig. 9.
Comparing the results in Fig. 7 and Fig. 9 it can be stated that the number of samples corresponding to a single cycle is different. The reason for this is that RoboGait was primarily developed for rehabilitation and developing movement, where the movement speed is about 3 times slower than in the case of natural (non-fastened) walking, therefore it may occur that the two examined cases provide differing number of samples.
Fig. 9. Walking cycle on treadmill
Fig. 10 shows the distribution of the time ratio of each phase of the non-fastened gait process in a single period.
Table II and Table III show the similarities between the step phases of RoboGait and normal walking with respect to the left and right knee joints with their deviation from each other and the calculated correlation coefficient between the two legs. The difference between the left and right gait cycle phases are explained by the fact that the person was an athlete with either dominant leg or injury. This is the reason why only the correlation of the left lower extremities is shown.
Table IV shows the gait phases of the left ankle measured in RoboGait and on a treadmill, compared to normal walking.
Fig. 10. Identified phases of the treadmill measurement per step cycle
Table II
Gait stages for left and right knee joints in RoboGait
RoboGait Knee
Left (%) Right (%) E (%) diff (%)
HS 34.3 44.41 -10.11 -29.48%
HO 14.97 17.18 -2.21 -14.76%
TO 17.3 15.99 1.31 7.57%
MS 27.54 19.44 8.1 29.41%
Correlation: 0.84
Table III
Gait stages for left and right knee joints on a treadmill
Normal Knee
Left (%) Right (%) E (%) diff (%)
HS 26.09 29.84 -3.75 -14.37%
HO 19 26.64 -7.64 -40.21%
TO 20.64 30.15 -9.51 -46.08%
MS 23.77 33.16 -9.39 -39.50%
Correlation: 0.587
Table IV
Correlation between two scenarios Knee Left
RoboGait (%) Normal (%) E (%) diff (%)
HS 34.3 26.09 8.21 23.94%
HO 14.97 19 -4.03 -26.92%
TO 17.3 20.64 -3.34 -19.31%
MS 27.54 23.77 3.77 13.69%
Correlation:: 0.994
4. Summary
The measurement method described above identified the gait phases with sufficient accuracy, compared to what is described in the literature. The accuracy of the method is further enhanced by the fact, that the correlation between the left and the right walking phases in the investigated scenarios is 99.4%.
The application developed for the measurement process gives rooms for a real time support and expert system. The support system was designed to aid the work of a physiotherapist by providing continuous and real-time measurable parameters and calculated data.
The remaining part of the research is the development of an expert system that is capable of autonomous decision-making regarding the identification of movement phases. For example, by detecting differences between the phases of movement, it is able to suggest a prognosis or to provide opportunities for further higher levels of rehabilitation activities, which can be personalized for patients individually.
Acknowledgements
The research project is conducted at the University of Pécs, Hungary, within the framework of the Biomedical Engineering Project of the Thematic Excellence Programme 2019 (TUDFO/51757-1/2019-ITM).
Open Access statement
This is an open-access article distributed under the terms of the Creative Commons Attribution 4.0 International License (https://creativecommons.org/licenses/by/4.0/), which permits unrestricted use, distribution, and reproduction in any medium, provided the original author and source are credited, a link to the CC License is provided, and changes - if any - are indicated. (SID_1)
References
[1] Szénay M., Lopušniak M. Analysis of movement of persons with disabilities during evacuation by lift, Pollack Periodica, Vol. 15, No. 1, 2020. pp. 209–220.
[2] Coutts F. Gait analysis in the therapeutic environment, Manual Therapy, Vol. 4, No. 1, 1999, pp. 2‒10.
[3] Takeda R., Tadano S., Todoh M., Yoshinari S. Human gait analysis using wearable sensors of acceleration and angular velocity, 13th International Conference on Biomedical Engineering, Singapore, 3-6 December 2008, Lim C. T., Goh J. C. H. (Eds.) IFMBE Proceedings, Vol. 23, Springer, 2009, pp. 1069‒1072.
[4] Tao W., Liu T., Zheng R., Feng H. Gait analysis using wearable sensors, Sensors, Vol. 12, No. 2, 2012, pp. 2255‒2283.
[5] Yavuz E., Eyupoglu C. A cepstrum analysis-based classification method for hand movement surface EMG signals, Medical& Biological Engineering & Computing, Vol. 57, 2019, pp. 2179–2201.
[6] Ardestani M. M., Zhang X., Wang L., Lian Q., Liu Y., He J., Li D., Jin Z. Human lower extremity joint moment prediction: A wavelet neural network approach, Expert Systems with Applications, Vol. 41, No. 9, 2014, pp. 4422‒4433.
[7] Clark R. A., Pua Y. H., Oliveira C. C., Bower K. J., Thilarajah S., McGaw R., Hasanki K., Mentiplay B. F. Reliability and concurrent validity of the Microsoft Xbox One Kinect for assessment of standing balance and postural control, Gait Posture. Vol. 42, No. 2, 2015, pp. 210‒213.
[8] Várady G. Color information correction of images using lightweight camera systems, Pollack Periodica, Vol. 14, No. 1, 2019, pp. 3–14.
[9] Uzunhisarcıklı E., Çetinkaya M. B., Fidan U., Çalıkuşu İ. Investigation of EMG signals in lower extremity muscle groups during robotic gait exercises, European Journal of Science and Technology, Special Issue, 2019, pp. 109‒118.
[10] Stöckel T., Jacksteit R., Behrens M., Skripitz R., Bader R., Mau-Moeller A. The mental representation of the human gait in young and older adults, Frontiers in Psychology, Vol. 6, 2015, Paper No. 26236249.
[11] Surer E., Kose A. Methods and technologies for gait analysis, in Computer analysis of human behavior, Salah A., Gevers T. (Eds.), Springer, 2011, pp. 105‒123.
[12] Muro-de-la-Herran A., Garcia-Zapirain B., Mendez-Zorrilla A. Gait analysis methods: An overview of wearable and non-wearable systems, highlighting clinical applications, Sensors, Vol. 14, No. 2, 2014, pp. 3362‒3394.