Tool and techniques
Geometrical accuracy evaluation of an affordable 3D printing technology for spine physical models
Peter Endre Eltes
a,b,⇑, Laszlo Kiss
a,b, Marton Bartos
c, Zoltan Magor Gyorgy
d, Tibor Csakany
d, Ferenc Bereczki
a,b, Vivien Lesko
a, Maria Puhl
d, Peter Pal Varga
d, Aron Lazary
daIn Silico Biomechanics Laboratory, National Center for Spinal Disorders, Királyhágó u. 1-3, H-1126 Budapest, Hungary
bSemmelweis University School of Ph.D. Studies, Üll}oi u. 26. fszt. 9, H-1085 Budapest, Hungary
cDO3D Innovations Ltd, Fehervari ut 130, H-1116 Budapest, Hungary
dNational Center for Spinal Disorders, Királyhágó u. 1-3, H-1126 Budapest, Hungary
a r t i c l e i n f o
Article history:
Received 8 September 2019 Accepted 16 December 2019
Keywords:
3D printing
3D printed spine model Spine surgery Patient specific
a b s t r a c t
Objective:The aim of the study is to develop a workflow to establish geometrical quality criteria for 3D printed anatomical models as a guidance for selecting the most suitable 3D printing technologies avail- able in a clinical environment.
Methods: We defined the 3D geometry of a 25-year-old male patient’s L4 vertebra and the geometry was then printed using two technologies, which differ in printing resolution and affordability: Fused Deposition Modelling (FDM) and Digital Light Processing (DLP). In order to measure geometrical accu- racy, the 3D scans of two physical models were compared to the virtual input model. To compare surface qualities of these printing technologies we determined surface roughness for two regions of interest.
Finally, we present our experience in the clinical application of a physical model in a congenital deformity case.
Results: The analysis of the distribution of the modified Hausdorff distance values along the vertebral sur- face meshes (99% of values <1 mm) of the 3D printed models provides evidence for high printing accuracy in both printing techniques. Our results demonstrate that the surface qualities, measured by roughness are adequate (~99% of values <0.1 mm) for both physical models. Finally, we implemented the FDM phys- ical model for surgical planning.
Conclusion:We present a workflow capable of determining the quality of 3D printed models and the application of a high quality and affordable 3D printed spine physical model in the pre operative plan- ning. As a result of the visual guidance provided by the physical model, we were able to define the opti- mal trajectory of the screw insertion during surgery.
Ó2019 The Authors. Published by Elsevier Ltd. This is an open access article under the CC BY license (http://
creativecommons.org/licenses/by/4.0/).
1. Introduction
Three-dimensional (3D) printing technologies transformed pro- duct manufacturing fundamentally[1], foreshadowing a new tech- nological revolution[2]. Its medical utilizations, especially surgical application of 3D printed technologies aids the preoperative plan- ning, saves time in the operating room and provides patient speci- fic solutions for complex cases through personalized implants [3,4]. Besides surgical planning 3D printed physical models play a crucial role in medical education and patient communication as well, by promoting a better understanding of complex morpholog-
ical changes [5–6]. However, the additional costs and time- consuming production of 3D printed physical models with current technologies are hindering its widespread use in hospitals [7].
Moreover, there is a continuously increasing strain on healthcare providers due to global demographic shifts such as population increase, and societal changes incuding the rise of life expectancy [8,9]. Therefore, the development of cost effective, sustainable strategies related to clinical application of 3D printing technologies are not only highly desirable but decisive.
Currently, there is an increasing interest in the healthcare mar- ket of commercial 3D printing services[10], each providing 3D printers with different technologies and technical parameters at a widely differing price-range. The clinician, and the hospital man- agement faces the decision of choosing one of these services and is confronted with the task of implementing it with the resources
https://doi.org/10.1016/j.jocn.2019.12.027
0967-5868/Ó2019 The Authors. Published by Elsevier Ltd.
This is an open access article under the CC BY license (http://creativecommons.org/licenses/by/4.0/).
⇑Corresponding author at: In Silico Biomechanics Laboratory, National Center for Spinal Disorders, Királyhágó u. 1-3, H-1126 Budapest, Hungary.
E-mail address:peter.eltes@bhc.hu(P.E. Eltes).
Contents lists available atScienceDirect
Journal of Clinical Neuroscience
j o u r n a l h o m e p a g e : w w w . e l s e v i e r . c o m / l o c a t e / j o c n
available. However, evidence-based reports which can potentially offer guidance on these issues are absent in the literature.
In this paper we present a method to compare the geometrical accuracy of two 3D printing technologies used for printing spine physical models. Advantages and disadvantages were weight up in an entry level technology (cost effective, most affordable) with a higher category technology (more precise, more expensive). We also reveal an institutional strategy of the application of 3D printed physical models by presenting a clinical case, in which a model printed with the entry level technology was used in the preopera- tive planning.
2. Methods
2.1. Definition of the 3D geometry
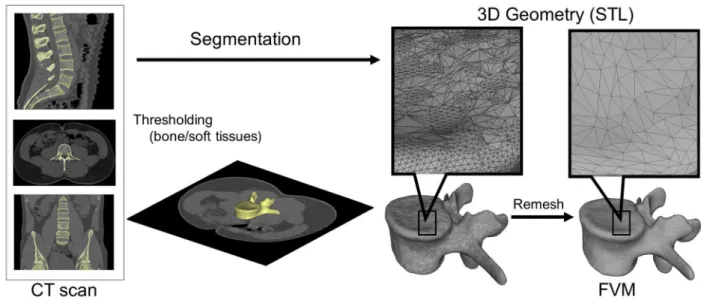
A CT scan of a lumbar fourth (L4) vertebra of a 25-year-old patient was selected from a study of 270 patients who underwent different treatment due to low back pain in our clinic (MySPINE, Project ID: 269909, Funded under: FP7-ICT). The vertebra of our interest and the neighboring segments were not affected by any musculoskeletal pathology. In order to define the 3D geometry, we performed thresholding and manual segmentation in 3D Slicer 4.1.1 [11], an open-source, free software: http://www.slicer.org (Fig. 1). To evaluate the accuracy of the segmentation process, we calculated the Dice Similarity Index (DSI) with 3D Slicer Dice Computation tool[12]. The DSI quantifies the relative volume over- lap between two segmentation procedures as follows:
DSI¼ 2V Ið1\I2Þ V Ið Þ þ1 V Ið Þ2 ;
whereVis the volume of the voxels inside the binary mask (number of voxels multiplied with the voxel size; in mm3), andI1and I2are the binary masks from two segmentation processes (performed by two investigators (I), 1 and 2). The DSI values range between 0 ± 1, one denoting a perfect match. DSI value of the segmentation process was 0.96 indicating a high accuracy.
2.2. 3D printing
The segmented geometry was converted to STereoLithography (STL) format using the ‘‘ModelMaker” module of 3D Slicer. Inspec- tion and correction of the 3D geometry was performed with Mesh- Lab1.3.2[13](an open-source free software:http://www.meshlab.
net), and the following adjustments were made on the triangulated surface mesh: (1) isolated pieces were considered artefacts and therefore, were removed; (2) duplicate edges and faces, that resulted from unification were deleted; (3) universal remeshing with contour preservation (Fig. 1). A final vertebra model (FVM) was built from 8024 vertices and 16,048 triangulated faces (Fig. 1). The FVM was printed with the following two 3D printing technologies: (1)Fused Deposition Modelling(FDM) device (Dimen- sion 1200es 3D Printer; Stratasys, Israel)Fig. 2A, in which a thin fil- ament of plastic (ABSplusin ivory) is melted in an extruding head, which is then deposited to build the desired shape, slice by slice, on a moving platform. During the printing all the significantly pro- truding parts are supported by a concurrently printed scaffold (printed from a water-soluble plastic; Soluble Support Technology, SST). The internal grid structure of the model (Fig. 2C) is automat- ically generated. The building size of the machine is 254 254 305 mm and operates with a layer thickness of 0.330–0.254 mm. (2) The Digital Light Processing (DLP) device (VOXEL L 3D Printer; Do3D, Hungary) polymerizes selectively illu- minated planes of the model, slice by slice (Fig. 2B). The DLP uses a model material Voxeltek White Resin (photo-polymer, acrylic based), and a light emitting diode (LED; with ultraviolet spectrum) as a light source. Upon selective illumination, the model material becomes polymerized and solid. The internal structure of the printed vertebra is empty (Fig. 2D). The building size of the machine is 125 65 65 mm, the wall thickness for the FVM was set to 1.2 mm, the printer operates with a layer thickness of 0.1–0.025 mm.
2.3. Comparison of the 3D physical models printed with FDM or DLP
The FDM and the DLP printed models were scanned (ScanBox 3D scanner; Smart Optics Sensortechnik GmbH, Bochum, Germany) in two measurement sessions and in two orientations.
Fig. 1.Definition of virtual 3D geometry from 2D medical images. During the segmentation process the bone volume is first separated from the surrounding soft tissue by thresholding of the greyscale levels of the CT images. The resulting mask (yellow) voxels represent the 3D volume of the vertebra. Then, from the mask, a triangulated surface mesh is automatically generated and exported into in STL (STereoLithography) format. Before 3D printing the quality of the 3D surface mesh is adjusted (remesh), while preserving the geometrical accuracy. The final vertebra model (FVM) is built from 8024 vertices and 16,048 triangulated faces.
P.E. Eltes et al. / Journal of Clinical Neuroscience 72 (2020) 438–446 439
The measurement field was 80x60x85 mm with a resolution of 0.006 mm (ISO 12836). First, the vertebra was attached to the scan- ner support system from the inferior endplate, with the optical sys- tem focusing on the superior part of the vertebra. Based on these measurements two point clouds were created (FDM-sup, and DLP-sup). Next, the vertebral model was attached by its superior endplate, and the optical unit scanned the inferior part. From these measurements two additional point clouds were created (FDM-inf, and DLP-inf). Based on these point clouds the scanner driving soft- ware created triangulated surface mesh models. The models where then exported in STL format.
Following, alignment and rigid surface registration were per- formed. FDM-sup, DLP-sup, FDM-inf and DLP-inf 3D data sets were transposed into the same coordinate system by surface registra- tion, in order to align their overlapping components with the seg- mented vertebra surface mesh model (FVM), used as reference geometry. We used MeshLab1.3.2 software Align Tool for the point based rigid registration process. Eight symmetrical (left-right sides, 4-4) and two asymmetrical control points were selected from the
superior and inferior region of the reference FVM and from the aligned geometry, respectively (Fig. 3). The points were in the fol- lowing regions: anterior part of the endplate (1-1), in the pedicles (1-1), in the articular processes (1-1), in the transvers processes (1- 1) and one point for the apex of the vertebral arch, and another for the spinous process. The registration was performed by the two investigators (I1, I2) and at two different time points (T1, T2).
Fig. 2.Schematic representations of the Fused Deposition Modelling (FDM) and Digital Light Processing (DLP) 3D printing technologies.AFDM: a thin filament of plastic (1) is melted in an extruding head (2) and deposited to build the vertebra (3), slice by slice on a moving platform (5). The complex geometry of the vertebra requires vertical column scaffolding (4) during the layer deposition.BDLP: UV light (6) is projected on a deformable mirror device (7) and directed, through a lens (8) to the surface of the bottom most layer of the liquid photopolymer resin (10). The light selectively polymerizes the resin, which becomes solid (9). This process also requires vertical column scaffolding (11).
Finally, a moving platform (12) raises the already solidified resin.C-DIllustration of the internal perpendicular grid structure of the vertebra printed with (C) FDM (axial plane cross section) and the empty internal structure of the vertebra printed with (D) DLP (axial plane cross section).
Fig. 3.Control point selection for the rigid surface registration. Ten control points were selected from the superior (A) and inferior (B) region of the reference FVM and from the aligned geometry, respectively. Red circles represent the registration points selection areas.
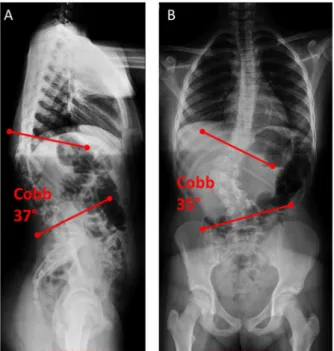
Fig. 4.Standing X-ray images of the thoracic and lumbar spine, and the pelvis of the patient.A-B, the 12 year old female patient suffers from congenital scoliosis, caused by L1 hemivertebrae. The (A) kyphotic deformity is 37°Cobb angle in the sagittal plane (lateral view) and the (B) scoliotic deformity is 35°Cobb angle (antero- posterior view).
To evaluate the accuracy of the registration and alignment pro- cedure the Hausdorff Distance (HD) was measured with the Mesh- Lab1.3.2 software Metro Tool [14]. The HD represents the maximum distance between two points of two sets, both from cor- responding sections of the meshes (i.e.: the HD is expected to be equal to zero in case of a perfect alignment of absolute symmetri- cal geometries). Theoretically, its value ranges from 0 to1, with 0 indicating that the compared volumes have identical boundaries, whereas values greater than zero provide the actual distance between the two surfaces. The values not only indicate the preci- sion of the printing technology, but also the precision of the surface
registration. This process was conducted by two investigators (I1,
I2) and at two different time points (T1,T2). The HD values were cal- culated at the vertices of the triangulated surface meshes as fol- lows: h Að ;BÞ ¼maxaAfminbBfdða;bÞgg; whereA is the FDM-sup, DLP-sup, FDM-inf, DLP-inf mesh;Bis the FVM reference mesh;a andbare points from setsAandB,respectively, andd(a, b)is the Euclidian distance between these points.
In order to measure Surface Roughness (SR), two symmetrical rectangular surface areas from the superior endplates and from the right superior part of the pedicles of the aligned (I1T2) FDM- sup and DLP-sup meshes were determined and separated as Fig. 5.Comparison of the surface meshes of the 3D printed models to the input geometry. A-D Distribution of Hausdorff Distance (HD) values between the aligned (I1T2, I1T2, I2T1, I2T2) surface meshes, derived from 3D scanning of the 3D printed models and the input geometry for the 3D printing process. (A,C) superior and (B,D) inferior surface mesh of the FDM and DLP printed models, respectively. The distribution of the measurements (I1, I2, T1, T2) across the FDM sup, FDM inf, DLP sup, DLP inf groups was found significantly different (Independent Samples Kruskal-Wallis test, p < 0.01). I, number of the investigator; T, timepoint of the measurement.
P.E. Eltes et al. / Journal of Clinical Neuroscience 72 (2020) 438–446 441
regions of interest (ROI) with Autodesk ReMake (free for aca- demics, https://www.autodesk.com/) and Autodesk Meshmixer 3.1 (free software, http://www.meshmixer.com/). The selected and isolated ROIs were exported in STL format, and the surface roughness was then quantified with CloudCompare v2.6.0 open- source software (R&D Institute EDF, Paris, France,https://www.da- nielgm.net/cc/). For each point (vertices of the triangulated surface mesh), the roughness value represents the distance between the point of interest and the best fitting plane, which is computed from its nearest neighbors within a defined kernel. The kernel size equals with the radius (mm) of a sphere centered on each point.
In case of the endplates it was set to: 0.5, 1, 1.5, 2, 2.5 and 3 mms respectively (6 individual measurements); and to 0.5, 0.6, 0.7, 0.8, 0.9, 1 mms, respectively (6 individual measurements) in the case of the pedicles.
2.4. Application of 3D printed physical models in surgical planning
An FDM model was used for planning the trajectory of transpedicular screw insertion in case of a 12-year-old patient suf- fering from congenital scoliosis (Fig. 4) caused by an L1 hemiverte- bra as follows: A pre-operative CT scan, with 1.25 mm slice
thickness, was performed from the lower part of Th11 vertebra to the upper part of L3 vertebra. The data was exported from the hospital PACS in DICOM file format. To fulfill patient data protec- tion, de-identification of the DICOM data was performed using the freely available Clinical Trial Processor software (Radiological Society of North America,https://www.rsna.org/ctp.aspx). The ver- tebras from the anatomical region of interest were segmented with 3D Slicer 4.1.1 as described in case of the FVM, and a model includ- ing T11-L3 vertebras was created. The segmented volumes were converted to STL using the module ModelMaker option. Inspection and correction of the 3D geometry was done with MeshLab. The model was then printed with FDM technology and was used for planning the trajectory of the screw insertion at the Th12 and L1 levels. Ten cm long 1.3 mm diameter titanium rods were inserted in the pedicles in the ideal axis, the orientation of these guided the surgeon visually, during the operation, to find the optimal angle and axis of the screw insertion.
2.5. 3D data integration in the clinical communication
The virtual model used in the clinical case was imported in STL format to MeshLab1.3.2 and subsequently saved as a Universal 3D Fig. 6.Distribution of HD values between the surface meshes of the 3D printed models and the input geometry.A-DCumulative probability plots of HD values for (A,C) superior and (B,D) inferior surface mesh of the FDM and DLP printed models, respectively. Approximately 99% percent of HD values are <1 mm and~80% <0.4 mm for all comparisons. The distribution of the HD values are dependent from the investigator (I1vsI2:FDM sup, FDM inf, DLP sup, DLP inf, Two-sample Kolmogorov–Smirnov test, p < 0.01) and from the measurement time point (T1vsT2: FDM sup, FDM inf, DLP sup, DLP inf, Two-sample Kolmogorov–Smirnov test, p < 0.01). I, number of the investigator; T, time point of the measurement.
File (U3D). A 3D Portable Document Format (3DPDF) file, contain- ing the U3D mesh, was created using Adobe Acrobat (version 10 Pro Extended) 3D tools with default Activation Settings and assign- ment of a Poster Image from default view. The 3D visualization parameters were set as follows: CAD optimized lights, white back- ground, solid rendering style and default 3D conversion settings.
The 3DPDF file was incorporated in our institutional web browser-based SQL database (Oracle Database 12c) which is acces- sible by clinicians from any institutional desktop PC or mobile device.
2.6. Statistical analysis
All statistical tests were performed with SPSS version 23 (IBM, Armonk, New York, United States). HD and SR measurement related dataset normality distribution was tested using:
Kolmogorov-Smirnov test with Lilliefors Significance Correction (sample size > 2000, p0.05). The between group statistical differ-
ence was assessed by Independent Samples Kruskal-Wallis test (p 0.05) for Fig. 5and Two-sample Kolmogorov–Smirnov test (p0.05) forFigs. 6 and 7.
The cumulative probability plots were created with SigmaPlot 12 (SSI, San Jose, California, United States). The data management was performed in Microsoft Excel 2016 (Microsoft, Redmond, Washington, United States).
3. Results
3.1. Comparison of the FDM and DLP 3D printing technologies
Geometrical differences between the surface meshes printed by the two 3D printing methods are represented by the calculated the Hausdorff Distance (HD) values between the aligned surfaces (FDM-sup, FDM-inf, DLP-sup, DLP-inf) and the FVM (Table 1.).
The distribution of the HD values along the vertebral surface meshes provides evidence for high accuracy (Figs. 5, 6). However, Fig. 7.The difference between the surface roughness of the two 3D printed models.A-FRoughness of FDM-sup (D,E,F) is greater compared to DLP-sup (A,B,C; Two-sample Kolmogorov–Smirnov test, p0.01) for the endplate (A,D; kernel set to 1.5 mm) and pedicle (B,E;C,Fdifferent views, respectively; kernel set to 0.6 mm) surface geometries (vertebra, view orientation; red, ROI). Scale barA,C,D, F10 mm;B,E7 mm.
Table 1
The HD measurement represents the difference between the aligned/registered surfaces and the input geometry (FVM).
I1 I2
T1 T2 T1 T2
HD(mm) HD(mm) HD(mm) HD(mm)
min max mean RMS min max mean RMS min max mean RMS min max mean RMS
FDM-sup 0.00 0.82 0.11 0.14 0.00 0.81 0.17 0.23 0.00 0.68 0.13 0.16 0.00 1.05 0.27 0.35
FDM-inf 0.00 0.85 0.23 0.28 0.00 0.56 0.13 0.15 0.00 0.64 0.16 0.19 0.00 0.73 0.22 0.26
DLP-sup 0.00 1.29 0.20 0.26 0.00 1.33 0.18 0.23 0.00 1.25 0.20 0.24 0.00 1.28 0.18 0.22
DLP-inf 0.00 1.58 0.21 0.29 0.00 1.43 0.19 0.23 0.00 1.67 0.17 0.24 0.00 1.68 0.16 0.22
The mean HD between two surfaces is defined as the surface integral of the distance divided by the area of the compared surface (FDM-sup, FDM-inf, DLP-sup, DLP-inf).
I1= firs investigator, I2= second investigator, T1= firs measurement, T2= second measurement, HD = Hausdorff Distance, RMS = root mean square.
P.E. Eltes et al. / Journal of Clinical Neuroscience 72 (2020) 438–446 443
‘critical points’ with higher HD values are revealed (red inFig. 5):
the vertebral endplate in case of the FDM technique (superior sur- face: I1T2, I2T2; inferior: I1T1); the spinous process and the inferior articular processes in case of the DLP technology. The fact that, these higher HD values are not present in all segmentation pro- cesses (investigators and time points), indicates that it is probably a registration error and not a flaw of the printing technologies. The distribution of the HD values were indeed dependent on the inves- tigators and the measurement time point (I1vsI2:FDM sup, FDM inf, DLP sup, DLP inf, Two-sample Kolmogorov–Smirnov test, for the measurement time point T1vsT2:FDM sup, FDM inf, DLP sup, DLP inf, Two-sample Kolmogorov–Smirnov test, p < 0.01). Never- theless, ~99% of HD values were <1 mm and ~80% <0.4 mm for all measurements (Fig. 6), which according to the literature [15,16]is an admissible difference and indicates that the geometry of the FVM model were printed accurately with both techniques.
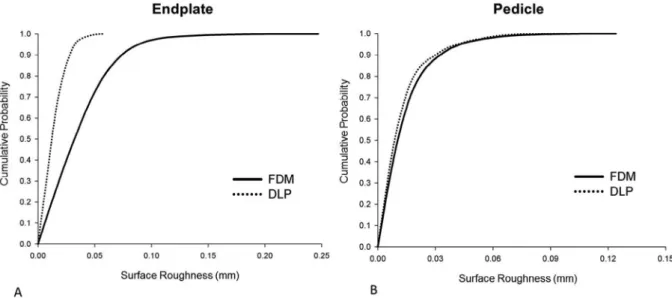
To compare the quality of the surfaces that provide the tactile experience during surgical planning we measured the surface roughness (SR) of the FDM and DLP printed physical model sur- faces. We chose two ROIs from both, FDM sup and DLP sup, surface meshes: one plain like and one highly curved structure, the supe- rior vertebral endplate and the superior part of the pedicle, respec- tively. We found that the SR values of the surface meshes of the FDM printed model were significantly larger compared to the DLP printed model for the endplate ROI (Two-sample Kol- mogorov–Smirnov test, p0.01), and in the case of the pedicle ROI (Two-sample Kolmogorov–Smirnov test, p 0.01) (Fig. 7).
However, the roughness values are relatively small on the entire ROI surfaces (Fig. 8), with~99% of the SR values being <0.05 mm for the DLP printed model, and~99% <0.1 mm for FDM model in the case of the endplate. In the case of the pedicle ROI ~99% of SR values are <0.09 mm for the DLP and for FDM model.
3.2. Clinical implementation of a physical model printed with FDM technology
We present a case of a 12-year-old patient suffering from con- genital scoliosis due to an L1 hemivertebra. During examination, the patient complained about back pain and fatigue; the physical examination did not reveal any sensorimotor deficits. In spite of conservative treatment (physical therapy, brace for two years),
the clinical and radiological signs suggested progression Fig. 4 (COB angle 35 in coronal plane, and 37-degree kyphotic deformity in the sagittal plane); therefore, surgical treatment was indicated.
A corpectomy and stabilization surgery from Th9 to L4 was planned (Th = thoracic spine).
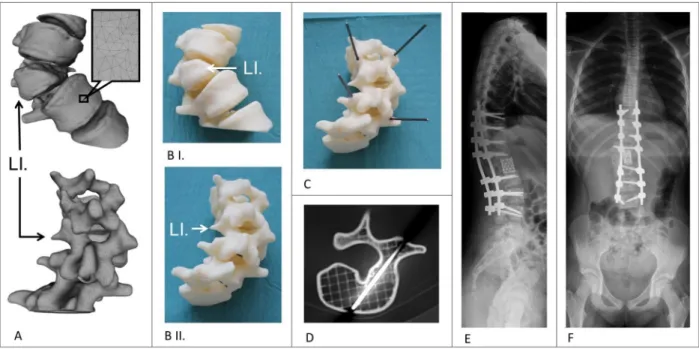
The virtual model of the T11-L3 vertebrae (Fig. 9A) was inte- grated in the clinical communication via a 3DPDF document (see Methods), which provided access to its 3D content through the institutional database. Having been assisted by the patient specific 3D virtual model, the surgical team opted for a corpectomy and stabilization from T9 to L4. Our studies on FDM and DLP technolo- gies revealed that the geometrical accuracy and surface qualities of the FDM printed models are adequate (HD, SR < 1 mm) and because its affordability, we chose to print our model with the FDM 3D printing technology. We used the physical model (1:1 scale) for surgical planning, namely to precisely define the trajec- tory and angle of the transpedicular screw insertion at the T12 and L2 levels (Fig. 8B, C). During drilling, the internal grid structure of the FDM model supported the drill bit and allowed the precise insertion of guidance titanium rods (Fig. 8D). The rods, due to their length, were protruding and were indicating clearly the ideal axis of the screw insertion (Fig. 8C). As a result of the visual guidance during the operation, we were able to find the optimal axis of the screw insertion and perform the planned surgery successfully (Fig. 8E).
4. Discussion
Patient specific tangible, 3D printed physical models can improve surgical performance and outcome, compared to the sole on-screen inspection of the virtual models[17]. The first step in the medical image processing for the 3D printing is the segmentation method. The accuracy of this procedure is influenced by the reso- lution and the slice thickness of the 2D CT image series used for the segmentation [15]. In our institution the minimum criteria for the printing process is 512512 pixel matrix resolution, and a maximum slice thickness of 1.3 mm. Manual editing is another potential source of error in the segmentation processes. For com- plex cases with severe deformations resulting in unique geome- tries the automatic or semi-automatic processes are not always adequate and therefore manual editing is inevitable. A solution
Fig. 8.Distribution of Surface Roughness (SR) values for the FDM and DLP printing technology.A-BCumulative probability plots of SR values for the two region of interest ROI, (A) endplate and (B)right pedicle surface of the FDM and DLP printed models, respectively. In (A)~99% percent of SR values are <0.05 mm for the DLP printed model, and
~99% <0.1 mm for FDM model. In (B)~99% percent of SR values are <0.09 mm for the DLP and for FDM model.
to this issue is offered by the possibility of quantifying the segmen- tation accuracy using the inter-investigator DSI. According to the literature a DSI value of >0.85 is preferable[18,19]. In this study the DSI value was 0.96, indicating that the segmented geometry of the L4 geometry represents accurately the anatomy of the verte- brae. Before printing, additional steps of the image processing are necessary to obtain high quality models. The surface mesh quality of the segmented geometry must be inspected for e.g. irregulari- ties, holes, overlapping edges. The following remeshing and opti- mization must take in consideration preservation of the contour in order to minimize the geometrical distortions.
Once an accurate model of the vertebral geometry is achieved in STL format we propose a strategy of choosing any of the available 3D printing services, in the range of the permitted resources of the hospital. Our reasoning is that without an optimal, continuous uti- lization (not feasible in a hospital) of an in-house printing facility, its maintenance cost is a financial burden for the healthcare provi- ders. Moreover, the technical parameters of a chosen in-house machine might not be adequate for all purposes, and therefore could potentially limit or define the projects or patients who can benefit from these technologies. In contrast, our strategy of choos- ing an available service, based on the predefined expectation on the geometrical accuracy, permits the most cost-effective choice for each case individually. Our comparison of an entry level, low cost (FVM model printing parameters with FDM technology: print- ing time: 343 min, total cost 198€(euro), printing material cost 1
€/cm3. Spine T11-L3 model printing parameters with FDM technol- ogy: printing time:660 min, total cost 336€, printing material cost 1€/cm3) and a high category, expensive and highly precise (FVM model printing parameters with DLP technology: printing time:
294 min, total cost 355€(euro), printing material cost 3,2€/cm3. Spine T11-L3 model printing parameters with DLP technology:
printing time: 353 min, total cost 605€, printing material cost 3,2€/cm3). Our results provide evidence that a cost-effective tech- nology can be more than suitable for patient specific 3D printed spine physical models. The size of surface irregularities, even
though somewhat larger for the FDM model, are tactually adequate for providing the surgeon with a tangible physical model during surgical planning, therefore the advantage of superior printing pre- cision of the more expensive DLP models is lost.
5. Conclusions
Testing the accuracy of entry level (lower cost) 3D printing technologies, that are locally available on the healthcare market, is important for every clinician using such methods in surgical planning or education. Our study has proven that a more cost- effective technology is sufficiently precise in case of 3D printed physical models of the spine. If other less expensive technologies can similarly be proven to be adequate for several purposes, then the cost of 3D printing technologies can be reduced to a level that is not only acceptable for healthcare systems but will promote their widespread use.
Sources of support
AL was funded by the Hungarian Scientific Research Fund grant Budapest, Hungary, award number: OTKA FK123884.
PEE is the recipient of EFOP-3.6.3-VEKOP-16-2017-00009, ‘‘Az orvos-,egészségtudományi-és gyógyszerészképzés tudományos m}uhelyeinek fejlesztése”.
The financial support from these funding bodies is gratefully acknowledged.
Acknowledgements
The author would like to thank to Julia Szita, PhD student, National Center for Spinal Disorders, Budapest for constructive criticism and the proofreading of the manuscript.
Fig. 9.Application of the FDM 3D printed model in the surgical planning process in congenital scoliosis.AThe segmented 3D geometry (triangulated surface mesh) of the thoraco-lumbar junction (L.1 hemivertebra) in anterior and posterior view.BI-II3D printed physical model of the same thoraco-lumbar section as inA.CTitanium rods were introduced in the pedicle, in the optimal axis of the screw insertion, as planned for the surgery.DInternal grid structure of the FDM model with the inserted titanium rod (axial CT scan).E-FPost-operative standing X-rays shows the screws (correction and stabilization from Th9 to L4 with Mesh cage) inserted in the correct position, helped by the visual guidance provided by the rods inserted in the physical model, (E) lateral view, (F) antero-posterior view.
P.E. Eltes et al. / Journal of Clinical Neuroscience 72 (2020) 438–446 445
References
[1] Petrick IJ, Simpson TW. 3D printing disrupts manufacturing: how economies of one create new rules of competition. Res Manag 2013;56:12–6.https://doi.org/
10.5437/08956308X5606193.
[2] Berman B. 3-D printing: the new industrial revolution. Bus Horiz 2012;55:155–62.https://doi.org/10.1016/J.BUSHOR.2011.11.003.
[3] Rengier F, Mehndiratta A, von Tengg-Kobligk H, et al. 3D printing based on imaging data: review of medical applications. Int J Comput Assist Radiol Surg 2010;5:335–41.https://doi.org/10.1007/s11548-010-0476-x.
[4] Wilcox B, Mobbs RJ, Wu A-M, Phan K. Systematic review of 3D printing in spinal surgery: the current state of play. J Spine Surg 2017;3:433–43.https://
doi.org/10.21037/jss.2017.09.01.
[5] Li Z, Li Z, Xu R, et al. Three-dimensional printing models improve understanding of spinal fracture—a randomized controlled study in China.
Sci Rep 2015;5:11570.https://doi.org/10.1038/srep11570.
[6] Bernhard J-C, Isotani S, Matsugasumi T, et al. Personalized 3D printed model of kidney and tumor anatomy: a useful tool for patient education. World J Urol 2016;34:337–45.https://doi.org/10.1007/s00345-015-1632-2.
[7] Martelli N, Serrano C, van den Brink H, et al. Advantages and disadvantages of 3-dimensional printing in surgery: a systematic review. Surgery 2016;159:1485–500.https://doi.org/10.1016/J.SURG.2015.12.017.
[8]Organization WH. World report on ageing and health. World Health Organization; 2015.
[9] Beard JR, Officer A, de Carvalho IA, et al. The World report on ageing and health: a policy framework for healthy ageing. Lancet 2016;387:2145–54.
https://doi.org/10.1016/S0140-6736(15)00516-4.
[10] Ben-Ner A, Siemsen E. Decentralization and localization of production: the organizational and economic consequences of additive manufacturing (3D
Printing). Calif Manage Rev 2017;59:5–23. https://doi.org/10.1177/
0008125617695284.
[11]Kikinis R, Pieper SD, Vosburgh KG. 3D Slicer: a platform for subject-specific image analysis, visualization, and clinical support. In: Intraoperative imaging and image-guided therapy. New York, New York, NY: Springer; 2014. p.
277–89.
[12] Bharatha A, Hirose M, Hata N, et al. Evaluation of three-dimensional finite element-based deformable registration of pre- and intraoperative prostate imaging. Med Phys 2001;28:2551–60.https://doi.org/10.1118/1.1414009.
[13] Cignoni P, Callieri M, Corsini M, et al. Meshlab: an open-source mesh processing tool. In: Eurographics Italian chapter conference; 2018. p. 129–36.
[14] Cignoni P, Rocchini C, Scopigno R. Metro: measuring error on simplified surfaces. Comput Graph Forum 1998;17:167–74. https://doi.org/10.1111/
1467-8659.00236.
[15] van Eijnatten M, van Dijk R, Dobbe J, et al. CT image segmentation methods for bone used in medical additive manufacturing. Med Eng Phys 2018;51:6–16.
https://doi.org/10.1016/J.MEDENGPHY.2017.10.008.
[16] George E, Liacouras P, Rybicki FJ, Mitsouras D. Measuring and establishing the accuracy and reproducibility of 3D printed medical models. RadioGraphics 2017;37:1424–50.https://doi.org/10.1148/rg.2017160165.
[17] Zheng Y, Yu D, Zhao J, et al. 3D printout models vs. 3D-rendered images: which is better for preoperative planning?. J Surg Educ 2016;73:518–23.https://doi.
org/10.1016/J.JSURG.2016.01.003.
[18] Kadoury S, Labelle H, Paragios N. Automatic inference of articulated spine models in CT images using high-order Markov Random Fields. Med Image Anal 2011;15:426–37.https://doi.org/10.1016/J.MEDIA.2011.01.006.
[19] Yao J, Burns JE, Forsberg D, et al. A multi-center milestone study of clinical vertebral CT segmentation. Comput Med Imaging Graph 2016;49:16–28.
https://doi.org/10.1016/j.compmedimag.2015.12.006.