520
Gábor Béla Süveges
University of Miskolc Hungary
The Key Factors of the Application for the Activity-Based Costing in Projects Financed by the European Union
Abstract:
In recent years more and more studies have dealt with the practical usage of activity-based costing.
During the last three decades the area of the application became wider and wider. This type of costing system was first recommended to production companies, but after some years it became obvious that it could also be widely used by both service companies and financial institutions. Both academics and practitioners find activity-based planning a good tool for the budgeting and the coordination of projects. The aim of this study is to draw attention to a new possible application of this type of costing in special type of projects: EU applications. Several plans are needed for an EU application, but there is no requirement to show the connection between the costs and the indicators/outcomes. The first part of the paper shows how prevalent activity-based budgeting was in Hungary in case of EU grant applications in the period 2007-2012, and the main part of the paper introduces a model to adopt activity-based costing in these types of projects. The research question is what the key factors are for application the method in this new area. The research work based on previous studies of the adoption of the method in different sectors.
Keywords: Activity-based costing, EU application, activity-based cost plan, business process analysis, resource drivers, activity drivers.
JEL Classification: M4.
Introduction
In accordance with The New Hungary Development Plan, Hungary was eligible for a development fund of EUR 22.4 billion between 2007 and 2013, so that it could re-align itself with advanced countries (National Development Agency, 2007). The financial framework for projects must be used as efficiently as possible in order to achieve these targets. The study evaluating the impact of the National Development Plan (running from 2004 to 2006) operative program points out that, although the effectiveness was measured using the indicators of the operative program, the aspect of efficiency however was not among the factors examined. As a result, “the different indicators were not able to highlight the source of the different output results and effects, and how effectively were the available financial resources used (the specific costs of new jobs created, the average cost of reconditioning a road per km, or the average cost of qualification)” (Rechnitzer et al., 2007, p.15). Therefore the study
521
commissioned by The National Development Agency offers recommendations with regards to indicators for a more direct detection of relationships and influences.
This decision, however, could only be achieved partially during the period 2007-2013, since “it is difficult to identify a direct relationship between the different level indicators, i.e. conclusions regarding the overall program effectiveness using performance data taken from the projects can be limited. The reason for this is that the indicators are often by nature (for example, some impact indicators) not capable of separating the effects of the interventions from the outside influence of socio- economic events on the Operative Programme” (KPMG, 2011).
Because of the lack of direct relationships the practical application of “the value for money” principal that ensures efficiency and efficacy can be difficult. According to this principle, during the implementation of projects the use of resources efficiently, effectively and in line with ethical standards and the development of transparent selection policies with set accountabilities have to be continuously and increasingly enforced. In order to achieve this, the project must demonstrate, among other things, that the calculation of the contractual prices is transparent and reflects the normal remuneration in the market, and also that the relationship between the amounts paid and the performance is clear (National Development Agency, 2008). Since the relationship between indicators and actions is not in all cases direct or clear, proving what the usual market prices are may not be possible.
My assumptions is that with the application of management accounting tools, the relationship can be established between the results of projects, actions and costs. One of the most important areas of management accounting is cost allocation and cost calculation/management. In recent years various innovative methods have been developed in this regard, which may be used by various companies.
Judgement of accountancy is not unified; it is handled differently by different economic actors. There can be conflicting viewpoints even within the profession as well. Some opinions attribute too big and too important a role to the accountancy and they tend to regard it as an objective to reach. The real objective is, of course, to give the most accurate picture of the pecuniary, financial and profitability situation of the company on the level of activity-doers. Thus, accountancy can be an instrument which helps in achieving company objectives, and in this way it can contribute to the creation of value and the fruition of a company’s vision and mission (Pál, 2003).
Primarily, financial accounting is for external economical participants, it serves their interests, providing them with information and for the sake of comparability its content and functional elements are regularized on the level of law (Kardos et al., 2007). By management accountancy we mean users inside of an economic unit and the methods and procedures used to satisfy their information demand and help in decision making. “The role of management accounting differs from another field of accounting and because that management accountants work at the “beginning” of the value chain, supporting decision making, planning and control” (Alnajjar & Siam, 2011, p. 139).
The present study aims to demonstrate how management accounting tools can be used to determine the specific costs of program results implemented using EU funds, and to highlight key issues in this area.
The study is based on primary research that introduces methods to combine activities with costs, and seeks an answer to the question of whether it is possible to determine the direct sources of the results and effects.
522 16 Literature Review
16.1 Theoretical Background
Since in the case of projects a bottleneck is created by the establishment of the relationship between activities and costs, this review focuses on key moments when allocating indirect costs. The problem of cost allocation arose first in the second half of the 19th century. The early cost allocation systems did not deal with assigning general costs to products, the costs of locking-up of capital. At that time the tracking of direct use of labour and material was in the centre of cost calculations (Musinszki & Pál , 2010).
After World War II significant changes occurred in the economic processes. Due to the spread of mechanisation, mass production and automated systems, the cost structure of companies changed.
While earlier the direct costs made up the majority of expenses, in a couple of decades the largest amount of the expenses was comprised of general costs (general costs can amount to 500-1,000% of the direct wage costs) (Kaplan & Cooper, 1987).
The traditional costing systems worked well for the enterpreneurs so long as direct costs comprised the biggest part of the costs. The general costs were divided between the cost units by a special calculation;
however, the new circumstances tended to cause misleading results (Körmendi & Tóth, 1999).
Although the changing circumstances were obvious to nearly all economic parties, it was only later that they were built into economic calculations when planning, dividing and predicting costs. In the 1980s many researchers worked on developing costing and performance evaluating systems that suited the new circumstances. Kaplan and Cooper (1987) excelled by introducing their new activity-based costing system.
Kaplan and Cooper – in their Four-Stage Model of Cost System Design – sorted the costing systems in accordance with their temporal development and differentiated them into four levels. The systems were analysed by several criteria:
1 the quality of the analysed data, 2 the method of outward accounting,
3 how the attribution of costs to products and customers is carried out, and 4 how supportive is it to the operative and strategic control.
Kaplan and Cooper regard the fourth level to be ideal for entrepreneurs, as it is comprised of connected databases and systems and is suitable for operational and strategic performance measurement. They found that most of the companies investigated – at the time of the analysis – were on the second level.
These entrepreneurs are able to make a complete accounting at the end of the accounting period and meet the requirements of financial reporting. However, these systems were not adequate to identify the costs to customers or to monitor the costs of the services.
There are further problems for entrepreneurs associated with the second level systems:
There are no reporting requirements for the specific and general costs of services and customer orders,
523
There is no financial system that would measure the cost of the centres responsible,
They do not know the costs of the specific products, services, or costs to the customers, or the costs of activities and processes. (Kaplan & Cooper, 1987)
Based on a critical evaluation and analysis of application systems mentioned in the introduction, it can be established that the current systems bear the characteristics of the second-tier/level cost accounting systems; although the costs of processes are known, the relationships between individual or general costs and the customers are not established.
The first- and second-level systems worked very well until the end of the 1950s, as up until then the proportion of indirect costs were insignificant in the cost structure. Kaplan and Cooper (1987) considered the appropriate processes to be Activity-Based Costing (the third level) and other integrated systems, such as Activity-Based Management (the fourth level).
Activity-based methods are based on cause-and-effect relationships and use two steps – resource and activity-based cost drivers – to connect costs to cost bearers. ABC can be defined as a mathematical model in a narrow sense of the word, the main aim of which is to attribute costs to objects and help the analysis of correct profitability (Körmendi & Tóth, 1999).
Applying this method, activities which use the resources of the company can be identified, and the prices of activities and business processes can be calculated. It can be found why certain activities and processes should be executed and which of these are unnecessary (Sebestyén, 2003).
Forming the ABC system can be carried out through four connective steps (Kaplan & Cooper, 1987):
Catalogues of activities should be formed, that is, indirect and additional activities should be defined.
Costs of resources should be allocated to activities. Resource-based resource drivers connect the costs with the activities carried out.
Identification of products, services and customers of the company and examining of the given activity.
Choosing resource drivers that connect the cost of activity to the products, services and customers of the company.
Practical experience proves that using the ABC method may result in more effective company and cost management.
In addition to activity-based costing, of course, there are other types of cost calculations in existence;
these include, for instance, Kaizen Costing (Cooper & Slagmulder, 1997), the American system of Continuous Improvement (Kaplan & Sweeney, 1997) or the Quasi profit system (Cooper, 1994);
however further parts of this study will only deal with activity-based costing from the viewpoint of business applications.
524 4.1 Previous studies
Both academics and practitioners have been intensively interested in activity-based costing/cost management since the late 1980s, as the 404 papers published between 1987 and 2000 show well (Bjorneneak & Mitchell, 2002). Another study examining the topics of the papers published between 1997 and 2007 showed that “ABC was primary used to
enhance productivity and efficiency in the business process,
help create budgets and set prices,
identify customer costs and improve customer relations,
make decisions on strategic issues,and
address external negotiation issues” (Chung & Khan, 2008, p. 4385)
During the last three decades the area of the application has become wider and wider. This type of costing system was first recommended to production companies, but after some years it became obvious that it could also be widely used by both service companies and financial institutions. In a short time ABC systems have been implemented by banks (Cross & Majikes, 1997) healthcare organisation (Baker, 1998), airlines (Alnajjar & Siam, 2011), government organisations (Carter et al., 1998), telecommunications organisations (Hobdy et al., 1994) and insurance firms (Turney, 2008).
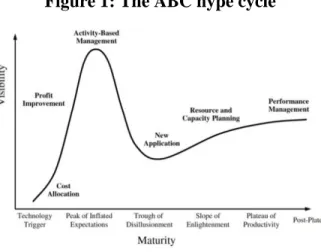
Turney identified five phases in the popularity, or hype, of the ABC method. The last one is the so- called “Post-Plateau”, where the interpretation expands and ABC becomes part of Performance Management.
Figure 1: The ABC hype cycle
Source: Turney, P. B., 2008.
In his opinion “ABC supports the preparation of budgets and long-term plans that are logically derived from strategic goals and consistent with the relationship between goal achievement and resource intensity” (Turney, 2008, p. 10).
Other experts support this view: “a company which works primarily on projects (or unique rather than routine tasks), needs a Project Management Information System”, which is part of an ABC analysis (Roztocki, 2001, p 1454). Other authors have proposed using ABC especially for projects (Raz and
525
Elnathan, 1999). These studies show that important changes have been happening in the adoption of the activity-based costing in the last decade or so. The budgeting fuction supplements the allocation function and ABC has become a tool of Performance/Project Management.
The following parts of the study are based on primary research, describing how the linking of activities and costs of a specific type of project is realised in the case of applications in the EU during the period 2007-2012. First the identification of the ABC’s four steps for projects is presented, including the limitations in this area. The basic hypothesis is that with the application of the appropriate management accounting tools a relationship can be established between the funding sources, the activities and the outputs.
5 Presentation of research
5.1 Description of Methodology
The novelty in activity-based costing was, in contrast to the simple, traditional methods, that for companies with high overall costs it accurately determined the costs of the outcome of corporate actions – goods and services. In some applications the outputs of the projects are unequivocal and clearly visible even for the external observer. In these cases, when examining the overall budget of the project it is relatively easy to assign each output. However, in the case of projects where the results are relatively diverse, or cannot be identified immediately, it is especially important to ensure transparency.
Therefore the research focused on applications that funded knowledge-intensive, innovative or R&D activities. Within these projects 10 higher education institutions in Hungary assumed key roles, having received the title of research-intensive university or University of National Excellence in April 2010.
Thus the basis of the analysis and the elements of the sample were made up by the projects and applications submitted by these institutions. For the data collection the Application Offices of the Institutions and the open information of the National Development Agency was the base.
5.2 Data analysis, results
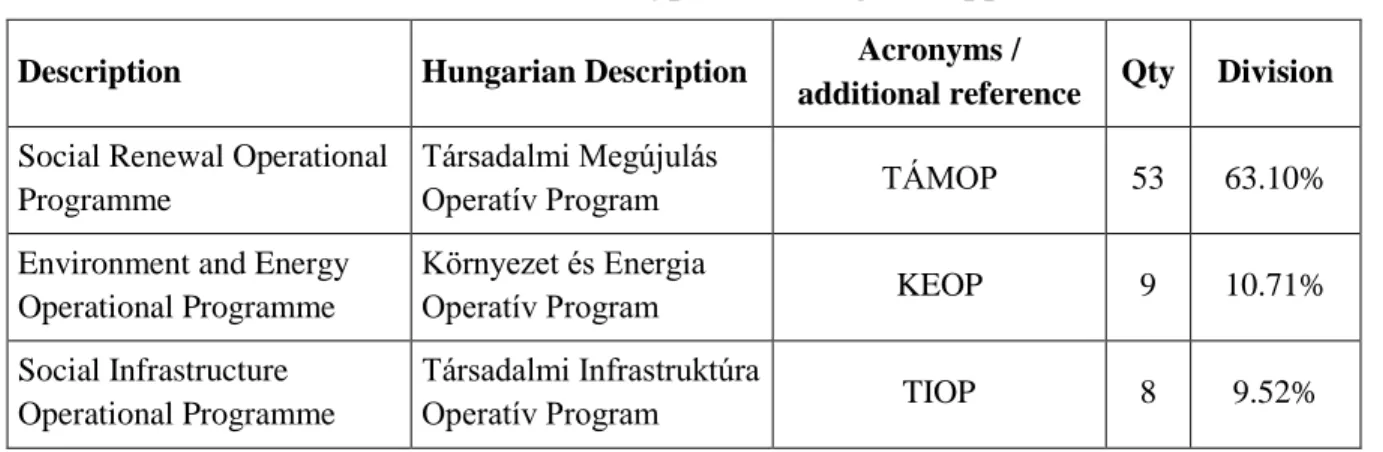
Based on the available data, the institutions handed in 150 applications between 2007 and 2012. As it was possible for more than one university to be involved in one project proposal, the duplication had to be filtered, therefore 84 different applications remained. These applications belong to different Operational Programmes, as shown in Table 1.
Table 1: The number and type of investigated applications Description Hungarian Description Acronyms /
additional reference Qty Division Social Renewal Operational
Programme
Társadalmi Megújulás
Operatív Program TÁMOP 53 63.10%
Environment and Energy Operational Programme
Környezet és Energia
Operatív Program KEOP 9 10.71%
Social Infrastructure Operational Programme
Társadalmi Infrastruktúra
Operatív Program TIOP 8 9.52%
526 Central Hungary
Operational Programme
Közép-Magyarországi
Operatív Program KMOP 7 8.33%
Economic Development Operational Programme
Gazdaságfejlesztés
Operatív Program GOP 3 3.57%
North Hungary Operational Programme
Észak-Magyarországi
Operatív Program ÉMOP 1 1.19%
North Great Plain Operational Programme
Észak-Alföldi Operatív
Program EAOP 1 1.19%
South Transdanubia Operational Programme
Dél-Dunántúli Operatív
Program DDOP 1 1.19%
South Great Plain Operational Programme
Dél-Alföldi Operatív
Program DAOP 1 1.19%
Total 84 100%
The applications were analysed to determine at which level the costs, actions and results were assigned.
This took place in two dimensions:
First, in which part of the applications can the specification of assignment be found?
o Project data sheet o Detailed budget o Feasibility study
21 of the 84 applications partially included an assignment plan of the cost, actions and results, however in some of these cases no such assignment specification was required.
The second dimension was the assignment depth, and in this category I specified three different levels, as follows:
1. Level 1: Hungarian enterpreneurs must register costs by cost items in accordance with the Act on Accountancy and might choose registration by cost centers and cost bearers as well. In case of applications the applicant organisation has to plan its costs by cost bearers and cost centers too. In one part of the detailed budget a table must be filled in to allocate the cost to the following activity categories:
a. preparation costs
b. costs of the project management
c. costs related to the technical realisation d. costs of services related to realisation e. costs of other services
f. support for the target groups
527 g. cost of procurement of the assets
h. other costsFor this level can be added those plan tables that include the time dimension as well.
2. Level 2: In some of the applications, some of the categories had to be detailed as determined in the guidelines for the proposal, so they had to highlight the other potential supportive activities they had chosen within the main categories and determine what the cost was for the future.
3. Level 3: The highest level of the costs, activities and results assignment plan were those applications where they tried to assign indicators to the activities and thus they tried to determine the cost of the activities.
4. Level 0, no cost assignment required; in some of the applications there was no cost-activity assignment at any level.
Table 2: Linking levels of cost, activities and results based on the project datasheets of the examined applications
TÁMOP KEOP TIOP KMOP GOP ÉMOP EAOP DDOP DAOP Total No % No % No % No % No % No % No % No % No % No %
0 3 5.66 4 44.44 1 12.50 1 14.29 1 100 1 100 11 13.1
1 50 94.34 7 87.50 3 42.86 3 100 1 100 1 100 65 77.38
2 5 55.56 3 42.86 8 9.52
3 0 0
Total 53 9 8 7 3 1 1 1 1 84
Based on Table 2, we can conclude that in the project sheets the first level of assignment happens in most cases, so there is no link between activities and results. A slightly more detailed activity-based breakdown (Level 2) was observed in case of the applications of KEOP and KMOP.
Table 3 shows the results of the results of the detailed budget.
Table 3: Linking levels of cost, activities and results based on the project datasheets of the examined applications
TÁMOP KEOP TIOP KMOP DAOP Total No % No % No % No % No % No % 0
1 49 92.45 1 16.67 8 100 3 60 1 100 62 85
2 5 83.33 5 7
3 4 7.55 0 4 5
Total 53 6 8 5 1 73
528
We can see that all of the applications contained detailed budgeting. In most of the applications the first level is the most typical assigment form. The KEOP applications, where they were expecting a deeper, activity-level breakdown (as explained in the invitations to apply), exceed the average,
An important detail is that 4 TÁMOP projects included the highest level of cost, activities and results assignment. In these plans there were activities assigned to results.
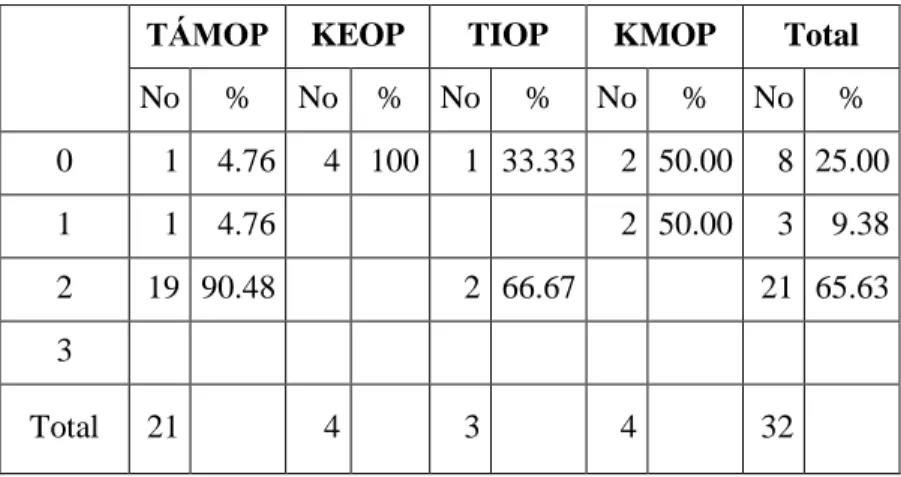
Table 4: Linking levels of cost, activities and results based on the feasibility studies of the examined applications
TÁMOP KEOP TIOP KMOP Total No % No % No % No % No % 0 1 4.76 4 100 1 33.33 2 50.00 8 25.00 1 1 4.76 2 50.00 3 9.38 2 19 90.48 2 66.67 21 65.63
3
Total 21 4 3 4 32
Based on the analysis, a feasibility study was a requirement in 38% of the applications. The majority of the feasibility studies required cost allocation based on the eligible activities to be determined by the applicants.
Based on the examined applications, the statement quoted in the introduction that “the indicators used were not adequate to show what resources were directly available to conclude a variety of outputs, results and impacts” is judged to be true for the period of 2007-2013 as well.
Furthermore, the study shows the key questions and possibilities for more efficient assigment of the costs, outputs and results.
6 Possibilities for the Assignment of cost, activities and results 6.1 Review
In the above examinations mainly the TÁMOP projects were shown, as the role of the detailed budgeting and feasibilty studies was largest for this group of the Operational Programme. During the evaluation of detailed budgets, in 4 cases efforts were seen to link costs, activities and results. These 4 applications had similar topics and were in the same group. The link of the mentioned factors took place in the plan of the detailed budget titled “Activity based cost plan”. The name of this plan is very similar to the Kaplan and Cooper kind of activity-based costing.
This part of the research investigates the similarities and differences between the methods found in the literature and the action-based plan that was found in the applications. The aim of the research is to
529
present how feasible the steps of Kaplan and Cooper’s “action based cost-accounting” can be for applications of this type. For the comparison the example of a concrete application (TÁMOP 4.2.1. B) will help.
The project, entitled “Improving the Quality of Higher Education on the Basis of the Development of Centres of Excellence in Strategic Research Fields of the University of Miskolc”, was launched on 3 March 2011. Its total budget is 2,140,096,850 HUF (7,133,656 EUR, based on the rate of 300 HUF/EUR), 95% of which comes from grant funds. The objective of the project is to increase the attraction of the University of Miskolc to potential students, employers and industrial players through improving quality and aiding the economic and social modernisation of the region. In order to achieve this aim the University of Miskolc intends to build up the intellectual potential necessary to carry out international-level R&D&I (innovation) activities in strategic research fields of primary social and economic importance. The objective of the project can be described by four strategic aims:
development of intellectual potential, development of research infrastructure, quality improvement of strategic research fields and improvement of the institutional network. These aims are to be achieved by four Centres of Excellence of strategic importance.
6.2 Key factors to use the activity-based methods in EU applictions Step 1: Activity catalogue configuration
As the first step of the activity based cost-calculation, the activities were performed with the direct and incidental resources needed to be defined, so they built an activity catalogue that enumerates and defines every activity that was carried out in the production unit (Kaplan & Cooper, 2001). The first big difference between the applications and the ABC divison can be seen at this step.
While in the case of the application there is an activity identification, a division, here it is not only about the direct activities but also about the overall application goals. Figure 2 depicts the first step.
The definition of the basic objective and sub-objectives to be achieved is obtained from the invitation to apply. Activities for the purpose of research can be defined as a list of eligible activities.
The next step was to divide the activities into sub-activities in an appropriate way. They should be detailed, and costs, amounts, indicators and activity benchmarks should be attributed to them (Mabberley, 1996). The applicants need to take this step in their applications and in accordance with their strategies.
Step 2. Determining the cost of activities
It is important that the applicants understand the activities and the exact content of the sub-activities.
This means that they need to know in detail what the activity is, what parts it is divided into, which cost elements are added and what the results are. The application contains a detailed financial plan whose written justification enumerates the cost elements able to be planned for the exact activity.
Determination of the costs of the activities – and based on this, the cost elements – can be described as task assignment.
This is important because in the second step the costs of resources must be connected to the activities done and the resource-based resource drivers. When planning the costs it was estimated what kind of
530
resources can be attributed to different activities. In most cases this attribution was obvious, which means that it was easy to identify the costs and expenses of a given activity. (Interestingly enough – due to the type of application –the most obvious correspondence was in case of costs which are usually considered as indirect: management, publicity and information.) However, in some cases the activities overlap and are built on each other so it was planned how much time the project participants would spend on each activity and ratios were set up. The Accountable Costs project document had to take into consideration the definitions concerning the costs which can be accounted for different groups of Activities for Development Purposes.
Figure 2: Identification of the activities, the costs and the indicators in the application
Figure 2 shows the interconnection depth of the above-mentioned cost, activity and result levels, as well as level differences. (For the second level, costs have to be distributed for the sub-activity levels that were implemented by the applicant, while on the first level it was adequate to assign for the overall activity levels.)
Step 3: identification of the organisation's products, services and customers
In this step all of the organisation`s products, services and customers have to identified. This step can be interpreted as a symbolic question, whether we need to perform the activities or the processes. We can get the answer for this question if we assign the activity costs for the products, services and customers (Kaplan & Cooper, 2001).
Key Objective
Application Goals
Indicators Eligible activities
Activities for development purposes
A. Preparation
Subactivities
B. Pofessional implementation of the project
1. R&D strategy documents Development of institutional relationsDevelopment of R&D infrastructureDevelopment of R&D infrastructureDevelopment of intellectual potential
2. Development of intellectual
potential
3. Improving the quality of research areas
4. Development of institutional relations
C. Other activities
1.1.
1.2.
...
1.5.
2.1.
2.6.
...
3.1.
3.2.
...
3.6.
4.1.
4.2.
4.3.
5. Creating visions of the organizations
5.1.
5.3.
5.2.
6. Management and administration
6.1.
6.3.
6.2.
7. Information and publicity
7.1.
7.3.
7.2.
8. Other general support
8.1.
8.3.
8.2.
Accountable costs
Cost of subactivities Outputs
Results Effects
Indicator 1...Indicator nIndicator 2 Effect 1Effect n
The key objective: Increasing attraction of higher education through quality and excellence development
STEP 1 STEP 2 STEP 4 STEP 3
531
This step was found in a limited level only in those four applications that were judged to be on the 3rd level. In the cost plan that was found in the four applications, every single activity had to be assigned an indicator that was also used for the measurement of results. However, this type of assignment was not clear, nor was it fully reflected in the final price of the project results, as it was not determined how the indicators impact each other, whether one activity could belong to several indicators or whether one indicator could contain several activities.
For applications, a key factor is the identification of the products, services and customers, thus, by extension, identifying the outputs. These final outputs can be found in the proposal indicators.
The output side indicators can be categorised into three types:
The output or output indicators relate to activities as they quantify the direct results of operations. They typically measure physical elements, the resources used in the program flowing to the program show the almost automatically expected outputs. Output indicators therefore take into account the activities carried out as "products." However, these are not the actual objectives of the program, but the devices to achieve the goal.
The scorecards relate to the immediate and direct effects of the project. They provide information about the changes related to the direct participants and recipients. These can be either physical indicators or financial indicators (e.g. reduction of travel costs).
Impact indicators refer to the consequences of the project, which typically occur both immediately and longer term. Indicators help to measure at what level the test program achieved its aims. The occurrence of effects almost exclusively depends on factors irrespective of the project (FMM).
For projects there must be clear definitions of the indicators and it should be possible to show their impact on each other as well.
Step 4: activity cost link to the organisation’s products, services and customers
In activity-based costing’s last and key step, the activity costs and results proper linking will happen with the use of a causal relationship. This clear linking did not happen in the applications, which probably was caused by the lack of the indicators effect mechanism.
The applicants must find clear answers to the following questions:
Which indicators’ performance contributes to the activity?
What actions are necessary to create the indicator unit?
What is the relation among the output, outcome and impact indicators?
To clarify the questions, the description of application goals and indicators are needed from the applicants, as well as the understanding of the strategic goals, activities and results, in which the Logfram (logical framework) can be useful.
As soon as the references are clearly understandable, it becomes possible to use different methods for the unit cost calculations, which concerns the following sections:
532
The unit cost of the output indicators,
The unit costs of effect outcome indicators,
The unit cost of feasibility impact indicators.
The different unit costs demonstrate the results of the project cost, and the unit of the project implementation cost.
7 Conclusions
The purpose of the study was to analyse the main factors in connecting the charges, the activities and the measureable results in grant applications. From the analysed sample it can be said that basically the costs are assigned to activities in grant proposals; however, the results of the activities are not assigned to activities. In this case the bottleneck can be the identification, explanation and the determination of the matching connection points of the indicators. This can be resolved primarily from the side announcing the grant.
In the analysed proposals the activity-based spending plan is not equal to the showcased ABC of Kaplan and Cooper – on the one hand because there is no actual unit costing, on the other hand because the grant proposals aim to divide all the activities, direct and indirect, while Kaplan and Cooper concentrate on the indirect charges.
In analysing the proposals it can be shown that the requirements for exterior data retrieval comply with the traditional types of management accounting tools (for example the attribution of the charges to the activity branches or the activity approach planning) or rather with the perspective or approach of these conventional methods. So the sharp lines between the functional collateral sections of accounting become fuzzy and judgement of them is not homogenous, so that in many cases the expectations define whether the given tool can be considered a financial or a managerial approach.
At the same time we can determine that the theory and the practice of management accounting do not overlap completely, the practice does not follow the theoretical examples in many cases, and the level of actual usage lags behind that of the theoretical models. From this, it follows that the development of management accounting does not mean the theoretical creation of new tools, but rather the adoption and use of the extant tools in practice.
Acknowledgement:
The described work was carried out as part of the TÁMOP-4.2.2/B-10/1-2010-0008 project in the framework of the New Hungarian Development Plan. The realisation of this project is supported by the European Union, co-financed by the European Social Fund.
References:
Alnajjar, I. A. & Siam, W. Z., (2011). The ability of Application Activity-Based Costing system on the Air Lines Companies: The Case of the Jordan Aviation Company. European Journal of Economincs, Finance and Administrative Sciences, 38, pp. 138-154.
Baker, J. J., (1998). Activity-Based Costing and Activity-Based Management for Healthcare.
Gaithersburg, MD, Aspen Publishers Inc.
533
Bjorneneak, T. & Mitchell, F., (2002). The development of activity-based costing journal literature, 1987-2000. The European Accounting Review, 11(3), pp. 481-508.
Carter, T. L., Sedaghat, A. M. & Williams, T. D., 1998. How ABC changed the post office.
Management Accounting, 79(8), pp. 28-35.
Chung, H. M. & Khan, B. M., (2008). An analysis of Activity-Based Costing (ABC) Project Implementation. Baltimore, Maryland, 39th Annual Meeting of the Decision Sciences Institute, pp.
4381-4386.
Cooper, R. & Slagmulder, R. (1997). Kaizen Costing and Value Engineering, Confrontational Cost Management, Vol. 3;. Productivity Press, Portland, Ore., 1997.
Cooper, R. (1994) Higashimaru Shoyu Co., Ltd. (A): Price Control System. Boston: Harvard Business School, Case 9-195-050,
Cross, R. & Majikes, M., (1997). Activity-based costings in commercial lending: the case of Signet Bank, Commercial Lending Review. Euromoney, 12(4), pp. 24-30.
The Government of the Republic of Hungary. Social Renewal Operational Programme, 2007-2013.
CCI Number: 2007hu05upo001 [Online] Available at: http://www.nfu.hu/doc/357 [accessed: 25 Nov 2012].
Hobdy, T., Thomson, J. & Shaeman, P., (1994). Activity-based management at AT&T. Management Accounting, 75(10), pp. 35-39.
Kaplan, R.S. & Cooper, R., (1987). Cost&Effect Using Integrated Cost System to Drive Profitability and Performance. USA: Harvard Business School Press.
Kaplan, R.S. & Cooper, R., (2001) Költség & Hatás (Cost and Effect). Panem Könyvkiadó, Budapest, pp.17,29
Kaplan, R.S. & Sweeney A. P. (1997) Romeo Engine Plant. Harvard Business School Case, 9-194-032, p.1.
Kardos B., Szantó I. & Veress A. (2007): A vezetői számvitel alapjai. (Basics of Management Accounting). Budapest, Saldo Pénzügyi Tanácsadó és Informatikai Zrt.
Körmendi, L. & Tóth , A., (1999). A controlling elmélete és gyakorlata (The Theory and Practice of Controlling). Budapest: Perfekt Gazdasági Tanácsadó, Oktató és Kiadó
FMM ( ) Foglalkoztatáspolitikai és munkaügyi miniszterium, Indikátor Módszertani Útmutató[Online] Available at: http://www.fde.hu/docs/Indikator-modszertani%20utmutato.pdf [accessed: 21 Maj 2013]
KPMG (2011). Az Operatív Programok félidei értékelésének szintézise (A synthesis of the halfway assessment of the Operative Programme). Budapest: KPMG
Mabberley, J., (1996). Pénzügyi intézmények controllingja (Controlling in Financial Institutions).
Budapest: Panem
Musinszki, Z. & Pál, T., (2010). Költségrendszerek kialakítása és fejlesztése (Creation and
development of cost systems) . [Online] Available at:
http://miskolc.infotec.hu/repository.php?ref_id=1154&cmd=render [accessed: 25 Nov 2012].
National Development Agency, (2007). The New Hungary Development Plan – National Strategic Reference Framework of Hungary 2007-2013. [Online] Available at:
http://pik.elte.hu/file/_MFT_angol.pdf [accessed: 21 Maj 2013]
534
National Development Agency, (2008). 12. sz. melléklet a TÁMOP 2.2.4 pályázati útmutatóhoz:
Értéket a pénzért útmutató (Appendix 12 to the Guide to settling contracts, agency contracts and business contracts, for Social Renewal Operative Programme (TÁMOP) 2.2.4).
Pál, T., (2003). Bevezetés a számvitelbe (Introduction to Accounting). Miskolc: Economix Rt..
Raz, T. &. Elnathan. D., (1999). Activity based costing for projects. International Journal of Project Management, 17(1), pp. 61-67.
Rechnitzer, J., Csizmadia, Z., Grosz, A., Lados, M., Losoncz, M., Tilinger, A., Páthy, Á., Reisinger, A.
& Tóth, P., (2007) ROP Monitoring rendszerének elemzése, Javaslat az indikátorok fejlesztésére (Analysis of the ROP Monitoring system: Recommendations for the development of indicators).
MTA Regionális Kutatások Központja Nyugat-Magyarországi Tudományos Intézet, Győr.
Roztocki, N., (2001). Using the Integrated Activity-Based Costing and Economic Value Added Information System for Project Management. USA, AMCIS.
Sebestyén, Z., (2003). The Application of modern budget calculation methods in production management decision making. PhD dissertation, Budapest University of Technology and Economics Turney, P. B., (2008). Activity-Based Costing - an emerging foundation for performance management,
USA: Cost Technology Whitepaper