VOLATILITY SPILLOVER EFFECT IN WESTERN BALKANS
Milica LATINOVIC – Vesna BOGOJEVIC ARSIC – Milica BULAJIC
(Received: 30 June 2016; revision received: 20 December 2016;
accepted: 3 October 2017)
This article examines volatility spillover among Western Balkan’s stock markets and selected de- veloped markets. If there is an evidence of weak linkage between various markets, then there are potential benefi ts that could arise from international diversifi cation. However, if we analyse the relationship between two markets that are different in terms of their economic development, and if there is a strong connection between them, market shocks from the developed markets can have an impact on the frontier/emerging markets. Market integration can be indicated with returns linkage and transmission of shocks and volatility between markets. Hence, this can have implications for investment strategies. It is found that there is statistically signifi cant regional spillover between countries of the Western Balkan region. Also, there is global spillover between developed markets and this region as well. Furthermore, there is evidence that Western Balkan’s markets are late in response to important market events, and that can be used when formulating investment strategy.
Keywords: volatility spillover effect, multivariate GARCH-BEKK, emerging market JEL classifi cation indices: C58, G15
Milica Latinovic, corresponding author. PhD candidate at the Department of Financial Manage- ment and Accounting, Faculty of Organizational Sciences, University of Belgrade, Serbia.
E-mail: latinovicm@fon.bg.ac.rs
Vesna Bogojevic Arsic, Professor at the Department of Financial Management and Accounting, Faculty of Organizational Sciences, University of Belgrade.
E-mail: bogojevic-arsic.vesna@fon.bg.ac.rs
Milica Bulajic, Professor at the Department of Operations Research and Statistics, Faculty of Or- ganizational Sciences, University of Belgrade. E-mail: bulajic.milica@fon.bg.ac.rs
1. INTRODUCTION
After the big market crashes of the developed stock markets in the 1980s, emerg- ing Asian markets in the 1990s, and especially after the credit crunch of 2008, linkages between stock markets became the focus of many researchers. At the be- ginning, researches were focused on the interaction between stock markets of the developed countries, but till today many researches have explored the connec- tion between developed and emerging stock markets regarding spillover effect.
Shocks and information from one market can have influence on other markets.
Returns, as well as riskiness of stocks can move together if there are links between stock markets of different countries. Content of the information flow can cause disturbances in different parts of the world, or in a region. Such information is important for investors, and therefore it is essential to investigate the existence of linkages throughout the world. When market is not fully integrated in the world’s financial flows, there is an opportunity for investors to create potentially profit- able investment strategy. In recent years there is a growing liberalization and integration of the international financial markets. Furthermore, trading activity is higher in its frequency each day. Hence, nowadays market shocks have bigger effect and investors are very concerned with the volatilities and their transmission and spillover throughout time.
Spillover effect can have a significant influence on the investors’ investment strategies (Hassan – Malik 2007). This paper aims to test whether the Western Balkan’s stock markets are linked among themselves, and to the developed mar- kets around the world. Results of this research might be of interest to the interna- tional investors because of the increasing integration of world financial markets, and making diversification of portfolios a formidable task. To the best of authors’
knowledge no previous studies on volatility spillover regarding Western Balkan region were done in the past.
Volatility represents annualised standard deviation of the returns on invest- ment. Volatility of an asset can be precisely defined as an annualised measure of the dispersion in a stochastic process that is used to model log returns (Al- exander 2008a). Investments or assets can be of various types. Volatility, as a measure of portfolio risk, represents annualised standard deviation of portfolio returns (Alexander 2008b). Also, volatility of a stock price is a measure of un- certainty of future stock price movements and uncertainty about the returns pro- vided by the stock. Hence, volatility of a stock price represents standard devia- tion of the return provided by the stock in one year, when return is continuously compounding. Volatility of a stock is influenced by new information. Investors will revise their opinion about the value of a stock, based on the new informa- tion, and price will change and this will cause volatility to change as well (Hull
2005). According to Ross (1989) generally in an economy that is arbitrage-free, volatility of asset prices is directly connected to the rate of information flow into the market. However, volatility is also caused by trading to a great extent (Hull 2005). Engel et al. (1990) established what can be considered as a defini- tion of spillover. Markets operate sequentially during a day, when one market closes, another opens. Hence, information set for current market comprises of yesterday’s news, and today’s news from the previously closed market. If vola- tility of one market leads to a volatility of other markets (Allen et al. 2013), or if volatility in one market gives rise to lagged volatility in other markets (Lee 2013), these phenomena can be defined as spillover effects. Volatility spillover and volatility transmission are terms that are used interchangeably in the litera- ture (Abbas et al. 2013).
Many researchers have examined the connections that exist between interna- tional financial markets (Lee 2009; Diebold – Yilmaz 2009; Beirne at al. 2010;
Korkmaz et al. 2012; Allen et al. 2013; Abbas et al. 2013; Kohonen 2013; Balli et al. 2015; Khalfaoui et al. 2015). Volatility can be estimated with return-based GARCH models or with range-based CARR (conditional autoregressive range) models (Lee 2013). Multivariate GARCH BEKK model can be used for measur- ing the degree of integration in terms of volatility (Hassan – Malik 2007; Li – Majerowska 2008; Beirne at al. 2010), and it will be implemented in the analysis of this paper.
Results from previous studies are conflicting. Return spillover is present be- tween global, some emerging markets, and between sector indices. However, in some markets these linkages are very weak (Diebold – Yilmaz 2009; Korkmaz et al. 2012). Volatility spillover is found to be present between Asian equity markets and other developed markets (Lee 2009; Abbas et al. 2013; Allen et al. 2013), among euro zone countries (Kohonen 2013). Volatility spillover in the case of some emerging markets is very modest, or there is some specificity in the link- age (Beirne at al. 2010; Korkmaz et al. 2012). There is no volatility spillover trend among global equity markets (Diebold – Yilmaz 2009). Volatility spillover is examined in connection with market crises (Sola et al. 2002), and it is found that it bursts in such events (Diebold –Yilmaz 2009), or is dependent on model specification (Allen et al. 2013).
This paper is organised as follows: Section 2 presents literature review of empirical evidence of volatility spillover between different markets. The third section provides description of volatility of stock returns and also explains mul- tivariate GARCH model that can be used for modelling returns, correlations, and covariances. Empirical evidence of volatility spillover is presented in Section 4.
Section 5 gives a summary and conclusions of the research, and also provides possible directions for further studies.
2. LITERATURE REVIEW OF EMPIRICAL EVIDENCE ON VOLATILITY SPILLOVER
Engle – Susmel (1993) used ARCH model to test if two international markets fol- low the same volatility process. They tested 18 stock markets, and found that the time-varying volatility is region specific. Beirne at al. (2010) used a tri-variate VAR-GARCH (1, 1)-in-mean model for studying regional and global spillovers in emerging stock markets. They examined the spillover in mean returns and volatility in Asia, Latin America, and emerging Europe. They found that spillover is present in most of the emerging markets; however, nature of linkages between markets is different. Spillover in mean is present in Asia and Latin America, and spillovers in variance are present in the emerging part of Europe. They also found that the global spillover is observed in Asia, and the regional spillover can be found in Latin America and Middle East. They concluded that international in- vestors should address the linkage between returns and volatility when creating its investment strategy. Korkmaz et al. (2012) studied return and volatility spillo- ver effects between CIVETS1 countries’ stock markets and found that such effects are very modest. Saleem (2009) presented empirical evidence about the linkages of Russian stock market to the US, the European Union (EU), emerging Europe, and Asia. He found that in terms of both return and volatility spillover, there is a weak link between Russia and other international markets. Integration of Russian market into the world markets is only partial. Balli et al. (2015) researched mean return and volatility spillover from Europe, Japan, the US to some countries of the MENA2 region. They have based their analysis on the variance ratios. This research found that the US shocks are transferred to emerging markets, but the magnitude of its influence varies. The extent of the spillover is determined with economic development. Furthermore, they study determinants of spillover and show that bilateral trade, foreign portfolio investment, domestic market capitali- zation, past colonial ties, and distances are significant in explaining both spillover from the developed countries to the MENA region and its magnitude.
Hassan – Malik (2007) examined the volatility transmission mechanism among sector returns, based on sector indices in the US: financial, industrial, consumer, health, energy, and technology. They used tri-variate GARCH model and the daily return data, to study mean and conditional variance among these six sector indexes. They were interested in volatility transmission since sector index investing had gained popularity among investors. They found evidence of signifi- cant transmission of market shocks and volatilities across different sectors. Such
1 CIVETS – Colombia, Indonesia, Vietnam, Egypt, Turkey, and South Africa.
2 MENA – Asia, Middle East, and North Africa region.
findings show that there is a presence of cross-market hedging and that investors in different sectors are sharing information among themselves. Therefore, inves- tors should follow news from different sectors, because due to the transmission mechanism all sectors will feel its impact. Pati – Rajib (2011) studied volatility transmission between Nifty futures and spot market, and found that there is a violation of a weak form of market efficiency. In the long run, both prices tend to move together. Cointegration suggests that deviations that can appear in the short-run can be eliminated through an arbitrage. Also, there is a unidirectional causality from the futures to the spot market, and there is a spillover of previous shocks and volatility from the futures to the spot market. Volatility of the futures market is ahead of the spot volatility, so investors who are uncomfortable with volatility changes can use the signal from futures markets to adjust their spot portfolios for risk. Khalfaoui et al. (2015) researched relationship between the crude oil market and the G-73 countries. They employed a multivariate GARCH and a wavelet analysis, and analysed the behaviour of the hedge ratio for an op- timal portfolio allocation. They found that there is a strong evidence that the oil prices and the stock market prices are directly affected by their own news and volatilities. The oil and stock prices in the markets under analysis were indirectly affected with other prices. Moreover, they suggest that the market participants should hold more crude oil and less stock, since the stock prices of the G-7 coun- tries are more volatile than the oil prices.
Diebold – Yilmaz (2009) performed an analysis on 19 global equity markets, and found that there is an increasing trend in return spillover, and there is no trend in volatility spillover. The volatility spillover bursts are associated with the events of market crisis. Allen et al. (2013) examined whether there is a vol- atility spillover from the Chinese stock market to Australia, Hong Kong, Sin- gapore, Japan and the USA stock market. For testing purposes they employed Autoregressive Moving Average (ARMA) return equation, univariate GARCH, multivariate VARMA-GARCH, and multivariate VARMA-AGARCH to test for constant conditional correlations and volatility spillover effects across these mar- kets. Especially they have tested differences in volatility spillover before and during the global financial crises. They found the evidence of volatility spillover between these markets. However, results are dependent on model specification in periods of high volatility. The conditional correlation is dependent on time period under consideration, which means that the risk relationships can change quite dramatically in the periods of crisis.
Abbas et al. (2013) studied volatility spillover in regional Asian stock markets.
They have examined the interactions between markets in Pakistan, China, India,
3 G-7 – Canada, France, Germany, Great Britain, Italy, Japan, and US.
and Sri Lanka with developed markets in the USA, the UK, Singapore, and Japan . They found evidence of volatility transmission between the markets that are not in good political relations. However, they are connected in economic terms which introduce transfer of riskiness between countries. Also, volatility spillover be- tween the regional Asian markets is directed from larger to a smaller market.
Further, they found evidence of transmission from the developed markets to the regional Asian markets. Kohonen (2013) explored volatility spillover in Euro- zone equity markets, and found evidence of such effects. It is found that large countries, especially Germany and Italy have large influences on other countries under study. Volatility spillover is observed between small countries, as well.
3. ECONOMETRIC FRAMEWORK
3.1. Properties of volatility
It has been already stated that volatility represents annualized standard deviation of the returns on investment (Alexander 2008a). Volatility of asset returns denotes an important concept since it has many financial applications. It is an important factor for options trading. Volatility modelling enables calculation of value at risk of financial position which is used for risk management. Also, volatility model- ling enables asset allocation under mean-variance framework (Tsay 2005).
Volatility has several characteristics that are commonly found in asset returns, which play an important role in the development of volatility models. Firstly, volatility has a property of clustering. Volatility clustering means that in a certain time period volatility can be very high, and in other time period volatility can be quite low (Tsay 2005). It is observed in clusters; that a large shock in one direc- tion tends to be followed by another large shock in the same or opposite direc- tion. Also, small shocks tend to be followed by small shocks (Abbas et al 2013).
One of the reasons for such behaviour of the returns is that information becomes available in groups, it is not publicly available in equal time periods and returns are governed by information (Brooks 2008). Whether volatility is going to be ob- served in clusters is dependent on the frequency of the input data, and it is most common to appear with the daily data. Volatility clustering is harder to observe when monthly or yearly data is used (Alexander 2008a).
Secondly, volatility evolves continuously, which means that volatility jumps are rare (Tsay 2005). Thirdly, volatility does not converge to infinity. It fluctuates in some range which implies that volatility is often stationary. Fourthly property of volatility is leverage effect. This assumes that volatility reacts differently when there is a substantial price increase, than it does when there is a significant drop in
asset price (Tsay 2005). Leverage effect assumes a substantial increase in volatil- ity, when asset price decreases significantly, and not vice versa. When asset price increases significantly, volatility does not increase to the same extent (Brooks 2008). This effect is the most prominent within stock markets. Usually there is an evidence of a strong negative correlation between stock returns and changes in its volatility. The symmetrical GARCH model cannot adequately capture the lev- erage effect (Alexander 2008a). Hence, these properties of volatility have great influence on volatility modelling.
When modelling volatility, the assumption that returns are independent and identically distributed (I.I.D.) for one period returns can be taken, which im- plies that volatility is constant. Constant volatility is a crucial assumption for option pricing model. In discrete time this assumption is a feature of the equally weighted moving average estimates (Alexander 2008a). If it is assumed that re- turns have some autocorrelation, in that case positive serial correlation leads to a larger volatility estimate and negative serial correlation leads to a lower vola- tility estimate comparing to the case when it is assumed that returns are I.I.D.
(Alexander 2008a). Since it is not accurate to assume that index returns are cre- ated by I.I.D. process, and that volatility is constant, other more advanced models are used to analyse returns of volatility. Since volatility is not constant, but has a property of clustering, the model implemented should take this property into account. GARCH models are designed to capture this property by looking at the conditional volatility. Volatility is conditional on all relevant information up to time ‘t’ (Alexander 2008a).
When trying to model portfolio’s behaviour, asset volatilities, correlations, and covariance exhibit time-varying nature and they are predictable. Assets re- turns correlations can be described with multivariate volatility models, which can capture time-varying feature of returns correlations. To analyse volatility, it is important to learn how the volatility matrix changes over time. In most cases, mean of asset returns is a constant. Modelling volatility matrix is a dif- ficult task, and multivariate GARCH models can be used for formulating such a matrix (Tsay 2006).
3.2. Multivariate GARCH
Contemporary literature suggests that there are various models that can be used for testing spillover effects. ARCH, GARCH and stochastic volatility models can be used for estimating and forecasting volatility. Asset volatility can be estimated with the return-based GARCH models or with the range-based CARR (condi- tional autoregressive range) models (Lee 2013). Most widely adopted techniques
for examining the interactions that exist between various markets are different multivariate GARCH models, since they can capture volatility property of clus- tering. The estimation procedure for ARCH model can also be followed in order to implement the GARCH model in our analysis. If ARCH effects are present then return series can be analysed using both ARCH and GARCH models (Tsay 2005).
In order to examine volatility spillover effects among different developed, frontier and emerging markets, we use multivariate GARCH (m, s)-BEKK model with mean and volatility equations as was proposed by Engle and Kroner (1995).
Under GARCH models, volatility is based on m GARCH parameters, or lagged variances and s lagged ARCH parameters, or lagged shocks or lagged squared residuals.
First step of implementing GARCH (m, s)-BEKK model is to define its mean equation. In our case, to formulate the mean equation we need to test for serial dependence in the return data. If there is no serial dependence in the data, mean equation is not needed, but if there is an evidence of dependence, it should be removed using an econometric model. In order to implement ARMA model to remove autocorrelation, financial time series needs to be stationary and can be tested with augmented Dickey-Fuller test (Tsay 2005; Abbas et al. 2013). We can graph autocorrelation and partial autocorrelation functions, to determine q and p4 order of mean equation. In researches (Hassan – Malik 2007; Li – Majerowska 2008; Balli et al. 2015) AR(1) model were sufficient to estimate mean equation.
ARMA (p,q) model of a single return equation, can be presented with (1):
(1)
where rt is a daily return at time t, and ρp is a parameter associated with p lagged return rt–p. Elements ρ are estimated autoregressive parameters. Element ut repre- sents market innovation or shocks at time t, and θq are estimated moving average parameters (Li – Majerowska 2008; Tsay 2005). After mean equation is defined, its residuals should be tested. Ljung-Box (LB) Q test statistic and Lagrange-LM test are usually used for testing serial correlation and ARCH effect, respectively.
Serial correlation represents correlation of a time series with its past or lagged values. Ljung – Box test is used for detecting serial correlation of higher order (Gujarati 2004), and is performed on standardised residuals (Tsay 2005). Auto- correlation should be removed in order to have adequate mean equations. With
4 p, q are non-negative integers. P represents an order of lag returns in autoregressive process AR(p) that return rt depends on, and q is the order of moving average process MA(q) or the number of past innovations/shocks that return rt depends on.
0 1 1 1 1 ,
t t p t p t t q t q
r ρ ρr ρ r u θu θ u
multivariate GARCH model it is more informative to use multivariate statistics.
Presence of autocorrelation can influence the standard deviation of return se- ries. However, in order to implement GARCH model, ARCH effect needs to be present. ARCH effect represents conditional heteroscedasticity (Tsay 2005). If ARCH effect is statistically significant, it is appropriate to use GARCH to model time-varying conditional variance.
GARCH models volatility in a manner that the estimated variance depends on the lagged squared residuals and the lagged variances. GARCH (1, 1) model can be represented in the following manner (2):
(2)
In the equation (2), H(t) and H(t-1) are conditional variance-covariance ma- trices in moments t and t–1. C is the 2×2 lower triangular matrix of constant terms. Matrix A is a 2×2 matrix of ARCH parameters, or lagged squared residuals parameters. Matrix B is a 2×2 matrix of GARCH parameters (lagged variance).
Diagonal parameters in matrices A and B measure the effects of the past shocks and volatility of market i on its conditional variance. Off-diagonal parameters of matrices A and B measure cross-market effects of shocks and volatility. Hence, volatility spillover is captured with aij and bij (Tsay 2005; Li – Majerowska 2008;
Brooks 2009). If GARCH model is of higher order, aij and bij also capture spillo- ver on higher lags. There are few drawbacks when using GARCH model. There is no direct explanation regarding parameters in the A and B matrices, there is a large number of parameters that needs to be estimated, and numerous model parameters are usually insignificant (Tsay 2005).
There are several GARCH models which describe conditional variance equa- tion in different ways. Which GARCH model will be employed in the analysis depends on the asset class that is being examined, and frequency of the data (Alexander 2008a). Parameters of the GARCH-BEKK model can be estimated with the maximum likelihood function. Criteria of the log likelihood function can be estimated with different numerical procedures like BHHH, BFGS, simplex, and genetic (Tsay 2005; Mladenovic – Nojkovic 2012). Dynamic process of H(t) in the case of GARCH (1, 1) will be represented as (3), since we shall examine relationship that exists between two by two markets from our sample:
(3)
' '
' '
1 .H t C C A u t u t A B H t B
' 11 12 ' 1, 12 1, 1 2, 12 11 1221 22 2, 1 1, 1 2, 1 21 22
11 12 11 12
21 22 21 22
( 1) .
t t t
t t t
a a u u u a a
H t C C
a a u u u a a
b b b b
b b H t b b
For some markets and periods, higher order GARCH models were needed.
Their representations include higher order GARCH and ARCH parameters, and depending on the order of the GARCH model, decide final number of u and H matrices and their a and b parameter matrices accordingly. After that, diagnostics will be checked, and model can be made more fine-tuned if needed (Tsay 2005;
Mladenovic – Nojkovic 2012). When GARCH model is adequately defined, es- timated standardised residuals should not display any serial correlation or con- ditional heteroskedasticity. Hence, they should behave like classical regression residuals (Zivot 2008). With multivariate GARCH model, multivariate ARCH test is used to check whether volatility equation is properly specified.
4. EMPIRICAL RESULTS
This paper is testing the hypothesis that Western Balkan’s and selected developed world’s stock markets are integrated. In order to examine whether the spillover effect exists, broad market indices of some Western Balkan5 countries such as, Serbia (Belexline), Montenegro (Monex), and Croatia (Crobex) were used. In addition to Western Balkan region, stock markets of Hungary (BUX), USA (S&P 500), Great Britain (FTSE 100), and Germany (Dax) were also used. All indices are based on market capitalization. In this analysis only publicly available data were employed. Daily observations were gathered for the period of 05.10.2005 – 31.12.2015 from the official stock market sites and yahoo.finance. All entries are converted to US dollars. We use daily data, since that frequency allows us to examine the property of volatility clustering. Daily returns are calculated as fol- lows (4):
(4) where ri,t represents log return of stock market index i at time t, pi,t is the index price of market i at time t, and pi,t –1 is the index price of market i at time t–1. In total there were 2279 observations for each series. For the dates when one series had missing values due to non-trading activity, data for other time series were removed from the sample.
5 There are no publically available data of other Western Balkan countries.
, , , 1
log(ri t pi t pi t ),
4.1. Descriptive statistics
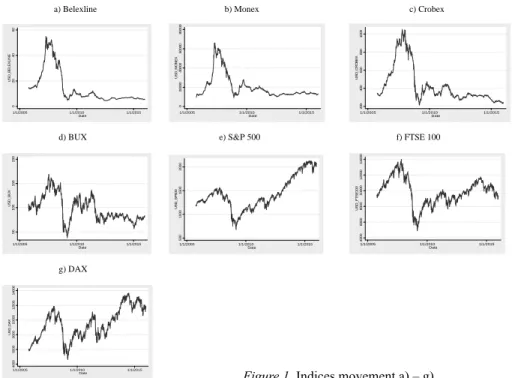
Figure 1 (a-g) displays line graphs of indices movements in the period under research. It is evident from Figure 1 (a-c) that Western Balkan’s stock markets suffered severely after the market crisis of 2008, and that they did not recover yet.
Hungary (Figure 1d), as a large stock exchange market had a period of recovery, followed by a period of downturn of a smaller scale and an upward trend is evi- dent again. Another period of downturn is due to the sovereign debt Eurozone crisis and the Hungarian stock market although it has upward trend after that, still did not recover to full extant. Hungary is a more developed market than the markets in Western Balkan countries are. Also, Hungary is within EU for more than a decade, and in Western Balkan region only Croatia is a member of EU. But Croatia’s EU status is of much shorter duration than Hungary. Size and develop- ment of the markets in question might contribute to the fact that Hungary’s stock market did not suffer such a large decline in index value as Western Balkan coun- tries did. Developed countries (Figure e-g) also, as expected, had a sharp decline in index values during the period of market crisis. However, their recovery and upward trend is more evident than in the case of Hungary. Best results can be seen in the US, since upward movement of S&P 500 value had just two small declines in 2011 (Eurozone crisis) and at the beginning of the 2015 (Oil crisis). FTSE 100
a) Belexline b) Monex c) Crobex
d) BUX e) S&P 500 f) FTSE 100
g) DAX
0204060USD_BELEXLINE
1/1/2005 1/1/2010 1/1/2015
Date
020000400006000080000USD_MONEX
1/1/2005 1/1/2010 1/1/2015
Date
2004006008001000USD_CROBEX
1/1/2005 1/1/2010 1/1/2015
Date
50100150200USD_BUX
1/1/2005 1/1/2010 1/1/2015
Date
500100015002000USD_SP500
1/1/2005 1/1/2010 1/1/2015
Date
400060008000100001200014000USD_FTSE100
1/1/2005 1/1/2010 1/1/2015
Date
400060008000100001200014000USD_DAX
1/1/2005 1/1/2010 1/1/2015
Date Figure 1. Indices movement a) – g)
and DAX, during the same periods, had much larger decline in the value than S&P 500. It is evident that European markets were more under the influence of the Eurozone and oil crises. The more developed countries require less time to recover after a period of crisis.
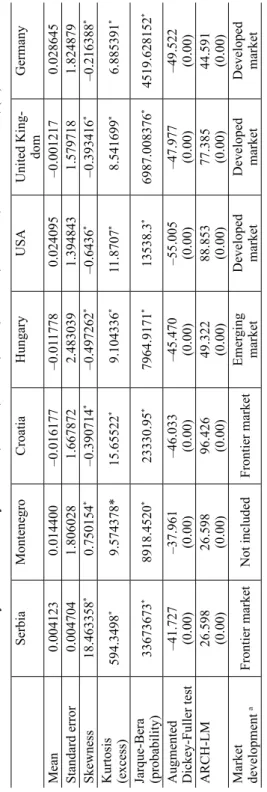
In order to check distribution properties and model volatility – skewness and kurtosis will be checked. Also, we use Jarque-Bera (JB) test for normality.
Table 1 displays summary statistics for return series of stock markets of Serbia, Montenegro, Croatia, Hungary, the USA, the UK, and Germany. Both, skewness and kurtosis have significant values. Skewness is larger than zero for all return series, but values around zero indicate that data are somewhat symmetric. Only Serbian stock market exhibits high asymmetry since its skewness is much larger than zero. Skewness is positive only for Serbia and Montenegro, and negative for all other countries. Positive skewness indicates that distributions of Belexline and Monex have longer right tails. Conversely, distributions of Crobex, BUX, S&P 500, FTSE 100, and DAX have longer left tails. Hence, returns are higher for Croatia and developed countries under this study than for Serbia and Mon- tenegro. Excess kurtosis is positive number for all the countries. Therefore, dis- tributions of all return series are leptokurtic with higher peaks around the mean
a) Belexline b) Monex c) Crobex
d) BUX e) S&P 500 f) FTSE 100
g) DAX
-20-1001020LNBU
1/1/2005 1/1/2010 1/1/2015
Date
-1001020
LNMU
1/1/2005 1/1/2010 1/1/2015
Date
-20-1001020
LNCROBEXU
1/1/2005 1/1/2010 1/1/2015
Date
-20-1001020LNBUXU
1/1/2005 1/1/2010 1/1/2015
Date
-10-50510
LNSP500U
1/1/2005 1/1/2010 1/1/2015
Date
-10-50510LNFTSE100U
1/1/2005 1/1/2010 1/1/2015
Date
-10010
LNDAXU
1/1/2005 1/1/2010 1/1/2015
Date Figure 2. Indices return series a) – g)
Table 1. Summary statistics for daily Belexline, Monex, Crobex, BUX, S&P500, FTSE100, and DAX returns, (%) SerbiaMontenegroCroatiaHungaryUSAUnited King- domGermany Mean0.004123 0.014400 –0.016177 –0.011778 0.024095–0.001217 0.028645 Standard error0.0047041.806028 1.667872 2.483039 1.394843 1.579718 1.824879 Skewness18.463358*0.750154* –0.390714* –0.497262* –0.6436* –0.393416* –0.216388* Kurtosis (excess)594.3498* 9.574378* 15.65522* 9.104336* 11.8707*8.541699* 6.885391* Jarque-Bera (probability)33673673* 8918.4520*23330.95* 7964.9171*13538.3* 6987.008376* 4519.628152* Augmented Dickey-Fuller test–41.727 (0.00)–37.961 (0.00)–46.033 (0.00)–45.470 (0.00)–55.005 (0.00) –47.977 (0.00)–49.522 (0.00) ARCH-LM 26.598 (0.00)26.598 (0.00)96.426 (0.00)49.322 (0.00)88.853 (0.00)77.385 (0.00)44.591 (0.00) Market development aFrontier marketNot includedFrontier marketEmerging marketDeveloped marketDeveloped marketDeveloped market Notes: * Statistically significant at 5% level; a According to the MSCI classification, https://www.msci.com/market-classification.
than it is the case with normal distribution. The JB test is known as one of the tests for determining normality of the data, and this test is only suitable for the large samples of data. Since return sample size is large (2279), it is safe to use the JB statistic. From Table 1 it can be seen that the JB test statistic is significant for all return series, indicating that returns are not normally distributed for any of the indices (Alexander 2008b; Brooks 2009). Therefore, we will not use normal distribution for volatility modelling; rather we shall use Student-t or generalised standard error (GED) distribution in GARCH models.
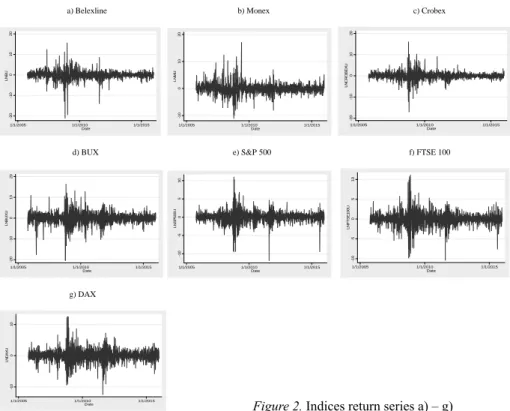
In order to determine properties of volatility, we plot logarithmic returns.
Figure 2 (a-g) represents logarithmic returns of Belexline, Monex, BUX, Crobex, S&P 500, FTSE 100, and DAX. It is evident that there is similar behaviour in Western Balkan’s stock markets. Variability of the developed markets is much greater than the emerging ones and the less developed markets exhibit more se- vere losses than the developed markets. Volatility clustering is observed for all the markets. From Figure 2, it can be seen that high volatility is followed by high volatility, and low volatility is followed by low volatility. Volatility clustering can be analysed using GARCH models. From Table 1, we can see that all series are stationary, which is checked with augmented Dickey-Fuller test. Therefore, we can estimate these series with ARMA models. In Table 1, results for ARCH-LM test are also presented. Test is conducted for 8 lags, since Tsay (2005) suggests that appropriate numbers of lags are approximately equal to the natural logarithm of the sample size. For all series it can be seen that ARCH effects are present, and therefore it is appropriate to use GARCH for modelling volatility. Also, Table 1 presents market classification according to the MSCI.
4.2. GARCH-BEKK spillover
In order to determine what is the nature of the relationships and whether they exist between Western Balkan region and the sample of developed, regional and global stock markets, GARCH–BEKK (m, s) models were employed. We have determined that it is appropriate to use this method for modeling volatility. In order to determine persistence of volatility spillover among different markets, and to determine whether the obtained results and models are under the influ- ence of market crises, in addition to the analysis of the whole sample, volatility spillover is tested in the period before crises (2005–2008) and in the period after the credit crunch (2008–2015). Prior research suggests that the possible reasons for spillover are region specific (Beirne et al. 2010), or they can be connected with the economic development of a country, like the amount of the foreign portfolio investments or with bilateral trade (Balli et al. 2015), or they can be a
result of distances between countries or a result of prior colonial ties (Balli et al.
2015). Volatility spillover can be a result of a market crisis (Diebold – Yilmaz 2009; Allen et al. 2013), or political relations (Abbas et al. 2013), or be guided by the market size and information asymmetry that exists between investors (Kohonen 2013).
To formulate appropriate mean equations, we graphed autocorrelation and par- tial autocorrelation functions, and determined q and p orders of mean equations for the whole sample period, before and after the crisis. Depending on the market index pair and period in question, different AR and ARMA models were imple- mented. Concrete order of mean equations and corresponding multivariate LB tests are displayed but because of space limit, the results can be obtained directly from the authors on request.
Multivariate ARCH test indicates whether ARCH effects were eliminated from the residuals, and suggests in which instances results of multivariate GARCH (m, s)-BEKK are to be taken into account. There are two models that show per- sistence of ARCH effects, although autocorrelation is removed, and whose re- sults cannot be taken into account when considering volatility spillover. Those are after the crisis models between one underdeveloped Western Balkan small market (in terms of the market capitalization) (Belex, Monex) and one developed large market (S&P 500, FTSE 100). Not even higher order GARCH model could eliminate ARCH effects. Perhaps there is too much difference in size and trading activity between these two markets, which makes modelling a difficult task.
Looking at the relationship between Belex and Monex indices, we can see that there are differences between transfer or spillover between Serbia and Montene- gro. For the whole sample period, there is only bidirectional spillover of shocks between these two markets, and this transfer of shocks is visible on the second lag. This means that markets react to the news from the other market, but this reaction is not immediate in the next period, but with a delay of two periods.
Before the crisis there is an evidence of volatility spillover directed from Ser- bia to Montenegro, on the first lag. For the period after the crisis, we can see a combination of previous results. Hence, there is an evidence of shock transfer on the second lag and volatility spillover from Serbia to Montenegro on the first lag. Differences between results of different time periods could be due to the fact that electronic trading in Montenegro started only in 20106. Crisis did not change the nature of that relationship and volatility spillover from a larger to a smaller market, but crises had introduced transfer of shocks between these two markets.
Although not large in size, comparing to the developed world markets we can see that innovations are transferred with a tardiness of one period, and inves-
6 http://mnse.me/code/navigate.asp?Id=944
tors could potentially exploit that. These results are in accordance with Kohonen (2013), who found that the large countries affect all other countries and that the small countries mostly affect each other. Also, these results are in accordance with the findings of Abbas et al. (2013), that regardless of political relations be- tween countries, which can be friendly or unfriendly, if there is an established economic trade between countries, spillover will be present. There are trades of services, tourism, and direct foreign investments established between these two countries and those trades are not insignificant7. Also, these countries are border- ing countries and there is no significant distance between them, and therefore ac- cording to Balli et al. (2015) it is expected to have transfer of shocks and spillover of volatility.
If we look at the relationships that exist between Belex and Crobex, we can observe that there is a difference between market connections depending on the periods of question. When we look at the whole sample, there is evidence of a spillover of shock from Serbia to Croatia, and bidirectional spillover of vola- tilities. Before the crises period, only transfer of market shocks from Serbia to Croatia was present. After the crisis, there is a transfer of both shocks and volatili- ties from Croatia to Serbia on the first and second lags. From Serbia to Croatia, there is also transfer of market innovations but on the second lag, which means that Croatian market is late in their reaction by one time period. Again, investors could use this tardiness. However, these results have to be taken with caution since this GARCH model did not remove ARCH effects for all significance lev- els. Again, results are in accordance with previous studies. Both of these markets are of similar size and character, since they are both frontier markets. However, Croatia is more economically developed and a member of EU. They are both neighbouring countries, in the region of the Western Balkan, with political re- lations and economic trading activities. With these market pairs results are in accordance with previous researches. After the market crisis there is a regional spillover. Also, GARCH models that describe connectivity between markets are of higher order for the period after the crisis and for the whole sample period.
Hungary is an emerging market, and the nature of connection that exists be- tween Belex and BUX are different than relationships with Western Balkan mar- kets. For the whole sample period, there is no evidence of transfer of shocks or volatilities. For the period before the crises, spillover of volatility was present from Hungary to Serbia. After the crisis, there is an evidence of persistence of the spillover of shocks from Hungary to Serbia in three consecutive periods, but not a spillover of volatility. Although there is a geographical proximity, political, and economic relations between these countries, there is no significant spillover
7 https://www.nbs.rs/internet/cirilica/80/platni_bilans.html
of volatility, but just shocks. Here differences in size and development clearly play an important role. Also, we can see that nature of the relationship depends on the periods in question. Hence, here we can conclude that market crises influ- ence the results.
For Belex and S&P 500, the model is valid only for the period before the crisis, for which there was no evidence of spillover. ARCH effects could not be removed for the period after the crisis, and for the whole sample, the model is valid only for 1% significance level. The size and development of these two markets dif- fer considerably, and GARCH could not capture and explain the relationships between them. For the whole sample period, we can see that there is statistically significant spillover of shocks at the first lag from the US to Serbia and on the third lag from Serbia to the US, and spillover of volatility on the second lag again from Serbia to the US. We should keep in mind that these results are not valid for all significance levels. There are also economic activities between these two countries, which are significant for Serbia8.
Serbia has higher level of economic trade with the UK than with the USA.
Also, geographical proximity of this developed market is greater and, therefore, spillover is expected. Again there is a difference in results, depending on the time periods in question. There was no connection before the market crisis. For the whole sample, results are in support of spillover of shock from the UK to Serbia, and that spillover is on the second lag. Again, there is tardiness in the Serbian market which investors could exploit. For the period after the crisis, results are somewhat different. There is a spillover of shocks from the UK to Serbia on the first, second, and third lag. There is a spillover of volatility from Serbia to the UK on the first lag, meaning that investors in the UK react to the movement of the Serbian stock market. However, the Serbian market is late in their reaction since there is spillover of volatility from the UK to Serbia on the third lag. Again the model that introduces these results is not significant for all cut-off levels.
Serbia has the highest economic activity with Germany. Once more, spillover is dependent on the period in question. When looking at the whole sample, there is a volatility spillover directed from Germany to Serbia. Before the crisis, there was no evidence of spillover and after the crisis there is a spillover of shocks from DAX to Belex and of volatility on the first and third lags, and not on the second. From Serbia to Germany, there is a spillover of shocks on the second lag, and volatility spillover on the first lag. Differences in the lags suggest that inves- tors could time the moment of their reaction, and to include it in their investment strategy.
8 https://www.nbs.rs/internet/cirilica/80/platni_bilans.html
When looking at the relationship between Monex and Crobex, the crisis intro- duced spillover of shocks and volatilities. Direction of a spillover is from Croatia to Montenegro. Thus, there is evidence of a regional spillover directed from larger to a smaller market. Results are similar when looking at the relationship between Monex and BUX. Before the crisis, there was only almost insignificant volatil- ity spillover from Monex to BUX. The crisis introduced spillover of shocks and volatilities. For the whole sample, there is a spillover of shocks and volatilities from Hungary to Montenegro. For the period after the crisis, there is a spillover of shocks from Hungary to Montenegro on the first and second lags, and of volatili- ties on the second lag. There is a presence of shock spillover from Montenegro to Hungary, on the third lag. More connection between Montenegro and the USA is observed after the crisis. After the crisis, there is a spillover of market inno- vations from the USA to Montenegro. From Montenegro to the USA9, shocks are transferred with the lag, and volatility spillover is present in a very small extent. There is a modest amount of economic activities between Montenegro and Croatia, Hungary, Germany and the USA. The largest amount of economic activities Montenegro has with Serbia and the UK (Pink book 2015). However, in the period after the crisis, the relationship between Monex and FTSE 100 could not be explored since GARCH model could not eliminate ARCH effects. Before the crisis, there was no relationship between these two markets. When looking at the whole period, there is a significant spillover of shocks and volatilities from the UK to Montenegro. Volatility spillover from Montenegro to the UK is almost insignificant. Monex and DAX present somewhat different dynamics. There was volatility spillover from Germany to Montenegro before the crisis and after the crisis spillover of shocks from Germany is directed to Montenegro. Risk is trans- ferred from Montenegro to Germany on the second lag. However, volatility spills from Germany to Montenegro on the third lag. Again, there is a late response in the Western Balkan market. Regardless of the level of economics activities, spillover changes between Western Balkan country and other frontier, emerging, and developed markets in different time periods. Again, there is an evidence of regional spillover and an evidence that direction of spillover is guided by the market size.
Croatia is a EU frontier country. When looking at its relationship with the emerging market of Hungary, surprisingly regardless of the time period there is no evidence of spillover between these two markets and that presents possibility for a diversification. They are bordering countries and there is some level of eco-
9 http://www.cb-cg.org/index.php?mn1=statistika&mn2=ekonomski_odnosi_sa_inostran- stvom &mn3=platni_bilans
nomic activities established between them10. When looking at the relationship of Croatia with the developed markets, it can be seen that autocorrelation could not be eliminated from the whole sample. For the period before the crisis, there was a spillover of shocks and volatilities, and in the period after the crisis there are no more connections between these markets. Germany and Croatia exhibit spillover of shocks and volatilities before and after the crisis. Croatia reacts differently to a period of market crisis compared to other Western Balkan countries, no matter that distances, size, and economic activities are similar. There is a rise in absolute economic activities between Croatia and the USA, the UK, and Germany in the period of 2010–2011. Here we cannot make any general conclusion, but further research should test the relationship between macroeconomic fundamentals and stock market movements. Even though economic activities could serve as an ex- planation for the spillover between markets, level and direction of trade activities should be tested for significance in explaining these relationships.
Hungary had a spillover of shocks with the USA and the UK in both sub-sam- ple periods, before and after the crisis. Volatility spillover is present only after the crisis between Hungary and the USA, and is directed from emerging to developed market. For the whole sample period, there is no evidence of shock or volatility spillover. If we look at the connection with the UK, we can observe that after the crisis there is no more volatility spillover. However, for the whole sample volatil- ity spillover is present from a developed market to an emerging market. But with Germany, there was only spillover of volatility before the crisis from a developed to an emerging market and not in the period following the crisis, or on the whole sample. Hungarian stock market is behaving somewhat similar to Croatian stock market; because volatility spillovers with developed markets in most cases are non-existing.
If we look at the developed stock markets, we can see that in most cases mod- els could not be defined. For the S&P 500 and DAX, there is only a model for the second sub-sample after the crisis. There is only evidence of a shock spillover from Germany to the USA, and on the second lag a spillover from the USA to Germany. Such results may be due to the fact that these markets operate in dif- ferent hours. There is no evidence of a volatility spillover. The German and the UK’s stock market had a spillover of volatility and shocks before the crisis and not after. For the whole sample period there is a spillover of both shocks and vola- tilities from Germany to the UK. Again, it is like the market crisis had eliminated the connection that existed between these markets. These findings are partially in accordance with the results provided by Diebold – Yilmaz (2009), that there is no
10 https://www.hnb.hr/statistika/statisticki-podaci/sektor-inozemstva/inozemna-izravna- ulaganja
trend in spillover between developed markets. But our results do not support their finding that volatility spillover bursts in an event of market crisis. Unlike the case of Western Balkan countries, developed markets and their relations either could not be captured or did not require higher order GARCH model.
5. SUMMARY AND CONCLUSIONS
European emerging markets that have been the subject of previous studies are stock markets of countries that are fully integrated to the EU for many years.
However, the remainders of European markets that have not been integrated to EU have not been studied yet, and possible benefits of diversification in those markets are not explored to the full extent. Most Balkan countries are harmonis- ing their laws and market environment to the EU. Croatia is a new European member; Montenegro and Serbia are not part of the EU yet. Since they are not fully integrated in EU, there could be a potential benefit for international inves- tors.
Looking at Belex, Monex, and Crobex we can see that there is an evidence of regional spillover, and that there is a transfer of volatility between these markets and developed markets. Hence, there is also an evidence of global spillover. We can see that results are dependent on the time period, and that there are differ- ences before and after the crisis. If markets were not related, after the crisis they become connected in terms of shocks and volatility spillover. Also, it is observed that in some cases there is a late response of Western Balkan stock markets, which could potentially be exploited by investors.
When looking at the Western Balkan region, we can see that there is an evi- dence of regional and global spillover. Direction of spillover is under the influ- ence of the market size and development. No matter how small the market is, it is not excluded from the global financial flows. Although there is an evidence of spillover, it can be seen that the response for large market events is not observed in the next period, but there is a delayed response. Such findings could be of interest to global investors, since they could adapt their investment strategies accordingly. After the crisis, more complex GARCH models were needed to cap- ture the relationship between smaller and larger stock markets. When looking at the developed markets there is no evidence that spillover bursts in the case of a market crisis. There is evidence in the support that developed markets in the case of a market crisis eliminate spillover that existed prior an event. Relationship between stock market spillover and level of economic activities should be further explored, since it can be used as an explanation for frontier, emerging and devel- oped market behaviour before and after the crisis.
We can conclude that spillover is dependent on the time period in question.
There is a difference in behaviour of smaller and larger markets, before and after the market crisis. This can be due to the fact that smaller markets still did not recover from those negative market events and larger markets have recovered.
We also need to keep in mind that the results presented in this study are calcu- lated taking the US dollar as a base currency. Therefore, our results include joint effects of the stock market movement and the exchange rate movement. Further research could use some other currency as a base one, and check if there is any symmetry in the relationships between different stock markets.
REFERENCES
Abbas, Q. – Khan, S. – Ali Shah, S. Z. (2013): Volatility Transmission in Regional Asian Stock Markets. Emerging Markets Review, 16: 66–77.
Alexander, C. (2008a): Market Risk Analysis. Practical Financial Econometrics. Chichester: John Wiley & Sons.
Alexander, C. (2008b): Market Risk Analysis. Quantitative Methods in Finance. Chichester: John Wiley & Sons.
Allen, D. E. – Amram, R. – McAleer, M. (2013): Volatility Spillovers from the Chinese Stock Mar- ket to Economic Neighbours. Mathematics and Computers in Simulation, 94: 238–257.
Balli, F. – Hajhoj, H. R. – Basher, S. A. – Ghassan, H. B. (2015): An Analysis of Returns and Volatility Spillovers and their Determinants in Emerging Asian and Middle Eastern Countries.
International Review of Economics and Finance, 39: 311–325.
Beirne, J. – Caporale, G. M. – Shulze-Ghattas, M. – Spagnolo, N. (2010): Global and Regional Spillovers in Emerging Stock Markets: A Multivariate GARCH-in-Mean Analysis. Emerging Markets Review, 11(3): 250–260.
Brooks, C. (2008): Introductory Econometric for Finance. 2nd ed., New York: Cambridge Univer- sity Press.
Brooks, C. (2009): RATS Handbook to Accompany Introductory Econometrics for Finance. New York: Cambridge University Press.
Diebold, F. X. –Yilmaz, K. (2009): Measuring Financial Asset Return and Volatility Spillovers, with Application to Global Equity Markets. The Economic Journal, 119(534): 158–171.
Engle, R. F. – Kroner, K. F. (1995): Multivariate Simultaneous Generalized GARCH. Econometric Theory, 11(1): 122—150.
Engle, R. F. – Susmel, R. (1993): Common Volatility in International Equity Markets. Journal of Business and Economic Statistics, 11(2): 167–176.
Engle, R. F. – Ito, T. – Lin, W-L. (1990): Meteor Showers or Heat Waves? Heteroskedastic Intra- Daily Volatility in the Foreign Exchange Market. Econometrica, 58(3): 525–542.
Hull, J. C. (2005): Fundamental of Futures and Options Markets. 5th edition., New Jersey: Pearson Education Inc.
Hassan, S. A. – Malik, F. (2007): Multivariate GARCH Modelling of Sector Volatility Transmis- sion. The Quarterly Review of Economics and Finance, 47(3): 470–480.
Khalfaoui, R. – Boutahar, M. – Boubaker, H. (2015): Analysing Volatility Spillovers and Hedging between Oil and Stock Markets: Evidence from Wavelet Analysis. Energy Economics, 49(C):
540–549.
Kohonen, A. (2013): On Detection of Volatility Spillovers in Overlapping Stock Markets. Journal of Empirical Finance, 22(C): 140–158.
Korkmaz, T. – Cevik, E. I. – Atukeren, E. (2012): Return and Volatility Spillovers among CIVETS Stock Markets. Emerging Markets Review, 13(2): 230–252.
Lee, S. J. (2009): Volatility Spillover Effects among Six Asian Countries. Applied Economics Let- ters, 16(5): 501–508.
Lee, Y-H. (2013): Global and Regional Range-Based Volatility Spillover Effects. Emerging Mar- kets Review, 14: 1–10.
Li, H. – Majerowska, E. (2008): Testing Stock Market Linkages for Poland and Hungary: A Multi- variate GARCH Approach. Research in International Business and Finance, 22(3): 247–266.
Mladenovic, Z. – Nojkovic, A. (2012): Primenjena analiza vremenskih serija (Applied Time Series Analysis). Belgrade: University of Belgrade, Economic Faculty.
Pati, P. C. – Rajib, P. (2011): Intraday Return Dynamics and Volatility Spillovers between NSE S&P CNX Nifty Stock Index and Stock Index Futures. Applied Economics Letters, 18(6): 567–574.
Pink Book (2015): UK Balance of Payments – Chapter 09: Geographical Breakdown of the Current Account. http://www.ons.gov.uk/economy/nationalaccounts/balanceofpayments/compendium/
unitedkingdombalanceofpaymentsthepinkbook/2015-10-30/unitedkingdombalanceofpayments thepinkbook .
Ross, S. A. (1989): Information and Volatility: The No-Arbitrage Martingale Approach to Timing and Resolution Irrelevancy. The Journal of Finance, 44(1): 1–17.
Saleem, K. (2009): International Linkage of the Russian Market and the Russian Financial Cri- sis: A Multivariate GARCH Analysis. Research in International Business and Finance, 23(3):
243–256.
Sola, M. – Spagnolo, F. – Spagnolo, N. (2002): A Test for Volatility Spillovers. Economics Letters, 76(1): 77–84.
Tsay, R.S. (2005): Analysis of Financial Time Series. 2nd ed., Hoboken: John Wiley & Sons.
Tsay, R. S. (2006): Multivariate Volatility Models. IMS Lecture Notes – Monograph Series, Time Series and Related Topics, No. 52: 210–222.
Turner, A. L. – Weigel, E. J. (1992): Daily Stock Market Volatility: 1928–1989. Management Sci- ence, 38(11): 1586–1609.
Zivot, E. (2008): Practical Issues in the Analysis of Univariate GARCH Models. http://faculty.
washington.edu/ezivot/research/practicalgarchfi nal.pdf http://mnse.me/code/navigate.asp?Id=944
https://www.msci.com/market-classifi cation
https://www.nbs.rs/internet/cirilica/80/platni_bilans.html