CHEMICAL ENGINEERING TRANSACTIONS VOL. 84, 2021
A publication of
The Italian Association of Chemical Engineering Online at www.cetjournal.it Guest Editors: Jeng Shiun Lim, Nor Alafiza Yunus, Jiří Jaromír Klemeš
Copyright © 2021, AIDIC Servizi S.r.l.
ISBN 978-88-95608-82-2; ISSN 2283-9216
Mixture Temperature-Controlled Combustion of Various Conventional and Renewable Fuels
Gyöngyvér Hidegh
a,*, Dávid Csemány
a, János Vámos
a, József Tóth
b, Viktor Józsa
aaBudapest University of Technology and Economics, Faculty of Mechanical Engineering, Department of Energy Engineering, H-1111 Budapest Műegyetem rkp. 3., Hungary
bNational University of Public Service, Faculty of Military Sciences and Officer Training, Department of Aircraft and Engines, H-5008 Szolnok PO Box 1., Hungary
hidegh@energia.bme.hu
Mixture Temperature-Controlled (MTC) combustion is a novel combustion concept for steady-operating applications, such as gas turbines, boilers, and furnaces. Compared to lean premixed burners, it offers significantly lower NOX emission. For reference, standard jet fuel (JP-8) and diesel fuel (EN590:2017) were used. In order to reduce fossil fuel consumption, alternative fuels can be used as a substitute. Currently, coconut and palm biodiesels were evaluated. Besides the NO and CO emissions, the chemiluminescent signal was also evaluated. Through the MTC combustion mode, the NOX emission was found to be below 20 ppm, while the CO emission was not affected. It was concluded that this favorable operation mode is easier to achieve with fuels having higher volatility. The combustion power and the air-to-fuel equivalence ratio were 13.3 kW and 1.25. The atomizing air gauge pressure and the combustion air preheating temperature were varied in the range of 0.3- 0.9 bar and 100-350 °C. Finally, the effect of fuel properties on the combustion mode, pollutant emissions, and flame shapes are discussed.
1. Introduction
Biofuel production is on a stable incline, according to IEA (IEA, 2020). However, the dramatic suppression in the transportation sector due to the pandemic also affected this industry. The role of biofuels in the energy mix in the future is assured since electric vehicles offer notably reduced mileage (Hänggi et al., 2019) since batteries cannot match liquid fuels due to the physical-chemical limitations in storing energy. Renewable fuels are gaining increased attention in aviation (Gutiérrez-Antonio et al., 2017) to mitigate CO2 emission from fossil fuels. The practical feasibility of biojet fuel was demonstrated by KLM (KLM, 2019) through operating a daily intercontinental flight from Los Angeles to Amsterdam.
The popularity of hydrocarbon fuels is on a decline in the public media. Regardless of this fact, active research is going on with spectacular advancements to make biofuels more competitive to reach a sustainable economy ultimately. The export portfolio of Malaysia is heavy on palm oil, which is also investigated in the present study.
Sustainable palm oil production received outstanding focus in the past decade (Abdul Murad et al., 2019).
Besides the direct oil extraction, waste recovery receives increasing attention (Simasatitkul and Arpornwichanop, 2019) to reduce the demand for fuel crops. Nevertheless, the edible oil sources seriously endanger food safety (Chen and Zhang, 2015). To critically evaluate various fuels, comparative measurements were performed, utilizing conventional fuels. To date, turbulent swirl burners are the most popular solutions, offering low pollutant emissions (Lefebvre and Ballal, 2010). By introducing the Mixture Temperature-Controlled (MTC) combustion concept, a significant reduction in pollutant emissions of coconut methyl ester and diesel fuel blends was recently achieved (Józsa et al., 2020).
The novelty of this paper is the following. MTC combustion is a recently developed concept, offering a few factors lower NOX emission than the state-of-the-art lean premixed swirl burners. To design guidelines for upscaling, various well-known conventional and renewable fuels were tested and their operating conditions were compared.
2. Materials and methods
This section is divided into two subsections. The first one presents the test rig used for the combustion tests, while the second one details the measurement methods for determining the relevant material properties of the investigated fuels.
2.1 Experimental setup for combustion diagnostics
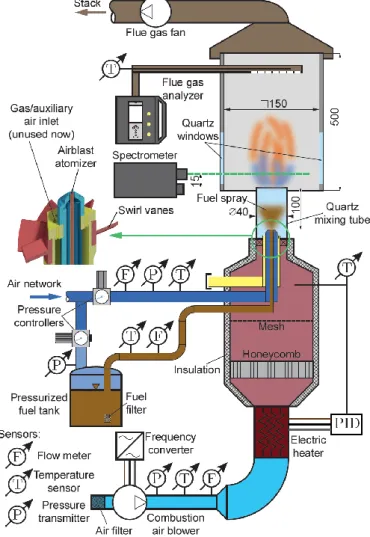
A schematic drawing of the combustion test rig is shown in Figure 1. The investigated fuels were standard diesel fuel (D, EN590:2017, sulfur free in Europe), jet fuel (JP-8), coconut methyl ester (CME), and palm methyl ester (PME). The investigated fuel was delivered from a pressurized tank into a plain-jet airblast atomizer. The fuel mass flow rate was adjusted to maintain the 13.3 kW combustion power in each case.
Figure 1: The combustion test rig. All the dimensions are in mm
The fuel flow rate was measured by an Omega FPD3202 positive displacement flow meter, with < 2.7 % uncertainty at a 95 % significance level. The atomizing air was supplied from the laboratory air network and regulated in the range of 0.3 and 0.9 bar gauge pressure, pg, in 0.15 bar steps. pg = 0.3 bar was required to have a stable flame, while increasing pg over 0.9 bar did not provide a significant improvement on the combustion parameters. The volume flow rate of atomizing air was measured by an Omega FMA1842A flow meter with 1 L/min uncertainty. The combustion air was delivered by a frequency-controlled side channel blower, and the flow rate was measured by a pre-calibrated Fuji Electric FWD050D2-A52 ultrasonic flow meter with 5 % uncertainty of the reading. The preliminary measurements revealed the MTC combustion mode starting from 1.25 air-to-fuel equivalence ratio, λ, while the emissions were spectacularly dropped. The primary goal of the control was to keep a uniform λ at 1.25, which corresponds to 4.2 % O2 in the flue gas. Combustion air preheating was required to be able to combust the diesel fuel and the methyl esters. K-type thermocouples of an accuracy of max(2.2, t [°C] × 0.0075) were installed to measure the preheated combustion air temperature, tca, which was varied between 100 and 350 °C in 50 °C steps. tca = 350 °C was a rational upper limit, since elevated
temperatures resulted in straight flames and increased NO emission. The fixed swirl vanes provide a geometric swirl number of 0.787, which is lowered by the atomizing air jet due to the extra axial thrust. See (Józsa et al., 2020) for details.
Air-cooled quartz windows were mounted in two opposite sides of the combustion chamber, allowing optical access to the flame. The spectrometer was manufactured by OpLab Kft. and featured a Hamamatsu S3904- 1024Q nMOS 1024 pixel photosensor. It has a fixed focal length of 0.5 m and allows light detection in the 260–
580 nm range with 0.3125 nm resolution. A Fujifilm HS10 camera was used to record flame images at each operating point. A Testo 350 type flue gas analyzer was used to measure O2, CO, and NO emissions. The uncertainty of these sensors was 0.2 V/V%, three ppm, and two ppm. For more details on the measurement setup, see ref. (Józsa et al., 2020).
2.2 Measurement of fuel properties
Liquid density was measured with 10 cm3 Gay-Lussac pycnometers from Lenz Laborglasinstrumente.
Calibration and measurements were performed in accordance with ISO 3507:1999 and ISO 4787:2010 standards resulting in 0.01 cm3 uncertainty in the measured volume. The mass of the samples was measured with a Sartorius precision laboratory balance with 0.001 g uncertainty. For stabilizing the temperature of the samples, a Viscometer Thermostat-D674 constant temperature bath with Digitherm temperature control unit provided a homogeneous temperature distribution with an uncertainty of 1 °C. The same bath was used for measuring the kinematic viscosity with a Cannon-Fenske routine viscometer, following the ASTM D445-06 and ASTM D446-07 standards. The distillation curve of the samples was measured according to the ASTM D86 standard. However, the setup was modified in order the approximate the true vapor-liquid equilibrium (Ferris and Rothamer, 2016). Heat rate was adjusted with PCE-HM 500 heating mantle. The temperature was measured with a calibrated K-type thermocouple. Calibration was performed with Scan-Sense AS TC125 and TC650 temperature calibrators with an accuracy of 0.3 and 0.5 °C. The fuel properties and their effects on combustion characteristics are discussed in Section 3.3.
3. Results and discussion
The present section is divided into three subsections. The first one shows the flame shapes and pollutant emission data. The second one focuses on the evaluation of the chemiluminescent signal, while the third one discusses fuel evaporation, which greatly affected the flame shape.
3.1 Flame shapes and pollutant emission
During the combustion tests, two different flame shapes were observed. Straight flames attached to the lip of the mixing tube, and distributed flames, which is specific to the MTC combustion mode, were lifted from the burner. In this case, the reactions take place in the whole cross-section of the combustion chamber, showing low luminosity. As a consequence of turbulent combustion, at some measurement setups, both shapes were observed with a sudden transition between them at about 1 Hz. Figure 2a shows the observed flame shapes at all measurement setups.
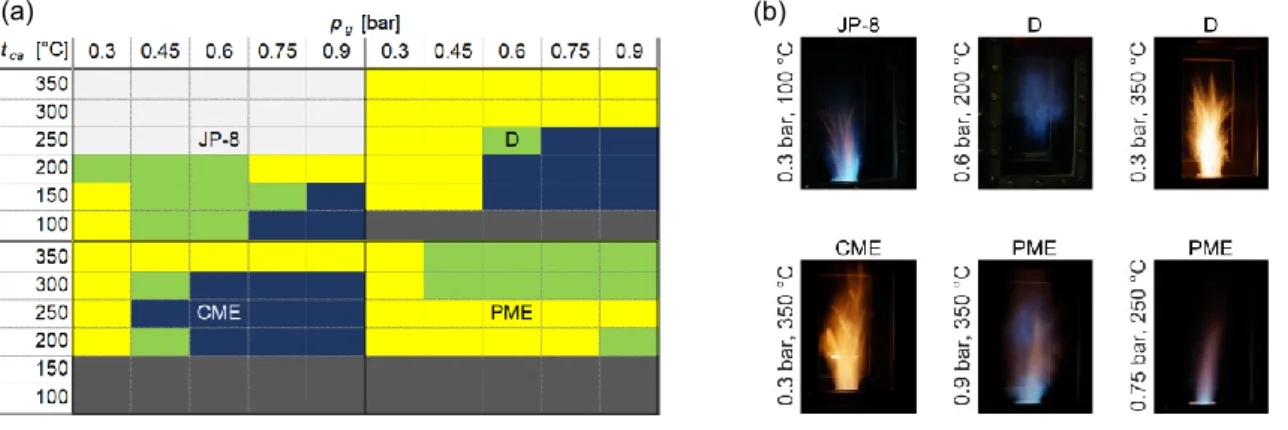
Figure 2: (a) Observed flame shapes at each investigated condition. Yellow: straight, dark blue: distributed, light green: transitory flames. Dark grey: no combustion due to insufficient droplet evaporation, light grey: not investigated. (b) Flame images at different conditions.
(a) (b)
In the case of the aviation fuel, JP-8, tca = 100 °C was enough to achieve stable operation due to its higher volatility than that of the other fuels. Depending on pg, both straight and distributed flames were observed. If tca
was excessive, only straight and a shortened flame was present, which results in high NO emission. For this reason, the maximum of tca for JP-8 was only 200 °C. A similar pattern was observed for diesel combustion above tca = 250 °C. The low volatility of biodiesels, i.e., PME and CME, hindered stable combustion until tca = 200 °C. Interestingly, PME combustion featured no MTC mode at all.
For the visual interpretation of the flame shapes, six selected images were shown in Figure 2b. In the case of the JP-8 flame (top left), a straight flame can be seen, however, straight flames were mostly luminous yellowish flames for D and CME. The top middle D flame demonstrates the MTC combustion mode. The shown PME flame at 0.9 bar and 350 °C is at a transitory state. The flame is still attached to the lip of the burner while it is fluttering between two states in the combustion chamber. At higher pg, the decreased swirl and the increased shear forces enhance the mixing process, which results in smaller and thicker, blue and purple flames, as it can be seen on the bottom right PME image.
A significant difference between straight and distributed flames was the NO emission, shown in Figure 3a. The pattern of Figures 3a and 2a are identical, highlighting that the NO emission of the MTC combustion is extremely low, mostly below 20 ppm, while straight flames emit closely 130 ppm NO. Comparing the overall NO emission of the investigated fuels, CME and PME combustion resulted in lower NO emission than D. At the same time, the NO emission of JP-8 is lower than that of other straight flames at identical tca, according to the higher fuel volatility, which is detailed in Subsection 3.3. In Figure 2b, the yellowish D flame is characterized by the highest NO emission, while the other D flame, under MTC combustion mode, features low NO emission. In Figure 3b, the CO emission is shown. At each investigated conditions, it was generally low, mostly staying below 10 ppm, while the occurring flame shapes did not affect CO emission. Note that all these values are measured at 4.2 % flue gas oxygen content.
Figure 3: (a) NO and (b) CO emission of the fuels in the investigated pg – tca range
3.2 Chemiluminescent emission
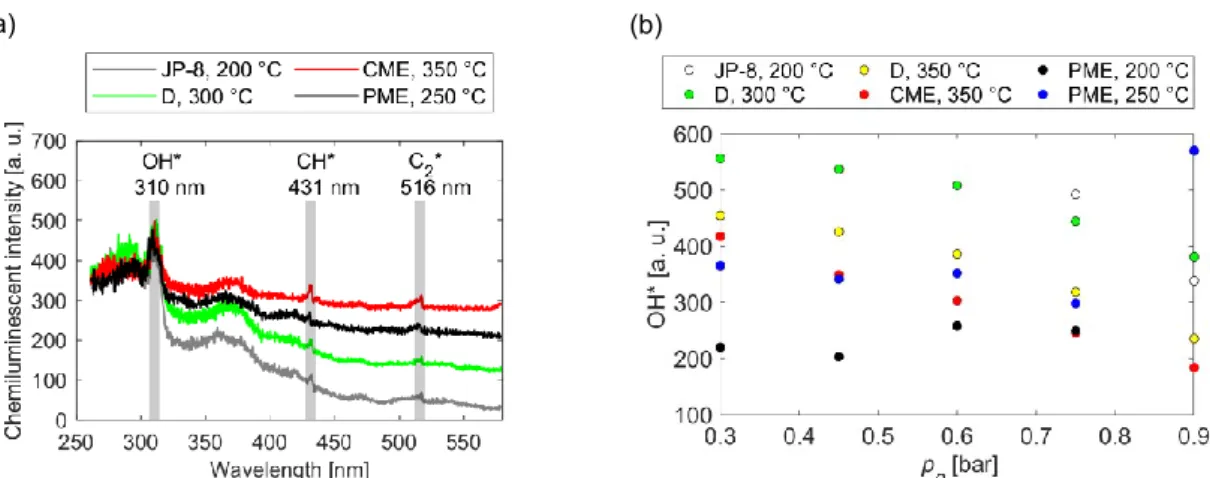
Since the spectrometer was in a fixed position focusing right above the burner lip, only the straight flames were investigated. Previously, D and CME blends were evaluated (Józsa et al., 2020), concluding that among OH* at 310 nm, CH* at 431 nm and C2* at 516 nm, solely the OH* peak was dominant in the chemiluminescent (CL) spectra. Figure 4a shows the spectra of all fuels at various tca, while pg = 0.75 bar was fixed. It was shown by Panoutsos et al. (Panoutsos et al., 2009) that both OH* and CH* correlate well with the heat release rate.
Compared to the clearly visible OH* peaks, the identification of the CH* and C2* peaks is not obvious. In Figure 4b, the CL intensity of OH* peaks is shown. For each fuel, except PME, the OH* intensity is a linear function of pg at a fixed tca value. As pg increases, the OH* intensity decreases. The OH* intensity of fossil fuels was higher than that of the methyl esters. pg has no significant influence on the OH* emission of PME. Note that in the case of JP-8, at tca = 200 °C, the straight flame shape was achieved at only two pg values. The influence of tca on OH*
was either analyzed, however, no considerable relation was found.
(a) (b)
Figure 4: (a) Chemiluminescent spectra at pg = 0.75 bar (b) The chemiluminescent intensity of the OH* peaks
3.3 Effects of fuel properties on combustion characteristics
Table 2 shows the liquid density, kinematic viscosity, and lower heating value of the investigated fuels. The latter for CME and PME was calculated according to the method suggested by Channiwala and Parikh (2002).
The LHV of JP-8 was estimated in line with the findings of Lee et al. (Lee et al., 2012), while the LHV of D is in accordance with the practical limitations set by the EN590:2017 standard. PME and CME both have a higher density than D and JP-8; the kinematic viscosity of PME is more than twice as high as that of D, resulting in larger average droplet sizes during the atomization process, which leads to longer evaporation time of the spray (Lefebvre and McDonell, 2017).
Table 2: Properties of the evaluated fuels
Property JP-8 D CME PME
Density at 25 °C [kg/m3] 785.8±0.8 816.8±0.8 866.5±0.8 867.8±0.8 Kinematic viscosity at 25 °C [mm2/s] 1.428±0.005 2.839±0.007 3.763±0.007 6.006±0.011
Lower heating value [MJ/kg] 43.3 43 35.15 36.89
Fuel volatility and vaporization properties are characterized by the distillation curves of the investigated fuels, shown in Figure 5. JP-8 is the most volatile and has the lowest boiling temperatures among them, making a lower tca sufficient for complete spray evaporation.
Figure 5: Distillation curves of the investigated fuels
(a) (b)
D and CME show similar volatility characteristics, however, CME has slightly higher boiling temperatures, which leads to insufficient evaporation at lower tca values. The boiling temperatures of PME are higher than that of CME. Due to the lower volatility and larger average droplet sizes, proper evaporation only occurs at high air preheating temperatures. Originating from this behavior, no distributed flame shape was observed as only straight and transitory flame shapes were stable under the investigated conditions. Note that flame blowout was not observed at all.
4. Conclusions
In this paper, pollutant and chemiluminescent emissions, and fuel properties, including volatility characteristics of coconut and palm biodiesels, were analyzed and compared to standard JP-8 and diesel fuels for reference in a steady-operating Mixture Temperature-Controlled combustion chamber. Based on the results, the following conclusions were derived. The NO emission of the Mixture Temperature-Controlled combustion state was below 20 ppm, which is significantly lower compared to the emission of straight flames. Combustion of coconut and palm biodiesels produced lower NO emission than that of the diesel fuel. However, NO emission of the jet fuel was the lowest for straight flames among all of the fuels. CO emission was practically marginal at each investigated conditions and had no relation with the flame shapes. OH* intensity decreased linearly with the increasing atomizing air gauge pressure at a fixed combustion air temperature, except for palm biodiesel, where the effect of the pressure was not significant. Large kinematic viscosity and low volatility of palm biodiesel resulted in larger average droplet sizes and longer evaporation time. Consequently, the sufficient vaporization required high air preheating temperature, and no distributed flame could be observed.
Acknowledgments
This work was supported by the European Regional Development Fund (GINOP 2.3.2-15-2016-00007,
“Increasing and integrating the interdisciplinary scientific potential relating to aviation safety into the international research network at the National University of Public Service - VOLARE”). The project was realized through the assistance of the European Union and co-financed by the European Regional Development Fund.
References
Abdul Murad S.M., Hashim H., Jusoh M., Zakaria Z.Y., 2019, Enhancement of roundtable on sustainable palm oil (RSPO): Quantitative assessment tool, Chemical Engineering Transactions, 72, 67–72.
Channiwala S.A., Parikh P.P., 2002, A unified correlation for estimating HHV of solid, liquid and gaseous fuels, Fuel, 81(8), 1051–1063.
Chen H.G., Zhang Y.H.P., 2015, New biorefineries and sustainable agriculture: Increased food, biofuels, and ecosystem security, Renewable and Sustainable Energy Reviews, 47, 117–132.
Ferris A.M., Rothamer D.A., 2016, Methodology for the experimental measurement of vapor–liquid equilibrium distillation curves using a modified ASTM D86 setup, Fuel, 182, 467–479.
Gutiérrez-Antonio C., Gómez-Castro F.I., de Lira-Flores J.A., Hernández S., 2017, A review on the production processes of renewable jet fuel, Renewable and Sustainable Energy Reviews, 79(October 2016), 709–729.
Hänggi S., Elbert P., Bütler T., Cabalzar U., Teske S., Bach C., Onder C., 2019, A review of synthetic fuels for passenger vehicles, Energy Reports, 5, 555–569.
IEA, 2020, Renewables, International Energy Agency <https://www.iea.org/reports/global-energy-review- 2020/renewables> accessed 01.07.2020.
Józsa V., Hidegh Gy., Kun-Balog A., Ng J.-H., Chong C.T., 2020, Ultra-low emission combustion of diesel- coconut biodiesel fuels by a mixture temperature-controlled combustion mode, Energy Conversion and Management, 214(February), 112908.
KLM, 2019, Corporate Biofuel Programme, KLM Royal Dutch Airlines
<https://www.klm.com/travel/nl_en/prepare_for_travel/fly_co2_neutral/all_about_sustainable_travel/biofuel.
htm> accessed 01.07.2020.
Lee J., Oh H., Bae, C., 2012, Combustion process of JP-8 and fossil diesel fuel in a heavy duty diesel engine using two-color thermometry, Fuel, 102, 264–273.
Lefebvre A.H., Ballal D.R., 2010, Gas turbine combustion (3rd edition), CRC Press, Boca Raton, FL, US.
Lefebvre A.H., McDonell V.G., 2017, Atomization and Sprays (2nd edition), CRC Press, Boca Raton, FL, US.
Panoutsos C.S., Hardalupas Y., Taylor A.M.K.P, 2009, Numerical evaluation of equivalence ratio measurement using OH* and CH* chemiluminescence in premixed and non-premixed methane–air flames, Combustion and Flame, 156, 273-291.
Simasatitkul L., Arpornwichanop A., 2019, Feasibility study of using waste cooking oil and byproduct from palm oil refinery for green diesel production, Chemical Engineering Transactions, 74, 1–6.