Ultra-low emission combustion of diesel-coconut biodiesel fuels by a Mixture Temperature-Controlled Combustion mode
Viktor Józsaa,*, Gyöngyvér Hidegha, Attila Kun-Baloga, Jo-Han Ngb, Cheng Tung Chongc
a Budapest University of Technology and Economics, Faculty of Mechanical Engineering, Department of Energy Engineering, 1111 Budapest, Műegyetem rkp. 3., Hungary
b Faculty of Engineering and Physical Sciences, University of Southampton Malaysia (UoSM), 79200 Iskandar Puteri, Johor, Malaysia
c China-UK Low Carbon College, Shanghai Jiao Tong University, Lingang, Shanghai 201306, China
Abstract
Liquid fuels are likely to remain the main energy source in long-range transportation and aviation for several decades. To reduce our dependence on fossil fuels, liquid biofuels can be blended to fossil fuels – or used purely. In this paper, coconut methyl ester, standard diesel fuel (EN590:2017), and their blends were investigated in 25 V/V% steps. A novel turbulent combustion chamber was developed to facilitate combustion in a large volume that leads to ultra-low emissions. The combustion power of the swirl burner was 13.3 kW, and the air-to- fuel equivalence ratio was 1.25. Two parameters, combustion air preheating temperature and atomizing air pressure were adjusted in the range of 150–350 °C and 0.3–0.9 bar, respectively.
Both straight and lifted flames were observed. The closed, atmospheric combustion chamber resulted in CO emission below 10 ppm in the majority of the cases. NO emission varied between 60 and 183 ppm at straight flame cases and decreased below 20 ppm when the flame was lifted since the combustion occurred in a large volume. This operation mode fulfills the 2015/2193/EU directive for gas combustion by 25%, which is twice as strict as liquid fuel combustion regulations. The 90% NO emission reduction was also concluded when compared to a lean premixed prevaporized burner under similar conditions. This favorable operation mode was named as Mixture Temperature-Controlled (MTC) Combustion. The
chemiluminescent emission of lifted flames was also low, however, the OH* emission of straight flames was clearly observable and followed the trends of NO emission. The MTC mode may lead to significantly decreased pollutant emission of steady-operating devices like boilers, furnaces, and both aviation and industrial gas turbines, meaning an outstanding contribution to more environmentally friendly technologies.
Keywords: biodiesel; emission; spectroscopy; swirl combustion; coconut; liquid fuel
* Corresponding author. Email: jozsa@energia.bme.hu
1. Introduction 1
The challenge of our decade is reaching sustainability. A dramatic change is required 2
for land-based energy generation for the transition of fossil fuel heavy primary energy carriers 3
to renewable energy sources [1]. Regardless that batteries went through rapid and spectacular 4
development in the past decade, the state-of-the-art Li-ion cells offer gravimetric energy 5
density only in the range of 1 kJ/kg [2] and other, high energy density batteries under research 6
perform below 5 kJ/kg [3,4]. In comparison, the presently investigated standard diesel fuel (D, 7
EN590:2017) offers 43 MJ/kg lower heating value while that of the coconut methyl ester 8
(CME) is 35.15 MJ/kg. As a consequence, all the long-range passenger aircraft on the horizon 9
will feature highly efficient gas turbines [5,6]. The interest in advanced technologies is pushed 10
by the rapid growth of the aviation industry, which is a few percents each year [7,8].
11
Among the potential alternative fuels for power and transportation sector, biodiesel 12
stands out [9,10]. The transesterified fatty acids can be either saturated or unsaturated [11].
13
Alongside with the feedstock, the physical properties are significantly affected, from which the 14
pour point is a severe limitation in many applications and in cold climate [9]. Although 15
biodiesel is inherently oxygenated, the overall quality is still resembling those of diesel, making 16
it a compatible blending fuel for existing combustion systems.
17
At present, the primary interest for biofuel applications is in the transportation sector.
18
Biodiesel is blended to commercial diesel fuel, according to regulations in many countries, 19
such as those in, e.g., Malaysia and Hungary (B7), Indonesia (B20), and Brazil (B8). This 20
explains the growing trend of biodiesel production globally [12], driven by renewable energy 21
policies to reduce the dependency on fossil fuel. Most of the biodiesel is produced from first- 22
generation feedstock, i.e. edible oil seeds, although further emphasis is placed on the use of 23
non-food based feedstock, such as agricultural wastes, industrial biowastes, and non-food 24
based energy crops, as stipulated in the Renewable Energy Directive (RED) II [13]. The 25
perspectives of aviation biofuel production for the EU are summarized by Prussi et al. [8], 26
which was motivated by the push for reduced greenhouse gas emissions in aviation [14,15]. In 27
this industry, the processing method of hydroprocessed esters and fatty acids (HEFA) has been 28
certified as one of the biojet fuel production pathway by ASTM International [15] to improve 29
the oxidative stability and heating value of the biojet fuel [16]. The KLM airline is already 30
operating a daily intercontinental flight using HEFA [17], demonstrating similar combustion 31
properties compared to conventional jet fuels [18].
32
In the power generation industry, biodiesel is an efficient substitute of fossil fuels while 33
achieving the benefit of lower NOX emissions [19]. The continuous swirl burning mode of the 34
gas turbine combustor has made it feasible to be adopted in the fuel-flexible micro gas turbines 35
[20]. Recent studies have shown that the swirling flame behavior of biodiesel is somewhat 36
similar to diesel despite the visibly of different flame spectral characteristics [21]. The coconut 37
biodiesel was reported to emit the lowest NO and CO compared to soy and palm biodiesels 38
[22], attributable to the fuel chemistry effect that plays an important role in the pollutant 39
formations, i.e., degree of unsaturation of the biofuel.
40
The pollutant emission of aero engines was spectacularly cut back by the end of the last 41
century [23]. Non-premixed combustion mode is characterized by high flame stability and also 42
excessive NOX emission [24]. Consequently, various lean flame concepts were developed and 43
put into practice to provide a homogeneous temperature profile at the turbine inlet [25]. The 44
list includes rich burn-quick quench-lean burn (RQL), lean premixed prevaporized (LPP) swirl, 45
and catalytic combustors [26]. RQL combustion offers the best of two worlds: the rich flame 46
root helps flame stabilization while the residence time is insufficient for thermal NOX
47
formation [27]. However, the flame is less homogeneous in the lean side, hence, the NOX
48
emission of this concept falls behind that of LPP burners, which feature a swirler for flame 49
stability [28]. To further cut NOX emissions, increased combustion air flow is required, pushing 50
LPP to the lean blowout limitation where thermoacoustic oscillations endanger the operation 51
[29]. Other approaches are using more but smaller burners [30] and flow control of concentric 52
swirlers [31]. Catalytic combustion was a promising idea to provide a homogeneous flue gas 53
stream, but the excessive unburnt fuel due to the large wall surface areas hampered the 54
spreading of this concept [32]. The most straightforward approach to eliminate NOX emission 55
is oxyfuel combustion [33]. Since efficient oxygen extraction from the atmosphere is not solved 56
yet, hence, it is not a competitive solution for land-based applications. Nevertheless, this 57
concept makes carbon capture and storage technologies easier since the flue gas contains only 58
carbon dioxide and water vapor [34].
59
The next advancement in combustion technology was flameless combustion, which 60
solves the high flame temperature problem, hence characterized by even lower thermal NOX
61
formation than LPP burners by recirculating a portion of the flue gas [35]. This concept works 62
flawlessly in a laboratory environment, nevertheless, the efficient and reliable flue gas 63
recirculation still has to be solved at practical scales [36]. Similar to the RQL concept, air 64
staging provided promising results in NOX emission reduction in swirl burners [37–39], 65
however, the perfectly homogeneous fuel-air mixture could lead to the optimal result. Mixture 66
control was in the focus of hypersonic vehicles [40] to provide a proper heat release pattern, 67
and more recently, in internal combustion engines [41]. This is also a key momentum of the 68
present concept with a difference of average flow velocity in the range of 1 m/s instead of a 69
few hundred m/s. Motivated by the reviewed combustion concepts above, a novel swirl burner 70
concept was designed with a central plain-jet airblast atomizer, detailed in Subsection 2.1. The 71
cold atomizing air delays the ignition of the mixture in the central region, which leads to ultra- 72
low NOX emission. The observed flame volume was approximately 150×150×150 mm on 73
average which means 4 MW/m3 volumetric heat release rate. This combustion concept can be 74
best characterized by Mixture Temperature-Controlled (MTC) combustion mode, which is a 75
novel variant of RQL combustion since mixture ignition is delayed at the center by controlling 76
the temperature instead of the fuel-air mixture. To see this operation mode, see the 77
supplementary video records in the web version of this paper. A similar concept in industrial 78
scale was presented by Wang et al. [42] in a retrofit of a utility boiler.
79
The novelty of the present study is the following. To reduce our dependence on fossil 80
fuels, the renewable content of conventional petroleum-based fuels can be increased. Hence, 81
D, CME, and their blends were investigated in a novel, MTC burner. The liquid fuels were 82
atomized by a plain-jet airblast atomizer, and the combustion air was preheated to various 83
temperatures. Since the cold atomizing air flow occupies the central region, the combustion 84
can be delayed, leading to lifted flames. Hence, combustion occurs in a large volume, 85
consequently, extremely low NO emission can be achieved.
86 87
2. Materials and methods 88
The used combustion chamber is detailed in this section first, also discussing the 89
measurement uncertainties, swirl, and average air temperature since atomizing air also enters 90
the combustion chamber beside the preheated combustion air. Secondly, the fuel properties are 91
discussed for D, CME, and their blends. Thirdly, the estimated spray characteristics are 92
evaluated.
93 94
2.1 Experimental setup 95
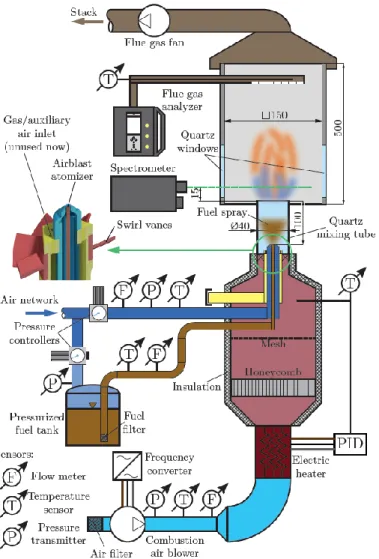
The schematic of the atmospheric test rig is shown in Fig. 1. The liquid fuel was 96
delivered from a pressurized tank to maintain a smooth flow rate, measured by an Omega 97
FPD3202 positive displacement flow meter. It was calibrated for diesel fuel and CME with a 98
result of < 2.7% uncertainty at 95% level of significance. The combustion power was 13.3 kW, 99
and the air-to-fuel equivalence ratio was 1.25 in all cases. Atomization of the fuel was 100
performed by a plain-jet airblast atomizer. The atomizing gauge pressure, pg, was varied 101
between 0.3 bar and 0.9 bar in 0.15 bar steps. The atomizing air flow rate was considered during 102
the adjustment of the combustion air flow rate to ensure the identical equivalence ratio. More 103
details on the atomizer characteristics are discussed in Subsection 2.3. The volume flow rate 104
of atomizing air was measured by a pre-calibrated Omega FMA1842A flow meter. Its 105
uncertainty was 1 liter/min in the 20-100 liter/min operating range. The combustion air was 106
delivered by a frequency-controlled side channel blower. The flow rate was measured by a pre- 107
calibrated Fuji Electric FWD050D2-A52 ultrasonic flow meter which had a 5% uncertainty of 108
the reading. The combustion air was preheated to the desired temperature by a PID-controlled, 109
11.8 kW Herz PH92 electric air heater in the range of tca = 150-350 °C in 50 °C steps.
110 111 112
113
Figure 1. The combustion test rig.
114 115
A Testo 350 flue gas analyzer was used to measure the CO and NO content. Since this 116
device features an O2 sensor, a constant 4.2% O2 level was measured and no correction was 117
required to have a similar O2 basis for the pollutants. The uncertainty of the CO, NO, and O2
118
sensors were 3 ppm, 2 ppm, and 0.2 V/V%, respectively. The spectrometer was manufactured 119
by OpLab Kft. and featured a Hamamatsu S3904-1024Q nMOS 1024 pixel photosensor. The 120
spectrum range was 260-580 nm, resulting in a 0.3125 nm spectral resolution. A Fujifilm HS10 121
camera in a fixed position was recording three flame images at each operating point for visual 122
evaluation, placed next to the spectrometer. All the temperature sensors were B-class Pt100 123
resistance thermometers (0.4 °C accuracy), except for the combustion air upstream and the flue 124
gas measurements where standard K-type thermocouples (accuracy is max(2.2,t[°C]×0.0075), 125
which is 5.6 °C at 745 °C) were installed due to the elevated temperatures. Even though the 126
flue gas temperature measurement accuracy seems excessive, the measurement error is similar 127
at high temperatures. Hence, the temperature differences are much more accurate.
128
The annulus at the 45° swirl vane had a 40 mm outer and 21 mm inner diameter, 129
generating a geometric swirl number, S = 0.787 [28]. The theoretical air demand for 13.3 kW 130
combustion power and 4.2% excess O2 is 16 kg/h which is the sum of atomizing and 131
combustion air flow rates. At pg = 0.3 bar, the atomizing air flow rate was varied between 2.13 132
kg/h (at tca = 350 °C) and 2.37 kg/h (at tca = 150 °C), depending on the combustion air 133
preheating temperature since the whole rig reached higher temperatures and the hydraulic 134
losses increased. The atomizing air flow rates were varied between 5.45 kg/h and 6.1 kg/h at 135
pg = 0.9 bar.
136
137
2.2 Fuel properties 138
The fuels used in the present study are the standard Euro 5 diesel and CME, which was 139
produced in-house via the transesterification process. The coconut oil was first heated up to 60 140
°C before mixing with methanol and potassium hydroxide (KOH) at the ratio of 114:50:1 141
(oil:methanol:KOH) by mass. The mixture was stirred for 2 h using a magnetic stirrer to ensure 142
a homogenous reaction at 60 °C to convert the fatty acids into methyl esters. Subsequently, the 143
end product was left to separate into two distinct layers, i.e. biodiesel and glycerol. The latter 144
was removed by decanting the mixture. The remained biodiesel was heated up to 120 °C for 4 145
hours in an ordinary oven, open to the atmosphere to vaporize the diluted methanol and water.
146
Characterization of the biodiesel was carried out via gas chromatography (Agilent 7820A) 147
based on the EN 14103 standard. The production yield was 96.9%. The CME is mainly 148
composed of ~93% saturated fatty acids, as shown in Table 1.
149
150
Table 1. Fatty acid composition of the CME.
151
Acid Structure Composition [%]
Caprylic acid C8:0 6.78
Capric acid C10:0 5.61
Lauric acid C12:0 51
Myristic acid C14:0 18.51
Palmitic acid C16:0 9.26
Stearic acid C18:0 1.66
Oleic acid C18:1 6.06
Linoleic acid C18:2 1.12
152
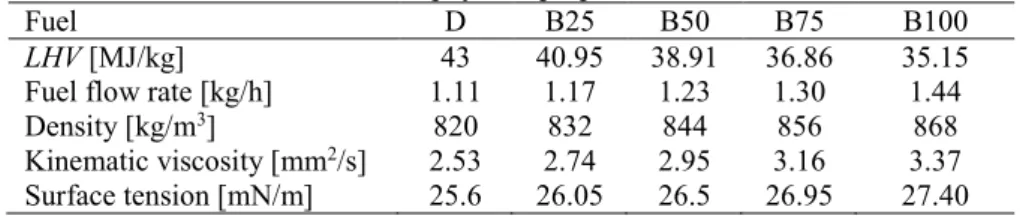
The fuel properties for the estimation of atomization characteristics and maintaining the 153
13.3 kW combustion power are shown in Table 2. The lower heating value, LHV, was estimated 154
based on [43], the rest of the properties of diesel fuel were measured, while the other parameters 155
for the CME and the blends were estimated based on Refs. [44–47]. The density was measured 156
using a standard borosilicate 10 ml pycnometer, the kinematic viscosity by a Cannon-Fenske- 157
type viscometer; both of them were performed in a temperature-controlled oil bath. The surface 158
tension was measured by the Wilhelmy plate method, also in a tempered environment. The 159
CME is noted with B100, while the other blends are referred to as BX, where X is the 160
volumetric CME content.
161 162
Table 2. Relevant physical properties of the fuels.
163
Fuel D B25 B50 B75 B100
LHV [MJ/kg] 43 40.95 38.91 36.86 35.15 Fuel flow rate [kg/h] 1.11 1.17 1.23 1.30 1.44
Density [kg/m3] 820 832 844 856 868
Kinematic viscosity [mm2/s] 2.53 2.74 2.95 3.16 3.37 Surface tension [mN/m] 25.6 26.05 26.5 26.95 27.40 164
2.3 Liquid fuel atomization 165
The fuel pipe of the plain-jet airblast atomizer had 1.5 mm outer and 1.2 mm inner 166
diameter, and the diameter of the air nozzle was 2.2 mm. Based on our previous work [48] on 167
high-velocity airblast atomization, estimated Sauter Mean Diameters, SMD, at all conditions 168
are summarized in Table 3. The corresponding air-to-liquid mass flow rates, ALR, were in the 169
range of 1.67 (B100 at pg = 0.3 bar)–5.16 (D at pg = 0.9 bar).
170
171
Table 3. Estimated SMD [μm] at all investigated conditions.
172
pg [bar]/Fuel D B25 B50 B75 B100
0.3 8.29 9.07 9.88 10.73 11.59
0.45 7.45 8.13 8.84 9.58 10.32
0.6 6.96 7.58 8.23 8.90 9.57
0.75 6.62 7.20 7.80 8.43 9.05
0.9 6.38 6.94 7.51 8.10 8.69
173
Among the fuel parameters discussed in Table 2, the higher viscosity, surface tension, 174
and liquid flow rate of B100 to diesel fuel resulted in an increase in SMD. The other reason 175
why diesel fuel standards allow only a few percent biodiesel is also due to the lower volatility 176
of the latter [49,50]. As a consequence, a fuel spray with high biodiesel content requires more 177
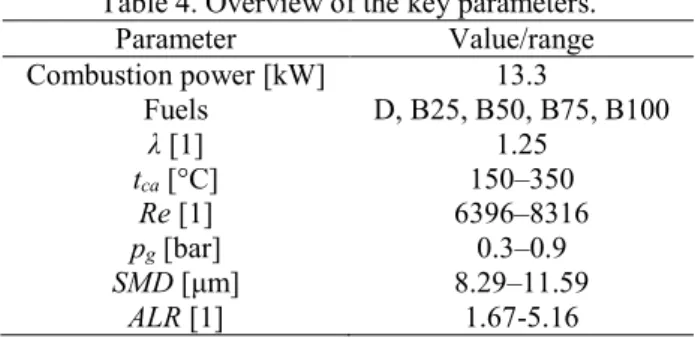
time for complete vaporization. The key combustion parameters are summarized in Table 4, 178
including the Reynolds number, Re, at the mixing tube.
179
180
Table 4. Overview of the key parameters.
181
Parameter Value/range
Combustion power [kW] 13.3
Fuels D, B25, B50, B75, B100
λ [1] 1.25
tca [°C] 150–350
Re [1] 6396–8316
pg [bar] 0.3–0.9
SMD [μm] 8.29–11.59
ALR [1] 1.67-5.16
182
3. Results and discussion 183
Due to the unusual swirl numbers and the novel MTC combustion mode, this section 184
starts with a qualitative analysis to present the occurring flame shapes and their characteristics 185
at four distinct pg and tca values for all fuels. Then the analysis of chemiluminescent emission 186
is discussed, which is followed by an overall quantitative evaluation, presenting OH* intensity, 187
flue gas temperature, and pollutant emissions.
188
189
3.1 Flame characteristics 190
The atomizing air discharge significantly increases the axial thrust, hence, lowers the 191
overall swirl number. Since the swirl number is depending on both pg and tca, the results are 192
shown in Fig. 2a. The high atomizing air flow rates decreased S significantly. This is the reason 193
why V-shaped flames were not observed at all which require otherwise S > 0.52, based on our 194
previous observations [51]. Also, the average temperature of the sum of combustion air and 195
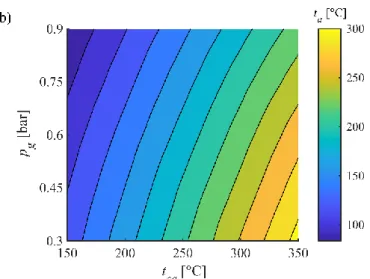
atomizing air, ta, was notably affected by the atomizing air flow rate, shown in Fig. 2b. Even 196
though the pressure, volume flow rate, and temperature of the atomizing air was measured, the 197
expansion at the nozzle had to be calculated, assuming adiabatic expansion, adopted from a 198
previous paper on a similar atomizer type [52]. This strong influence of the atomizing air leads 199
to the MTC name of this combustion concept.
200
201
202 Figure 2. a) swirl number and b) average temperature of the combustion plus atomizing air inlets.
203 204
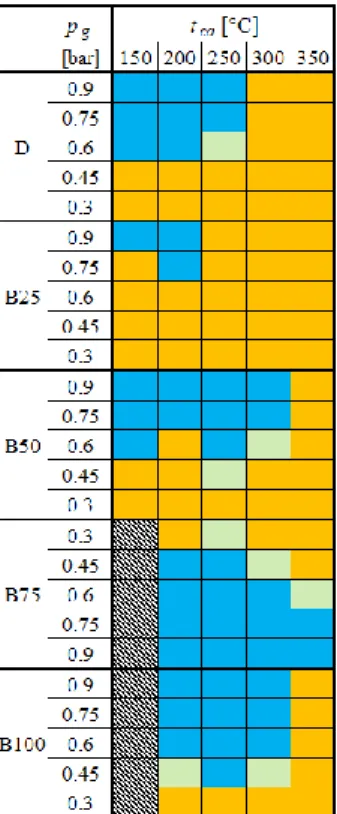
Considering all the measurement setups, two flame shapes were observed during the 205
combustion tests: straight flame and lifted flame, featuring distributed combustion, which is 206
specific to the MTC combustion. Since the conditions resulted in fully turbulent combustion, 207
there were setups where both shapes were observed and a transition occurred between them at 208
about 1 Hz. The observed flame shapes are presented in Fig. 3. Even though the lowest 209
indicated combustion air preheating temperature was 150 °C, lower values were also tested 210
without achieving self-sustaining combustion. In the case of B75 and B100, at least 200 °C 211
preheating temperature was necessary for a stable flame.
212 213
214 Figure 3. Flame shapes at all the investigated conditions. Orange: straight, blue: distributed (MTC), light green:
215
transitory flames. No stable combustion was observed in the hatched region due to insufficient fuel vaporization.
216 217
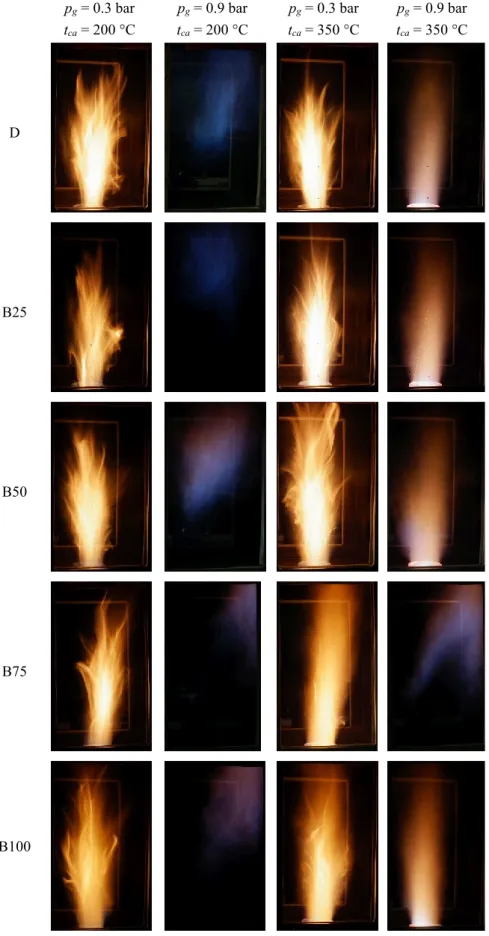
Four operating points were selected to present the combustion characteristics for visual 218
evaluation, shown in Fig. 4. According to Fig. 3, only straight flames were observed at pg = 0.3 219
bar and tca = 200 °C and 350 °C. This was true for pg = 0.9 bar and tca = 350 °C as well, 220
excluding B75 which allows the visual comparison of the effect of both pg and tca on the flame.
221
pg = 0.9 bar and tca = 200 °C condition was selected to show the MTC combustion mode. The 222
hollow/low-temperature central part was also concluded by Yang et al. [37] and Zhou et al.
223
[38] in the case of the burner upgrade of a coal-fired boiler. The elevated combustion air inlet 224
temperature resulted in more luminous flames in all the cases, and the CME dilution decreases 225
the number of flares. This is more spectacular for B75 and B100, but both B50 and B25 show 226
this characteristic.
227
The effect of pg on the flame structure can be evaluated based on the third and fourth 228
columns of Fig. 4; the flame luminosity was lower, and there were no flares present. Even 229
though the estimated SMD of D at pg = 0.3 bar is very close to that of B100 at pg = 0.9 bar, the 230
resulting flame structures are different as the latter one features no flares unlike the former fuel.
231
Considering that the equivalent air inlet temperature, shown previously in Fig. 2b, which 232
considers both the cooler atomizing air and the combustion air, the opposite results would be 233
intuitively expected, based purely on the boundary and global combustion conditions. The 234
effect of larger droplet sizes, however, is shown in the last column. By increasing the 235
concentration of CME, the flame becomes more luminous as the larger droplets require more 236
time to evaporate, hence, the fuel-air mixture is less homogeneous as the share of the CME is 237
increasing.
238
pg = 0.3 bar tca = 200 °C
pg = 0.9 bar tca = 200 °C
pg = 0.3 bar tca = 350 °C
pg = 0.9 bar tca = 350 °C
D
B25
B50
B75
B100
239 Figure 4. Flame images at various conditions. All the presented, single images were recorded at 1/30 s shutter 240
speed, f/4, and ISO-400. See the supplementary materials for the video files in FullHD at 30 frames/second.
241 242
The distributed combustion is characterized by very low luminosity and principally blue 243
color in the case of D and B25. Fuels with higher CME content feature purple color which is 244
the evidence of different reaction pathways due to the fuel-bonded oxygen, also observed by 245
Chong et al. by utilizing sunflower biodiesel [21]. Note that the asymmetry of flames, i.e., they 246
are leaning right, is attributed to the cooled microphone socket on the left side of the 247
combustion chamber – the acoustical data is omitted in the present study for the sake of 248
conciseness. This effect is more spectacular in the case of distributed combustion mode where 249
the heat release rate is lower, and hence the effect of wall temperature on the flame shape is 250
significant. Overall, the flame images show a marginal difference between the fuel types which 251
is an expected result since the physical properties of the biodiesel are close to that of standard 252
diesel fuel.
253 254
3.2 Chemiluminescent and pollutant emissions and flue gas temperature 255
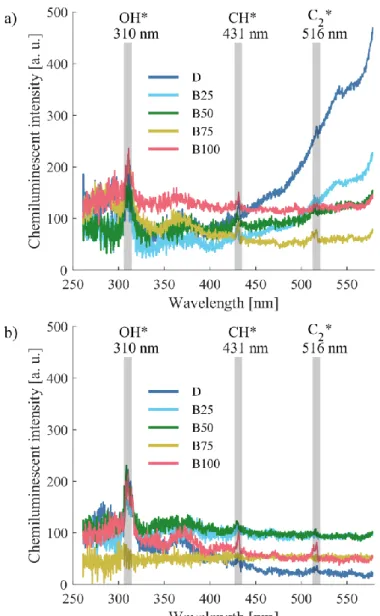
The chemiluminescence spectra of all fuels at pg = 0.3 bar, tca = 200 °C and pg = 0.9 bar, 256
tca = 350 °C are presented in Fig. 5, while the corresponding flame images were shown in 257
Fig. 4. The most characteristic three radicals of hydrocarbon flames, i.e., OH*, CH*, and C2* 258
are highlighted; however, the spectra were checked for numerous other potential 259
chemiluminescent peaks, summarized by Gaydon [53]. The black body radiation of D and B25 260
is spectacular in Fig. 5a, while B75 in Fig. 5b was not a straight flame, hence, the spectrum is 261
practically the dark current. C2* has the lowest intensity among the highlighted radicals, which 262
fades into the background noise in several cases. This is also true for CH*; B25 showed the 263
lowest intensity at 431 nm, and it also faded into the background in a few cases. Only the OH*
264
was characterized by a high enough signal-to-noise ratio to evaluate and compare the signal 265
with other operational parameters.
266 267
268
269 Figure 5. Chemiluminescent emission at a) pg = 0.3 bar, tca = 200 °C, b) pg = 0.9 bar, tca = 350 °C for all fuels.
270 271
Figure 6 contains OH*, flue gas temperature, NO, and CO emission plots at all 272
conditions. The OH* emission was evaluated only for straight flames not due to the fixed 273
spectrometer position, but the signal intensity was very low and fluctuating for distributed 274
combustion mode, leading poor signal-to-noise ratio. The correlation between all the OH*, flue 275
gas temperature, and the NO emission is evident; tca has a dominating effect and the decrease 276
of overall air temperature with the increasing pg, notably influences it. The trends apart of OH*
277
plots are continuous, and there is no sudden change within a single combustion mode. The 278
highest values were measured at D combustion, however, all of the other fuels showed similar 279
amplitudes and maxima. Considering the trends of D and B25, the increasing preheating 280
temperature increases the OH* intensity up to 300 °C and 250 °C, respectively. Then the 281
intensity decreases as fuel evaporation intensifies with a further increase in tca, which ultimately 282
leads to a more homogeneous fuel-air mixture.
283
The flue gas temperature, tfg, was governed by tca and also influenced by the atomizing 284
air temperature, taa, as it was presented in Fig. 2b, and also affected by the flame shape, shown 285
in Fig. 3. In addition to the thermal boundary conditions, tfg was also affected by thermal 286
radiation in the case of luminous flames. This is especially true for D flames as it showed a 287
high tendency to soot formation, also indicated in Fig. 5a. However, the governing heat transfer 288
mode was convection in distributed combustion mode as the flame luminosity, hence thermal 289
radiation significantly decreased.
290 291
292 Figure 6. OH* emission, flue gas temperature and pollutant emission results.
293 294
NO emission responds most sensitively to the flame shape variation, hence, the 295
suddenly dropping values are clearly limited by the 20 ppm contour lines. These emission 296
trends are closely following the average air temperature variation of Fig. 2b in the case of 297
straight flames. The MTC mode is characterized by ultra-low NO emission, the aforementioned 298
20 ppm limitation at 4.2% O2 level is equivalent to 21 ppm NO at 3% O2 level and 7 ppm at 299
15% O2 level. The lowest measured value was 7 ppm which is 2.5 ppm at 15% O2 level. The 300
2015/2193/EU directive allows 100 mg/Nm3 emission, equivalent to 53.1 ppm for natural gas 301
combustion at 3% O2, which was flawlessly met. Also, this is a conservative comparison since 302
liquid fuel combustion usually has two times higher limitations. The 7 ppm also meets the 303
single cycle, natural gas-fired gas turbine requirement of the BACT Guidelines Part D, which 304
is known as the ‘California standard’ that is among the strictest ones among all the emission 305
regulations for power plants and utility boilers. This low emission value can only be achieved 306
by using selective catalytic reduction units in existing plants. The critical advantage of the 307
MTC mode is the low average flue gas temperature, which is extremely important for, e.g., gas 308
turbine applications. Even though the temperature is significantly higher in large combustion 309
chambers, the combustion occurring in a large volume is favorable to avoid uneven temperature 310
distribution in the combustion chamber that leads to high NO emission. This mode is facilitated 311
by the following phenomena. Thermodynamically, there is a closely adiabatic expansion in the 312
atomizer nozzle which leads to a sudden temperature drop; this process and the calculation 313
methods were described in an earlier paper [52]. Starting from taa = 20 °C, the temperature 314
decreases to -1 °C – -29 °C at pg = 0.3–0.9 bar. The corresponding discharge velocity range is 315
241–547 m/s. This free jet quickly decays, nevertheless, due to the considerable flow rate, this 316
environment obstructs the fast mixing of the droplets with the hot combustion air, leading to 317
delayed evaporation and hence ignition. This complex behavior will be numerically analyzed 318
as subsequent research work. Nevertheless, the detailed spatial distribution has a notable 319
impact on the flame characteristics, which cannot be directly derived from the global results of 320
Fig. 2b. Overall, the NO emission is decreasing with the increasing share of CME which was 321
also observed by Liu et al. [19] and Chiong et al. [22]. Quantitatively, the NO emission of D 322
combustion was 10% of that of an LPP burner [54], investigated by the authors under highly 323
similar conditions. The significant NO reduction is also evident when straight flames and the 324
MTC mode is compared.
325
The CO emission was below 10 ppm in the case of D, B25, and B50 combustion. A few 326
measurement points exceeding 20 ppm was observed for B75 and B100 in the transitory 327
operation, i.e., when the flame was altered between straight and distributed combustion modes.
328
Also, atomizing pressures of 0.75 bar and 0.9 bar increased the CO emission of B75 329
combustion at tca = 300 and 350 °C, probably due to the poor mixture quality, originated from 330
the high pg value that resulted in lower residence times. Neat D is characterized by lower CO 331
emission than that of CME combustion, in line with literature data [19,22]. Considering the 332
2015/2193/EU directive for CO emission of 100 mg/Nm3 or 87.3 ppm at 3% O2 level, all the 333
operating points fulfill this limitation. Note that this is respective to natural gas combustion, 334
and the directive allows higher emissions for liquid fuels; consequently, a conservative 335
approach was applied here. The CO emission limitation in BACT Guidelines Part D is 6 ppm 336
at 15% O2 which is equal to 15 ppm at the currently used 4.2% O2 level. Figure 6 shows that 337
there is no correlation between the flue gas temperature plots and the increased CO emission, 338
which is a precursor of increasing unburnt hydrocarbon emission [26], confirmed by a 339
preceding study by using a similar burner [54]. Consequently, the MTC burner design is 340
appropriate from CO emission point of view.
341
Considering the fuels, D featured the lowest CO and the highest NO emission, by 342
comparing similar flame shapes. Since the CO emission was uniformly low in each case 343
compared to the present regulations, NO emission is of greater concern. It was also concluded 344
here that the higher CME share leads to lower NO, in accordance with the literature [22]. It is 345
due to the fuel-bonded oxygen content of CME lowers the LHV, hence, the adiabatic flame 346
temperature. The MTC mode was the dominant one in the case of B75, followed by B100 and 347
B50. Interestingly, distributed combustion was present in a significantly wider parameter range 348
of D combustion than in the case of B25. Consequently, the high share of biodiesel is favorable, 349
and less concentrated fuels are advised to be tested before direct use since the combustion 350
characteristics might notably differ even though the physical properties are close to that of neat 351
D.
352
353
4. Conclusions 354
Combustion of standard diesel fuel (D, EN590:2017), coconut methyl ester (CME), and 355
their blends were investigated in a novel, ultra-low emission burner. The notable ignition 356
delaying effect of the low temperature atomizing air on the combustion process and flame 357
characteristic lead to the name of Mixture Temperature-Controlled (MTC) Combustion, which 358
can be used in numerous steady-operating practical applications, including gas turbines, 359
furnaces, and boilers. MTC provided significantly lower emissions than current combustion 360
concepts, such as LPP. The following conclusions were derived.
361
1. The CO emission was below 10 ppm in most of the cases, which is equivalent to 12 and 362
4 mg/Nm3 at 3% and 15% O2, respectively, fulfilling all the regulations.
363
2. The NO emission of straight flames ranged from 60 to 183 ppm, exceeding the 364
limitations of the 2015/2193/EU directive of 100 mg/Nm3 or 53.1 ppm at 3% O2. 365
Nevertheless, the emission at MTC mode was < 20 ppm in the majority of the cases 366
that is equivalent to 40 mg/Nm3 at 3% O2, and 13 mg/Nm3 at 15% O2. The lowest 367
measured NO emission value was 7 ppm ( 2.5 ppm at 15% O2), fulfilling the ‘California 368
standard’ for single-cycle gas turbines. Also, this pollutant concentration was only 10%
369
of that of an LPP burner operated under similar conditions [54].
370
3. Only the chemiluminescent emission of OH* of the straight flames provided an 371
acceptable signal-to-noise ratio. The trends followed that of both flue gas temperature 372
and NO emission.
373
4. Overall, the combustion of B100 provided the lowest emissions, while blends with 374
lower CME share leads to higher emissions.
375
376
Funding 377
This work has been supported by the National Research, Development and Innovation 378
Fund of Hungary, project №.s OTKA-FK 124704, TUDFO/51757/2019-ITM Thematic 379
Excellence Program, New National Excellence Program of the Ministry for Innovation and 380
Technology, project №.s ÚNKP-19-4-BME-213, ÚNKP-19-3-I-BME-243, and the János 381
Bolyai Research Scholarship of the Hungarian Academy of Sciences.
382
383
Conflict of interest 384
The authors declare that there is no conflict of interest.
385
386
References 387
[1] Bolwig S, Bazbauers G, Klitkou A, Lund PD, Blumberga A, Gravelsins A, et al.
388
Review of modelling energy transitions pathways with application to energy system 389
flexibility. Renew Sustain Energy Rev 2019;101:440–52.
390
doi:10.1016/j.rser.2018.11.019.
391
[2] Du Z, Wood DL, Belharouak I. Enabling fast charging of high energy density Li-ion 392
cells with high lithium ion transport electrolytes. Electrochem Commun 393
2019;103:109–13. doi:10.1016/j.elecom.2019.04.013.
394
[3] Mao M, Gao T, Hou S, Wang F, Chen J, Wei Z, et al. High-Energy-Density 395
Rechargeable Mg Battery Enabled by a Displacement Reaction. Nano Lett 396
2019;19:6665–72. doi:10.1021/acs.nanolett.9b02963.
397
[4] Shi W, Mao J, Xu X, Liu W, Zhang L, Cao X, et al. An ultra-dense NiS2/reduced 398
graphene oxide composite cathode for high-volumetric/gravimetric energy density 399
nickel-zinc batteries. J Mater Chem A 2019;7:15654–61. doi:10.1039/c9ta04900b.
400
[5] Eggels R. The challenge of modelling aeronautical combustion chambers. Proc. 9th 401
Eur. Combust. Meet., Lisbon: 2019.
402
[6] Liu G, Yan B, Chen G. Technical review on jet fuel production. Renew Sustain Energy 403
Rev 2013;25:59–70. doi:10.1016/j.rser.2013.03.025.
404
[7] Matsumoto H, Domae K. Assessment of competitive hub status of cities in Europe and 405
Asia from an international air traffic perspective. J Air Transp Manag 2019;78:88–95.
406
doi:10.1016/j.jairtraman.2019.01.006.
407
[8] Prussi M, O’Connell A, Lonza L. Analysis of current aviation biofuel technical 408
production potential in EU28. Biomass and Bioenergy 2019;130:105371.
409
doi:10.1016/j.biombioe.2019.105371.
410
[9] Chiong MC, Chong CT, Ng JH, Lam SS, Tran MV, Chong WWF, et al. Liquid 411
biofuels production and emissions performance in gas turbines: A review. Energy 412
Convers Manag 2018;173:640–58. doi:10.1016/j.enconman.2018.07.082.
413
[10] Wei H, Liu W, Chen X, Yang Q, Li J, Chen H. Renewable bio-jet fuel production for 414
aviation: A review. Fuel 2019;254. doi:10.1016/j.fuel.2019.06.007.
415
[11] Wong KY, Ng JH, Chong CT, Lam SS, Chong WT. Biodiesel process intensification 416
through catalytic enhancement and emerging reactor designs: A critical review. Renew 417
Sustain Energy Rev 2019;116. doi:10.1016/j.rser.2019.109399.
418
[12] IEA. Technology roadmap: Delivering sustainable Bioenergy. 2017.
419
[13] Committee on Industry Research and Energy. Report on the proposal for a directive of 420
the European Parliament and of the Council on the promotion of the use of energy 421
from renewable sources (recast (COM(2016)0767 – C8‑0500/2016 – 422
2016/0382(COD)). 2017.
423
[14] Lokesh K, Sethi V, Nikolaidis T, Goodger E, Nalianda D. Life cycle greenhouse gas 424
analysis of biojet fuels with a technical investigation into their impact onjet engine 425
performance. Biomass and Bioenergy 2015;77:26–44.
426
doi:10.1016/j.biombioe.2015.03.005.
427
[15] European Union Aviation Safety Agency. European Aviation Environmental Report.
428
2019.
429
[16] Why ESK, Ong HC, Lee HV, Gan YY, Chen WH, Chong CT. Renewable aviation fuel 430
by advanced hydroprocessing of biomass: Challenges and perspective. Energy Convers 431
Manag 2019;199:112015. doi:10.1016/j.enconman.2019.112015.
432
[17] KLM. Corporate Biofuel Programme 2019.
433
https://www.klm.com/travel/nl_en/prepare_for_travel/fly_co2_neutral/all_about_sustai 434
nable_travel/biofuel.htm (accessed January 16, 2020).
435
[18] Bergthorson JM, Thomson MJ. A review of the combustion and emissions properties 436
of advanced transportation biofuels and their impact on existing and future engines.
437
Renew Sustain Energy Rev 2015;42:1393–417. doi:10.1016/j.rser.2014.10.034.
438
[19] Liu K, Wood JP, Buchanan ER, Martin P, Sanderson VE. Biodiesel as an Alternative 439
Fuel in Siemens Dry Low Emissions Combustors: Atmospheric and High Pressure Rig 440
Testing. J Eng Gas Turbines Power 2010;132:1–9. doi:10.1115/1.3204617.
441
[20] Bolszo CD, McDonell VG. Emissions optimization of a biodiesel fired gas turbine.
442
Proc Combust Inst 2009;32:2949–56. doi:10.1016/j.proci.2008.07.042.
443
[21] Chong CT, Chiong M, Ng J, Lim M, Tran M-V, Valera-Medina A, et al. Oxygenated 444
sunflower biodiesel: Spectroscopic and emissions quantification under reacting swirl 445
spray conditions. Energy 2019;178:804–13. doi:10.1016/j.energy.2019.04.201.
446
[22] Chiong MC, Chong CT, Ng JH, Tran MV, Lam SS, Valera-Medina A, et al.
447
Combustion and emission performances of coconut, palm and soybean methyl esters 448
under reacting spray flame conditions. J Energy Inst 2019;92:1034–44.
449
doi:10.1016/j.joei.2018.07.003.
450
[23] Correa SM. Power generation and aeropropulsion gas turbines: From combustion 451
science to combustion technology. Symp Combust 1998;27:1793–807.
452
doi:10.1016/S0082-0784(98)80021-0.
453
[24] Zhou H, Meng S. Numerical prediction of swirl burner geometry effects on NOx 454
emission and combustion instability in heavy oil-fired boiler. Appl Therm Eng 455
2019;159:113843. doi:10.1016/j.applthermaleng.2019.113843.
456
[25] Gupta AK. Gas Turbine Combustion: Prospects and Challenges. Energy Convers 457
Manag 1997;38:1311–8.
458
[26] Lefebvre AH, Ballal DR. Gas turbine combustion. third. Boca Raton: CRC Press;
459
2010. doi:10.1002/1521-3773.
460
[27] Guin C, Trichet P. Optimisation of a two-head lean prevaporised premixed combustor.
461
Aerosp Sci Technol 2004;8:35–46. doi:10.1016/j.ast.2003.09.007.
462
[28] Beér JM, Chigier NA. Combustion aerodynamics. London: Robert E. Krieger 463
Publishing Company, Inc.; 1972.
464
[29] Huang Y, Yang V. Dynamics and stability of lean-premixed swirl-stabilized 465
combustion. Prog Energy Combust Sci 2009;35:293–364.
466
doi:10.1016/j.pecs.2009.01.002.
467
[30] Liu Y, Sun X, Sethi V, Nalianda D, Li YG, Wang L. Review of modern low emissions 468
combustion technologies for aero gas turbine engines. Prog Aerosp Sci 2017;94:12–45.
469
doi:10.1016/j.paerosci.2017.08.001.
470
[31] Wang Z, Lin Y, Wang J, Zhang C, Peng Z. Experimental study on NOx emission 471
correlation of fuel staged combustion in a LPP combustor at high pressure based on 472
NO-chemiluminescence. Chinese J Aeronaut 2019;33:550–60.
473
doi:10.1016/j.cja.2019.09.004.
474
[32] Reay DA. Catalytic combustion: Current status and implications for energy efficiency 475
in the process industries. Heat Recover Syst CHP 1993;13:383–90. doi:10.1016/0890- 476
4332(93)90039-X.
477
[33] Jovanović R, Swiatkowski B, Kakietek S, Škobalj P, Lazović I, Cvetinović D.
478
Mathematical modelling of swirl oxy-fuel burner flame characteristics. Energy 479
Convers Manag 2019;191:193–207. doi:10.1016/j.enconman.2019.04.027.
480
[34] Wu XD, Yang Q, Chen GQ, Hayat T, Alsaedi A. Progress and prospect of CCS in 481
China: Using learning curve to assess the cost-viability of a 2×600 MW retrofitted 482
oxyfuel power plant as a case study. Renew Sustain Energy Rev 2016;60:1274–85.
483
doi:10.1016/j.rser.2016.03.015.
484
[35] Xing F, Kumar A, Huang Y, Chan S, Ruan C, Gu S, et al. Flameless combustion with 485
liquid fuel: A review focusing on fundamentals and gas turbine application. Appl 486
Energy 2017;193:28–51. doi:10.1016/j.apenergy.2017.02.010.
487
[36] Fooladgar E, Tóth P, Duwig C. Characterization of flameless combustion in a model 488
gas turbine combustor using a novel post-processing tool. Combust Flame 489
2019;204:356–67. doi:10.1016/j.combustflame.2019.03.015.
490
[37] Yang W, Wang B, Lei S, Wang K, Chen T, Song Z, et al. Combustion optimization 491
and NOx reduction of a 600 MWe down-fired boiler by rearrangement of swirl burner 492
and introduction of separated over-fire air. J Clean Prod 2019;210:1120–30.
493
doi:10.1016/j.jclepro.2018.11.077.
494
[38] Zhou C, Wang Y, Jin Q, Chen Q, Zhou Y. Mechanism analysis on the pulverized coal 495
combustion flame stability and NOx emission in a swirl burner with deep air staging. J 496
Energy Inst 2019;92:298–310. doi:10.1016/j.joei.2018.01.006.
497
[39] Ti S, Chen Z, Li Z, Kuang M, Xu G, Lai J, et al. Influence of primary air cone length 498
on combustion characteristics and NOx emissions of a swirl burner from a 0.5 MW 499
pulverized coal-fired furnace with air staging. Appl Energy 2018;211:1179–89.
500
doi:10.1016/j.apenergy.2017.12.014.
501
[40] Ferri A. Mixing-Controlled Supersonic Combustion. Annu Rev Fluid Mech 502
1973;5:301–38. doi:10.1146/annurev.fl.05.010173.001505.
503
[41] Katrašnik T. An advanced real-time capable mixture controlled combustion model.
504
Energy 2016;95:393–403. doi:10.1016/j.energy.2015.11.066.
505
[42] Wang Q, Chen Z, Wang L, Zeng L, Li Z. Application of eccentric-swirl-secondary-air 506
combustion technology for high-efficiency and low-NOx performance on a large-scale 507
down-fired boiler with swirl burners. Appl Energy 2018;223:358–68.
508
doi:10.1016/j.apenergy.2018.04.064.
509
[43] Channiwala SA, Parikh PP. A unified correlation for estimating HHV of solid, liquid 510
and gaseous fuels. Fuel 2002;81:1051–63. doi:10.1016/S0016-2361(01)00131-4.
511
[44] Kanaveli IP, Atzemi M, Lois E. Predicting the viscosity of diesel/biodiesel blends.
512
Fuel 2017;199:248–63. doi:10.1016/j.fuel.2017.02.077.
513
[45] Ayetor GK, Sunnu A, Parbey J. Effect of biodiesel production parameters on viscosity 514
and yield of methyl esters: Jatropha curcas, Elaeis guineensis and Cocos nucifera.
515
Alexandria Eng J 2015;54:1285–90. doi:10.1016/j.aej.2015.09.011.
516
[46] Das M, Sarkar M, Datta A, Santra AK. Study on viscosity and surface tension 517
properties of biodiesel-diesel blends and their effects on spray parameters for CI 518
engines. Fuel 2018;220:769–79. doi:10.1016/j.fuel.2018.02.021.
519
[47] Poling BE, Prausnitz JM, O’Connell JP. The properties of gases and liquids. Fifth.
520
McGraw-Hill; 2001. doi:10.1036/0070116822.
521
[48] Urbán A, Malý M, Józsa V, Jedelský J. Effect of liquid preheating on high-velocity 522
airblast atomization: From water to crude rapeseed oil. Exp Therm Fluid Sci 523
2019;102:137–51. doi:10.1016/j.expthermflusci.2018.11.006.
524
[49] Al Qubeissi M, Sazhin SS, Elwardany AE. Modelling of blended Diesel and biodiesel 525
fuel droplet heating and evaporation. Fuel 2017;187:349–55.
526
doi:10.1016/j.fuel.2016.09.060.
527
[50] Al Qubeissi M. Predictions of droplet heating and evaporation: An application to 528
biodiesel, diesel, gasoline and blended fuels. Appl Therm Eng 2018;136:260–7.
529
doi:10.1016/j.applthermaleng.2018.03.010.
530
[51] Józsa V, Kun-Balog A. Stability and emission analysis of crude rapeseed oil 531
combustion. Fuel Process Technol 2017;156:204–10.
532
doi:10.1016/j.fuproc.2016.11.004.
533
[52] Urbán A, Zaremba M, Malý M, Józsa V, Jedelský J. Droplet dynamics and size 534
characterization of high-velocity airblast atomization. Int J Multiph Flow 2017;95:1–
535
11. doi:10.1016/j.ijmultiphaseflow.2017.02.001.
536
[53] Gaydon AG. The spectroscopy of flames. 2nd ed. Chapman and Hall Ltd., London;
537
1974. doi:10.1016/0010-2180(75)90098-X.
538
[54] Kun-Balog A, Sztankó K, Józsa V. Pollutant emission of gaseous and liquid aqueous 539
bioethanol combustion in swirl burners. Energy Convers Manag 2017;149:896–903.
540
doi:10.1016/j.enconman.2017.03.064.
541 542