Doctoral School of Business and Management
THESIS SYNOPSIS
Ngo Thai Hung
Volatility spillover of the stock market and foreign exchange:
Evidence from CEE countries
PhD. Dissertation
Supervisor:
Dr. Barbara Maria Domotor, PhD
Budapest, 2020
Department of Finance
THESIS SYNOPSIS
Ngo Thai Hung
Volatility spillover of the stock market and foreign exchange:
Evidence from CEE countries
PhD. Dissertation
Supervisor:
Dr. Barbara Maria Domotor, PhD
© Ngo Thai Hung
TABLE OF CONTENTS
1. Preliminaries and objectives ... 1
2. Research questions ... 3
3. Methodology ... 4
4. Data ... 7
5. Main results ... 8
5.1 The dynamics of volatility spillover between stock and foreign exchange markets: empirical evidence from Central and East European countries ... 8
5.2 Does volatility transmission between stock market returns of Central and Eastern European countries vary from normal to turbulent periods?... 11
5.3 Volatility behavior of the foreign exchange rate and transmission among Central and Eastern European countries ... 13
6. References ... 16
7. Own publications ... 19
1 1. Preliminaries and objectives
The dynamic interrelations and volatility spillover effects among financial assets co-movements have greatly attracted special attention from both academics and practitioners because both play a fundamental role in economic growth of an economy (Chkili et al. 2012). In particular, the financial and economic turbulence during 2008-2009 re-established attentiveness to better understanding the nature of information spillover on and among financial markets (Aloui et al.
2011). Recent economic downturns have often comprised the contagion of stock markets and foreign exchange rates. These movements are a direct symptom of a pervasive uncertainty that gone beyond the boundaries of individual market, including emerging and frontier markets in Europe (Bubák et al. 2011). The financial crises reach its climax in mid-September 2008 referring to as a global financial crisis. It has unfolded in several stages, financial markets all around the world went through wild fluctuations, with volatility spreading across markets at an unprecedented speed. Hence, financial market crises have become a more frequently observed phenomenon, especially in emerging market economies (Yilmaz 2010). In a similar vein, Nishimura and Men (2010) document that Market deregulation and liberation have increased the globalization of financial markets, which influences the interdependence of asset prices across markets. Moreover, increasing regionalization of economic activities and liberalization of financial markets has been the cause of regional economic integrations across the world (Nath and Mishra, 2010). Due to globalization and financial liberalization are making international financial markets possible for more correlated and connected than ever before, an understanding of the correlations and interplays among different financial markets is also significant for foreign investors, financial institutions, and governments (Zhou et al. 2012).
Growing regional and multilateral trade agreements, increasing moderation of currency exchange policy, moving up economic have considerably enlarged the volume of cross-border trading and magnified the volatility of global currency exchange. Microeconomic theory says that exchange rate changes will affect the firm’s profits leading to changes in stock prices. Further, a decline of stock market prices in a country will give rise to investor selling and decrease demand for the country’s currency. The changes either negative or positive have a more extensive effect on firms whose revenues are largely connected to foreign exchange markets. An outflow of funds might
2
follow and result in depreciation of the currency. Do we understand this economic theory empirically? And how does the theory separate out the hypothesis of stock market efficiency?
Emerging and frontier financial markets in Central and Eastern European region, including Hungary, Poland, Romania, the Czech Republic and Croatia, are used for case studies because these countries are small, open, and export-dependent economies, and their monetary authorities firmly position significant weight on the stabilization of the exchange rates. Meaning that the exchange rate can be a crucial component of the transmission of monetary policy. For instance, the Hungary forint/US. Dollar exchange rate has experienced fluctuations and volatile movements from 1920s to 2007. It was settled at 275.23 on January 30, 2015 (Hsing, 2016). Similarly, the Polish government has to make an effort to lower the public finance deficit and prevent public debt from increasing excessively after participating in the EMU and introduce a successful program of participation in the Exchange Rate Mechanism. An utmost case is Croatia in which monetary policy is centered on one goal only and that is exchange rate stability (price stability) (Benazic and Tomic, 2014). The currency policy of these economies therefore dramatically influences the movement in the stock markets and prevent the markets from adjusting to the hypothetical level of efficiency. The contrary of exchange rates, the stock market, is inherently subject to foreign capital movements, random variation of stock prices with such a rational expectation may not prevail (Yang, 2017).
Transmission of financial market information among the Central and Eastern European markets has become a much research topic because the increasing interdependence of major financial market all over the world. An investigation of volatility spillover effects among equity markets and foreign exchange rates, and between the two financial markets could provide straightforward insight for foreign investors who seek for diversification opportunities abroad. This is because price, volatility and interlinkages of stock markets imply that the volatility of markets tends to move together, and the potential gains from international diversification will be reduced.
Interestingly, developing markets in emerging economies with a relatively high and stable growth rate in Central and Eastern European countries such as Hungary, Poland, the Czech Republic, Romania and Croatia in recent years is especially remarkable, and they are usually good choices for market participants looking to diversify their portfolios internationally. Furthermore, a central question of foreign exchange investors is that to what extent are currencies markets connected to
3
one another? when they establish and manage portfolios conditional on risk-return of profiles of a basket of currencies. Foreign exchange rate volatility is the outgoing trend to enhance investors and policymakers to make the decision. In particular, the interlinkage between the stock and foreign exchange markets is widely acknowledged that the drastic increasing trend in financial assets has been followed by increasing in high demand and supply of foreign currencies. The interdependency has been generated by both the high demand of currencies and equity flows, leading to some degrees of interdependency in both securities and currencies. Further, the considerable increase in the volatility of the two primary financial markets raises a question about the ability of the markets under consideration to fulfil the exchange rate and stock markets stability criteria.
2. Research questions
Given this background, the aim of this research is to investigate the volatility spillover effects and return connectedness across five financial markets in CEE countries as spillover effects can have a significant influence on the investor’s investment strategies (Hassan and Malik, 2007). Our focus on the CEE countries (Hungary, the Czech Republic, Poland, Romania and Croatia) represents, during the two last decades, the most stable emerging and frontier markets in terms of economic growth and stock market development. There are at least two important but unsettled issues: 1) whether volatility spillover effects occurred among stock returns; among foreign exchange rates;
and between stock returns and foreign exchange markets in these countries during the global financial crisis; 2) how interrelatedness of CEE financial markets is? Additionally, we execute to make the comparison in terms of relationships and volatility transmissions between pre and post 2007 financial crisis. In detail, this study will try to provide answers to the following primary research questions:
a. How are dynamics of volatility spillover between stock and foreign exchange market?
b. Does volatility transmission among stock market returns of Central and Eastern European countries vary from normal to turbulent periods?
c. How does the 2007 financial crisis affect volatility behavior of the foreign exchange rate and transmission among five countries in Central and Eastern Europe?
4
There are numerous articles on the literature of volatility spillover effects in different countries among financial markets. As far as CEE are concerned, the little work has been done in this area, this study distinguishes itself from the previous investigations:
- A lot of studies conduct in the developed market but for the emerging and frontier markets such as Hungary, Poland, the Czech Republic, Romania and Croatia, there are very few studies regarding volatility spillover effects among financial markets.
- Among the undertaken studies in CEE markets, there is not any studies executed on subprime financial crisis period. And the methodology adopted is not the same as that of our purposed study.
As per Yang et al. (2016), interdependence or contagion, different from linear correlation, results in causality relationships across financial markets. The conventional Pearson correlation is not appropriate for estimating dependence across financial markets with varying horizons of time. In this investigation, therefore, we employ the Exponential Generalized Autoregressive Conditional Heteroskedasticity EGARCH as a novel approach to account for volatility transmission among stock prices, exchange rates.
Furthermore, the topic has several important economic and finance implications for economic policymakers and investors. International portfolio managers and hedgers may adequately understand that how the stock market and foreign exchange market interrelated overtime. They may provide them a better forecasting of conditional correlations of the behavior of one market by capturing another market information. Policymakers should be aware of the information concerning the volatility spillover across stock and exchange markets in these countries in terms of financial markets integration.
3. Methodology
The multivariate EGARCH model
A rich empirical investigation exists on the examination of the asymmetric volatility spillovers between financial markets. In this study, we adopt the model of EGARCH to analyze a financial time series to monitor volatility spillover effects. The multivariate Exponential Generalized Autoregressive Conditional Heteroskedasticity (EGARCH) model is employed so as to examine
5
market interdependence and volatility transmission between stock markets in different countries.
The simple GARCH model enforces a symmetric effect of volatility (positive shocks) and is not able to capture asymmetric shocks (negative shocks) because of the conditional variance being a function of lagged residuals and not their signs (Jebran et al., 2017; Hung, 2018). The EGARCH specification is suitable for the study of volatility spillover effects because it is able to capture the contemporaneous correlation between the stock indices under study (Jane and Ding, 2009).
Additionally, the EGARCH modelling is applied to test whether the volatility spillover effects are asymmetric. Furthermore, Koutmos and Booth (1995) put forward that the model captures the asymmetric effect of negative and positive returns on the conditional variance and thus allows the news generated in one market to be evaluated in term of size and sign by the next market to trade.
Therefore, numerous empirical studies based on the EGARCH framework to specify volatility spillovers between different financial markets in different countries, (Koutmos and Booth, 1995;
Jebran et al., 2017; Okicic, 2014; Sok et al., 2010; Bhar and Nikolova, 2009; Mishra et al., 2007;
Yang and Doong, 2004; Elyasiani and Mansur, 2017 etc..), for instance. In this paper, we applied the EGARCH (1,1) model to examine the transmission mechanism of volatility between five financial markets in Central and Eastern Europe. The EGARCH specification Nelson (1991) may be represented as follows:
The conditional mean equation
5
i,t i,0 i, j j,t 1 i,t
j 1
R
, for i, j 1,5 (1)The conditional variance equation
5
2 2
i ,t i,0 i , j i j,t 1 i i,t 1
j 1
exp f (z ) ln( )
, for i, j 1,5 (2)The asymmetric transmission of shock from market jto market i
j j,t 1 j,t 1 j,t 1 j j,t 1
f (z ) | z | E | z | z , for i, j 1,5 (3) where relative asymmetry measured by the conditional covariance specification:
i, j,t i, j i,t j,t
, for i, j 1,5 and
i j
(4) The functionf
i generates sequences of zero mean, identically and independently distributed random variables by construction and allowing past standardized innovations to affect6
asymmetrically. The terms | zj,t 1 | E | z
j,t 1 |
in Equations (3) capture the size effect and the termjzj,t 1
measures the sign effect. When
j is negative it will increase the volatility by more than a positive realization of equal magnitude. Similarly, if the past absolute value ofz
t is greater than its expected value, the ongoing volatility will rise. This effect is referred to as leverage effect and is pointed out by (Nelson, 1991).We summarize each of the relevant terms in equations (1) - (4) in Table 1 Table 1 Description of Parameters Equations (1)-(4)
Explanation Parameters
The continuous compounding returns of the stock index
Ri,t
The constant
i,0
Extend for price spillover across markets
i, j
Stochastic error terms
i , t
Allow for autocorrelation in the return due to non-synchronous trading
(Hamao et al. 1990) i,j j,t 1
Standardised residuals assumed to be normal distribution with zero
mean and variance i, t2
i,t i,t
i,t
z
Size effect | zj,t | E | z
j,t |
Persistence of Volatility
iVolatility spillover from the respective stock market to the stock
market under consideration i , j
The constant level of volatility
i,0
Asymmetric effect of volatility
j
Correlation coefficient of standardised residuals
i , j
The conditional covariance
i, j,t
Note: persistence of volatility in which the unconditional variance is finite if j 1 and if j 1, then the unconditional variance does not exist and the conditional variance follows an integrated process of order one.
7 The term
5
i, j i j,t 1 j 1
f (z )
is defined in equation (2) and partial derivatives are:j j,t j,t j
f (z ) / z 1
, if zj0 and, f (z ) / zj j,t j,t 1 j, if zj0.
Asymmetric is demonstrated if j is negative and statistically significant. A significant positive
i , j
couples with a negative j implies that negative innovation in market j have a higher impact on the volatility of market i than positive innovations (Koutmos and Booth, 1995). Relative asymmetry is defined as
| 1
i| /(1
i)
. This quantity is greater than, equal to, or less than 1 for negative asymmetry, symmetry and positive asymmetry respectively (Bhar and Nikolova, 2009). The conditional correlations are presupposed to be constant over time (Bollerslev, 1990).With the assumption that the conditional joint distribution of the returns of the five markets are normal and given a sample of T observations, the log-likelihood function of a multivariate EGARCH model can be expressed as (Koutmos and Booth, 1995):
T
t 't t1 t
i 1
1 1
L NT ln 2 ln | S | S
2 2
(5)where N is the number of equations, is the parameter vector to be estimated,
'
t 1,t, 2,t, 3,t, 4,t, 5,t
is the 1 5 vector of innovations at time t ,
S
t is the 5 5 time varying conditional variance-covariance matrix with diagonal elements are given by equation (4).The log-likelihood function is estimated using the (Berndt et al., 1974) algorithm.
The procedures of this research shall be conducted in the following four stages (Tsay, 2005): i) conducting the unit root test for relevant variables to make sure that all variables are stationary series ii) identifying and estimating an autoregressive and moving average (ARMA) model for the mean equation, using the residuals of the mean equation to test for ARCH effect iii) estimating EGARCH model for volatility spillover and iv) checking the robustness of the estimation.
4. Data
8
The data set consists of daily closing stock and exchange rate prices for five Central and East European countries, covering the period from 1 April 2000 to 29 September 2017. The entire investigation period is subdivided into two sub-periods: the pre-crisis period, from 1 April 2000 to 29 August 2008; and the post-crisis period, from 1 September 2008 to 29 September 2017.
The whole period in the present study divides into pre and post-financial crisis periods on the basis of certain justifications. The reason for collecting daily data is to capture more precisely the information content of changes in stock prices and exchange rates than can be achieved with weekly or monthly data (Jebran and Iqbal, 2016), and to better capture the dynamics between variables (Agrawal et al., 2010).
The sample five European countries are Hungary, Poland, the Czech Republic, Romania and Croatia, and their stock indexes are: Budapest Stock Exchange BUX; Warsaw Stock Exchange WIG; Prague Stock Exchange PX; Bucharest Stock Exchange BET; and Zagreb Stock Exchange.
The national currencies of these countries are the Hungarian forint (HUF), Polish złoty (PLN), Czech koruna (CZK), Romanian leu (RON), and Croatian kuna (HRK), respectively.
The exchange rate series from the European countries are stated in U.S. dollars per local currency (note value of the dollar). Because stock markets operate for five trading days from Monday to Friday and foreign exchange markets operate for six trading days (excluding weekends and holidays), this research makes a common data series by adjusting the dates of both the stock and exchange rate indices.
The data for our empirical investigation is obtained from Bloomberg, accounted by the Department of Finance, Corvinus University of Budapest. The daily return data series are calculated as Ri,t = 100 x ln(Pi,t/Pi,t-1), where Pi,t is the price level of market i (i = 1 for the stock market and i = 2 for the foreign exchange rate) at time t.
5. Main results
5.1 The dynamics of volatility spillover between stock and foreign exchange markets:
empirical evidence from Central and East European countries
9
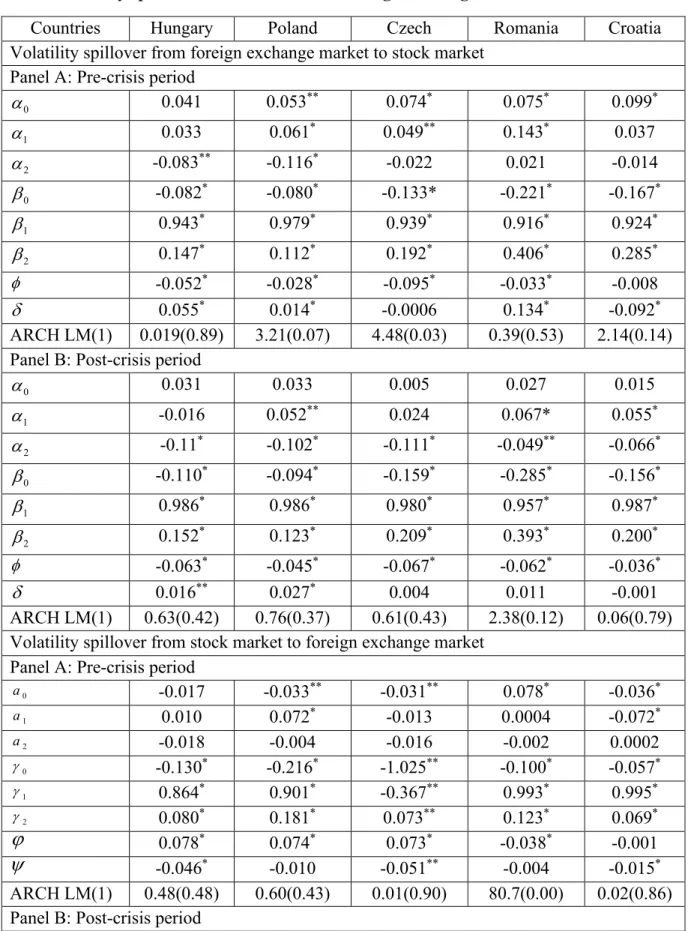
Table 2 Volatility spillover between stock and foreign exchange markets
Countries Hungary Poland Czech Romania Croatia
Volatility spillover from foreign exchange market to stock market Panel A: Pre-crisis period
0 0.041 0.053** 0.074* 0.075* 0.099*
1 0.033 0.061* 0.049** 0.143* 0.037
2 -0.083** -0.116* -0.022 0.021 -0.014
0 -0.082* -0.080* -0.133* -0.221* -0.167*
1 0.943* 0.979* 0.939* 0.916* 0.924*
2 0.147* 0.112* 0.192* 0.406* 0.285*
-0.052* -0.028* -0.095* -0.033* -0.008
0.055* 0.014* -0.0006 0.134* -0.092*
ARCH LM(1) 0.019(0.89) 3.21(0.07) 4.48(0.03) 0.39(0.53) 2.14(0.14) Panel B: Post-crisis period
0 0.031 0.033 0.005 0.027 0.015
1 -0.016 0.052** 0.024 0.067* 0.055*
2 -0.11* -0.102* -0.111* -0.049** -0.066*
0 -0.110* -0.094* -0.159* -0.285* -0.156*
1 0.986* 0.986* 0.980* 0.957* 0.987*
2 0.152* 0.123* 0.209* 0.393* 0.200*
-0.063* -0.045* -0.067* -0.062* -0.036*
0.016** 0.027* 0.004 0.011 -0.001
ARCH LM(1) 0.63(0.42) 0.76(0.37) 0.61(0.43) 2.38(0.12) 0.06(0.79) Volatility spillover from stock market to foreign exchange market
Panel A: Pre-crisis period
a0 -0.017 -0.033** -0.031** 0.078* -0.036*
a1 0.010 0.072* -0.013 0.0004 -0.072*
a2 -0.018 -0.004 -0.016 -0.002 0.0002
0 -0.130* -0.216* -1.025** -0.100* -0.057*
1 0.864* 0.901* -0.367** 0.993* 0.995*
2 0.080* 0.181* 0.073** 0.123* 0.069*
0.078* 0.074* 0.073* -0.038* -0.001
-0.046* -0.010 -0.051** -0.004 -0.015*
ARCH LM(1) 0.48(0.48) 0.60(0.43) 0.01(0.90) 80.7(0.00) 0.02(0.86) Panel B: Post-crisis period
10
a0 0.011 0.016 0.017 0.011 0.014
a1 -0.026 -0.04** -0.005 -0.008 -0.032
a2 -0.001 -0.025 0.015 -0.023** -0.018
0 -0.046* -0.062 -0.077* -0.050* -0.047
1 0.996* 0.994* 0.992* 0.993* 0.996*
2 0.058* 0.078* 0.091* 0.057* 0.047*
0.025* 0.028* 0.019* 0.0211* 0.029*
-0.016* -0.022* -0.021* -0.012* -0.007
ARCH LM(1) 0.08(0.76) 1.25(0.26) 0.34(0.55) 0.14(0.70) 4.49(0.03) Note: ** denotes the level of significance at 5%, * indicates p < 1%. Numbers in parentheses are probability.
Source: calculations of the author
Our empirical evidence shows that there is a bidirectional volatility spillover between stock and foreign exchange markets in Hungary in all periods, and in Poland in the post-crisis period. The results also reveal unidirectional volatility spillover in Croatia in the pre-crisis period, and from the stock market to the exchange market in the Czech Republic during two periods. In the post- crisis period, the two financial markets show the absence of volatility spillover in Croatia. The spillovers are asymmetric in nature in all financial markets. Volatility spillover from stock returns to exchange rates decreased after the crisis period. The volatility persistence indicates that there was volatility persistence in all series in all periods; in general, the persistence of exchange market volatility was found to be greater than stock market volatility.
Our findings have several important economic and financial implications for economic policymakers and investors. First, international portfolio managers and hedgers may be better able to understand how the two financial markets interrelate over time, which might benefit them in forecasting the behaviour of one market by capturing the other market’s information. Second, the information concerning the nature of volatility transmission across stock and exchange markets in a country could be important for policymakers and decision-makers from an economic stability perspective as financial market integration through exchange rates implies financial sector integration. Third, for investors, the findings could be particularly important when they aim to compile an efficient portfolio, as they can apply these results in reducing their risk, increasing their returns, and making decisions in the selected markets.
11
5.2 Does volatility transmission between stock market returns of Central and Eastern European countries vary from normal to turbulent periods?
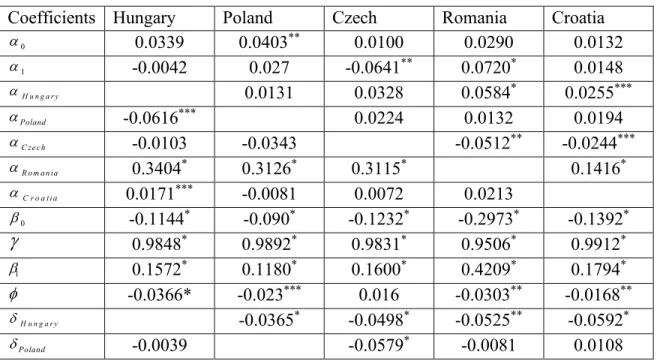
The volatility transmission mechanism is asymmetric, bad news in a given market increase volatility in the next market to trade considerably more than positive innovations for the whole period. However, these results exclude the Croatian stock market in the pre-crisis period and the Czech Republic stock market in the post-crisis period. The results reveal that volatility spillover varies from normal to turbulent periods. We found evidence of price spillovers of the intraregional linkages among the stock price movements in the five Central and Eastern European countries. For the second moment interactions, the results highlight certain interesting findings that the stock markets were more substantially integrated into a crisis situation. In addition, the persistence of volatility spillovers among the stock markets increases and the financial stock markets become more integrated after the crisis period.
Table 2 Volatility spillover in the pre-crisis period
Coefficients Hungary Poland Czech Romania Croatia
0 0.0578*** 0.0676** 0.0908* 0.1050* 0.1007*
1 -0.0271 0.1063** 0.0350 0.1891* 0.0384
H u n g a r y
-0.0249 -0.0168 -0.0030 0.0505***
Poland
0.0737*** 0.0341 0.0050 0.0269
C ze c h
0.0439 0.0095 0.0541*** -0.0324
R o m a n ia
-0.0047 -0.0217 0.0344 0.0756*
C r o a t i a
-0.0121 0.0094 -0.0098 -0.0034
0 -0.0183 -0.0572* -0.0980* -0.1768* -0.1992*
0.9204* 0.9753* 0.9360* 0.9353* 0.8764*
1 -0.0979* 0.0909* 0.1626* 0.3230* 0.3549*
-0.0625* -0.0203*** -0.0786* -0.0246** -0.0096
H u n g a r y
-0.0208 0.0163 0.0026 0.0047
P o l a n d
0.0122 -0.0358** -0.0810* -0.0006
C z e c h
-0.0284** -0.0125 0.0143 -0.0906*
R o m a n ia
-0.0120 -0.0027 -0.0510* -0.0103
C r o a t i a
0.0025 0.0023** 0.0039* -0.0080
ARCH test 0.180(0.671) 2.652(0.103) 3.146(0.076) 0.717(0.397) 0.145(0.702) Notes: Numbers in parentheses are the probability. *, **, *** denote significance at the 1%, 5% and 10% level respectively.
Source: calculations of the authors
12
From the results above, our study has several important economic and financial implications for economic policymakers and investors. In terms of price volatility, the increase in co-movement is significant since a global market shock might create excessive fluctuation in emerging markets as they are more vulnerable to global shocks, and to lower commodity prices, they can experience a sudden acceleration of systematic risk through deteriorations in both the capital and currency crisis (Kim et al., 2015). Also, the process of globalization and financial liberalization is the primary factor to promote further international linkages (Xuan Vinh and Ellis, 2018).Therefore, investors should take into account of the price movements from the stock markets over the region in their investment strategies. Moreover, Singhal and Ghosh (2016) suggest that investors tend to diversify their investment portfolio and hedging in order to maximize returns and minimize risks. Elyasiani and Mansur (2017) also provide a valuable channel of diversification for investors at the time of market distress as well as in making optional investment decision. Regarding volatility spillover, the integrations among financial markets suggest that investors would have low diversification opportunities. The research of (Ahmed and Huo, 2018) document that market integration will kindly provide several new opportunities to accelerate productivity and economic growth; new economic partnership will extend the region’s global competitiveness in attracting investment.
Investors in the five Central and Eastern European countries can also consider diversifying their investment strategies by following the integration of different financial markets.
Table 3 Volatility spillover in the post-crisis period
Coefficients Hungary Poland Czech Romania Croatia
0 0.0339 0.0403** 0.0100 0.0290 0.0132
1 -0.0042 0.027 -0.0641** 0.0720* 0.0148
H u n g a r y
0.0131 0.0328 0.0584* 0.0255***
Poland
-0.0616*** 0.0224 0.0132 0.0194
C ze c h
-0.0103 -0.0343 -0.0512** -0.0244***
R o m a n ia
0.3404* 0.3126* 0.3115* 0.1416*
C r o a t i a
0.0171*** -0.0081 0.0072 0.0213
0 -0.1144* -0.090* -0.1232* -0.2973* -0.1392*
0.9848* 0.9892* 0.9831* 0.9506* 0.9912*
1 0.1572* 0.1180* 0.1600* 0.4209* 0.1794*
-0.0366* -0.023*** 0.016 -0.0303** -0.0168**
H u n g a r y
-0.0365* -0.0498* -0.0525** -0.0592*
Poland
-0.0039 -0.0579* -0.0081 0.0108
13
C z e c h
-0.0177 0.0053 0.0141 0.0572*
R o m a n ia
-0.0378* -0.0326* -0.0064 -0.0521*
C r o a t i a
-0.0148 0.0141*** -0.0110 -0.0285***
ARCH test 0.179(0.672) 0.547(0.459) 0.716(0.397) 0.372(0.541) 0.156(0.692)
Notes: Numbers in parentheses are the probability. *, **, *** denote significance at the 1%, 5% and 10% level respectively.
Source: calculations of the authors.
Furthermore, policymakers should consider previous market condition and integration of financial markets before implementing policy on the stock market because there are considerable impacts on the financial performance of the markets and the subprime financial crisis spillover from one market to other markets (Jebran et al., 2017).
5.3 Volatility behavior of the foreign exchange rate and transmission among Central and Eastern European countries
The asymmetric volatility spillover is brilliantly captured when employing the multivariate EGARCH model to delineate the volatility transmission between the times series before and after the global financial crisis.
Table 4 Volatility spillover in the pre-crisis period
Coefficients USDCZK USDHRK USDHUF USDPLN USDRON
0 0.0613* -0.0370* -0.0341*** -0.0527* 0.070*
1 -0.0356 -0.1268* -0.0817** -0.0447* -0.0136
USDCZK
0.0596*** 0.1012* 0.1000* 0.0198***
USDHRK
0.0494*** 0.0022 -0.0106 0.0051
USDHUF
-0.0141 0.0481*** 0.0716* -0.0056
USDPLN
0.0239 -0.038 0.0690*** -0.0109
USDRON
0.0046 -0.0047 -0.0364 0.0110
0 -0.0517* -0.0422* -0.1467* -0.2050* -0.0957*
0.9917* 0.9972* 0.8543* 0.9104* 0.9910*
1 0.0597* 0.0527* 0.0822* 0.1648* 0.1077*
-0.0466* -0.0180 0.0527* 0.0438** -0.0639*
USDCZK
-0.0203*** -0.0311 -0.0143 -0.0069
USDHRK
-0.0003 -0.0490*** -0.0531* 0.0563*
USDHUF
0.0416* 0.0134 0.1074* 0.0533*
14
USDPLN
0.0194*** 0.0325* 0.1056* -0.0369*
USDRON
-0.0001 0.0036 0.0244 -0.0123
ARCH test 0.414(0.519) 0.446(0.504) 0.660(0.416) 1.409(0.235) 71.866(0.00) Source: Authors’ calculations
Notes: Numbers in parentheses are the probability. *, **, *** denote significance at the 1 per cent, 5 per cent and 10 per cent level respectively
The originality of this study involves contributing to the existing literature of volatility spillover among Central and Eastern European emerging economies in the pre and post-subprime financial crisis period.
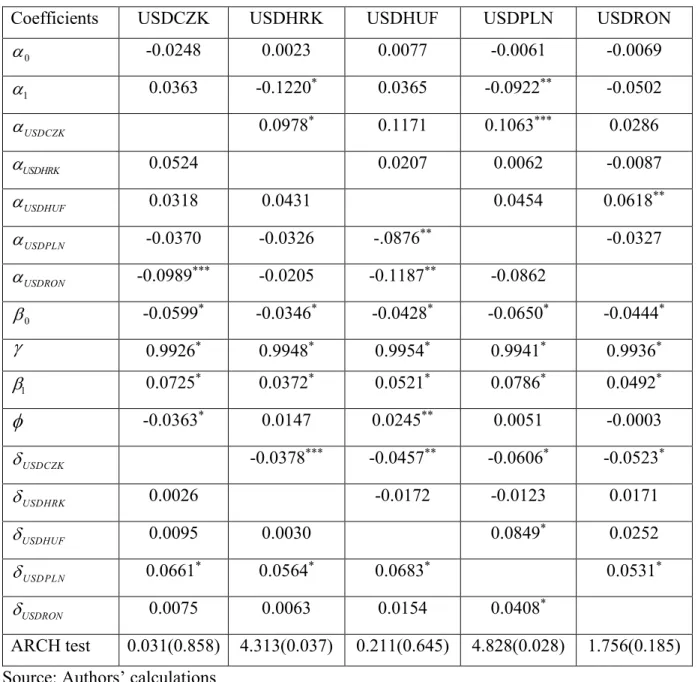
Our results highlight that the return spillovers exhibit more significant in the pre-crisis period than in the post-crisis period in the CEE-5 countries. The foreign exchange markets become more independent in a crisis situation. Similarly, the volatility spillover between the foreign exchange markets decreases dramatically and financial markets have not been transmitted during the crisis period. Results got in this work are in line with the majority of the prior studies such as (Caporale at al. 2016; Antonakakis, 2012) and contrast with the international evidence presented by (Bubak et al. 2011; Fidrmuc and Horvath, 2008) who document the existence of volatility spillovers between the Central European foreign exchange markets on an intraday basis. Also, we find that positive shocks generate more volatility spillover than negative shocks of the same magnitude, it is similar to (Barunik et al. 2017). Therefore, for example, investors can use movement in Hungarian Forint exchange rate to investigate the rest of the four foreign exchange markets movement and vice versa.
Focusing on return and volatility behavior of the foreign exchange markets, we also found that Polish and Romania exchange markets influence other markets, especially during turmoil period.
This result raises a question related to the role of market consensus versus information during the period of stress. It would be tested by future researchers using new or more enhanced models to capture the effects and predictions of volatility behavior during the extreme turbulent periods.
The results provide significant implications for money managers involved in establishing dynamic portfolios and hedging strategies are effortless and diversified. The extended fluidity and transparency will be furnished by the integration of capital markets increased by a single currency in the equity and other markets, domestic and foreign, leading to a more efficient allocation of resources. (Laopodis, 1998) put forward that aside from the elimination of exchange rate risk,
15
under the condition of the expected low levels of inflation and interest rates should boost the growth of economics, namely economic policies and different social policies would become more coordinated, result in improvements in productivity and labor mobility across nations. In addition, Carsamer (2016) reports changes in trade balance plays a critical role in volatility transmission, exchange rate co-movement and accelerating currency risk. These conveniences will make the CEE-5 currencies more attractive, such as greater volume and liquidity to contribute to the value of the firm.
Table 5 Volatility spillover in the post-crisis period
Coefficients USDCZK USDHRK USDHUF USDPLN USDRON
0 -0.0248 0.0023 0.0077 -0.0061 -0.0069
1 0.0363 -0.1220* 0.0365 -0.0922** -0.0502
USDCZK
0.0978* 0.1171 0.1063*** 0.0286
USDHRK
0.0524 0.0207 0.0062 -0.0087
USDHUF
0.0318 0.0431 0.0454 0.0618**
USDPLN
-0.0370 -0.0326 -.0876** -0.0327
USDRON
-0.0989*** -0.0205 -0.1187** -0.0862
0 -0.0599* -0.0346* -0.0428* -0.0650* -0.0444*
0.9926* 0.9948* 0.9954* 0.9941* 0.9936*
1 0.0725* 0.0372* 0.0521* 0.0786* 0.0492*
-0.0363* 0.0147 0.0245** 0.0051 -0.0003
USDCZK
-0.0378*** -0.0457** -0.0606* -0.0523*
USDHRK
0.0026 -0.0172 -0.0123 0.0171
USDHUF
0.0095 0.0030 0.0849* 0.0252
USDPLN
0.0661* 0.0564* 0.0683* 0.0531*
USDRON
0.0075 0.0063 0.0154 0.0408*
ARCH test 0.031(0.858) 4.313(0.037) 0.211(0.645) 4.828(0.028) 1.756(0.185) Source: Authors’ calculations
16
Notes: Numbers in parentheses are the probability. *, **, *** denote significance at the 1per cent, 5 per cent and 10 per cent level respectively.
On the policy implication, systematically understand the fact that volatility spillover is marginal regionally, policymakers should look at the high degree of trade openness because it does not only increase the foreign exchange movement, but also increase currency risk exposure. For central bank interventions, international trade, risk management and portfolio diversification, the volatility spillover between five foreign exchange markets may provide them benefit in predicting the behavior of one market by having the other market information. Moreover, the interest rate is still helpful for predicting exchange rates in the long term and provide a remarkable tool to hedge the risk of variation from foreign exchange market, and the local factor may have a prominent role in specifying foreign exchange markets interdependence.
6. References
Antonakakis, N. (2012). Exchange return co-movements and volatility spillovers before and after the introduction of euro. Journal of International Financial Markets, Institutions and Money, 22(5), 1091-1109.
Aloui, R., Aïssa, M. S. B., and Nguyen, D. K. (2013). Conditional dependence structure between oil prices and exchange rates: a copula-GARCH approach. Journal of International Money and Finance, 32, 719-738.
Agrawal, G., Srivastav, A. K. and Srivastava, A. (2010). A study of exchange rates movement and stock market volatility. International Journal of Business and Management, 5(12), 62.
Ahmed, A. D. and Huo, R. (2018). China–Africa Financial Markets Linkages: Volatility and Interdependence. Journal of Policy Modeling, 1-25.
Bubák, V., Kočenda, E., and Žikeš, F. (2011). Volatility transmission in emerging European foreign exchange markets. Journal of Banking Finance, 35(11), 2829-2841.
Benazić, M., and Tomić, D. (2014). The evaluation of fiscal and monetary policy in Croatia over a business cycle. Zbornik radova Ekonomskog fakulteta u Rijeci: časopis za ekonomsku teoriju i praksu, 32(1), 75-99.
Bubak, V. (2009). Distribution and Dynamics of Central-European Exchange Rates: Evidence from Intraday Data. Finance a Uver: Czech Journal of Economics Finance, 59(4).
Bhar, R. and Nikolova, B. (2009). Return, volatility spillovers and dynamic correlation in the BRIC equity markets: An analysis using a bivariate EGARCH framework. Global Finance Journal, 19(3), 203-218.
17
Bollerslev, T. (1990). Modelling the coherence in short-run nominal exchange rates: a multivariate generalized ARCH model. The review of economics and statistics, 498-505.
Berndt, E. R., Hall, B. H., Hall, R. E. and Hausman, J. A. (1974). Estimation and inference in nonlinear structural models. In Annals of Economic and Social Measurement, 3 (4), 653-665.
Caporale, G.M., Spagnolo, F., and Spagnolo, N. (2016). Exchange Rates and Macro News in Emerging Markets (No. 5816). CESifo Group Munich.
Carsamer, E. (2016). Volatility transmission in African foreign exchange markets. African Journal of Economic and Management Studies, 7(2), 205-224.
Chkili, W., Aloui, C. and Nguyen, D. K., (2012). Asymmetric effects and long memory in dynamic volatility relationships between stock returns and exchange rates. Journal of International Financial Markets, Institutions and Money, 22, 738-757.
Elyasiani, E. and Mansur, I. (2017). Hedge fund return, volatility asymmetry, and systemic effects:
A higher-moment factor-EGARCH model. Journal of Financial Stability, 28, 49-65.
Fidrmuc, J., and Horváth, R. (2008). Volatility of exchange rates in selected new EU members:
Evidence from daily data. Economic Systems, 32(1), 103-118.
Hassan, S. A., Malik, F. (2007). Multivariate GARCH modeling of sector volatility transmission. The Quarterly Review of Economics and Finance, 47(3), 470-480.
Hamao, Y., Masulis, R. W., and Ng, V. (1990). Correlations in price changes and volatility across international stock markets. The review of financial studies, 3(2), 281-307.
Hsing, Y. (2016). Determinants of the Hungarian forint/US dollar exchange rate. Theoretical and Applied Economics, 23(1), 163-170.
Jebran, K., and Iqbal, A. (2016). Dynamics of volatility spillover between stock market and foreign exchange market: evidence from Asian Countries. Financial Innovation, 2(1), 3.
Jebran, K., Chen, S., Ullah, I., and Mirza, S. S. (2017). Does volatility spillover among stock markets varies from normal to turbulent periods? Evidence from emerging markets of Asia. The Journal of Finance and Data Science, 3(1-4): 20-30.
Jane, T. D., and Ding, C. G. (2009). On the multivariate EGARCH model. Applied Economics Letters, 16(17), 1757-1761.
Koutmos, G., and Booth, G. G. (1995). Asymmetric volatility transmission in international stock markets. Journal of international Money and Finance, 14(6), 747-762.
Kim, B. H., Kim, H.and Lee, B. S. (2015). Spillover effects of the US financial crisis on financial markets in emerging Asian countries. International Review of Economics Finance, 39: 192- 210.
Laopodis, N. T. (1998). Asymmetric volatility spillovers in deutsche mark exchange rates. Journal of Multinational Financial Management, 8(4), 413-430.
Mishra A. K., Swain N. and Malhotra D. K. (2007). Volatility Spillover Between Stock and Foreign Exchange Markets: Indian Evidence. International Journal of Business 12 (3), 343- 359.
18
Nath Mukherjee, K. and Mishra, R. K. (2010). Stock market integration and volatility spillover:
India and its major Asian counterparts. Research in International Business and Finance, 24(2), 235-251.
Nishimura, Y., Men, M. (2010). The paradox of China's international stock market co- movement: Evidence from volatility spillover effects between China and G5 stock markets. Journal of Chinese Economic and Foreign Trade Studies, 3(3), 235-253.
Nelson, D. B. (1991). Conditional heteroskedasticity in asset returns: A new approach. Econometrica: Journal of the Econometric Society, 347-370.
Okičić, J. (2014). An empirical analysis of stock returns and volatility: the case of stock markets from Central and Eastern Europe. South East European Journal of Economics and Business, 9(1), 7-15.
Sok-Gee, C., Karim, M. A. and Karim, M. A. (2010). Volatility spillovers of the major stock markets in ASEAN-5 with the US and Japanese stock markets. International Research Journal of Finance and Economics, 44, 161-72.
Tsay, R. S. (2005). Analysis of financial time series (Vol. 543). John Wiley Sons.
Xuan Vinh, V. and Ellis, C. (2018). International financial integration: Stock return linkages and volatility transmission between Vietnam and advanced countries. Emerging Markets Review, 36, 19-27.
Yang, L., Cai, X. J., Zhang, H., Hamori, S. (2016). Interdependence of foreign exchange markets:
A wavelet coherence analysis. Economic Modelling, 55, 6-14.
Yang S. and Doong S. (2004). Price and Volatility Spillovers Between Stock Prices
and Exchange Rates: Empirical Evidence from the G-7 Countries. International Journal of Business and Economics, 3 (2), 139-153.
Yilmaz, K. (2010). Return and volatility spillovers among the East Asian equity markets. Journal of Asian Economics, 21(3), 304-313.
Yang, S. P. (2017). Exchange rate dynamics and stock prices in small open economies: Evidence from Asia-Pacific countries. Pacific-Basin Finance Journal, 46, 337-354.
Zhou, X., Zhang, W., and Zhang, J. (2012). Volatility spillovers between the Chinese and world equity markets. Pacific-Basin Finance Journal, 20(2), 247-270.
19 7. Own publications
Conference papers
Hung, N.T. (2017). An empirical analysis of Euro Hungarian Forint exchange rate volatility using GARCH. Challenges in National and International Economic Policies. University of Szeged, Doctoral School in Economics, Szeged, pp. 57–67
Hung, N.T. (2018). Dynamics of Volatility Spillover Between Stock and Foreign Exchange Market: Empirical Evidence from Central and Eastern European Countries, ECMS 2018 Proceedings Edited by: Lars Nolle, Alexandra Burger, Christoph Tholen, Jens Werner, Jens Wellhausen European Council for Modeling and Simulation. doi: 10.7148/2018-0027 Journals
Hung, N. T. (2017). An Empirical Test on Linkage Between Foreign Exchange Market and Stock Market: Evidence from Hungary, Czech Republic, Poland and Romania. European Scientific Journal, ESJ, 13(31). DOI: http://dx.doi.org/10.19044/esj.2017.v13n31p25
Hung, N. T. (2018). Volatility Behaviour of the Foreign Exchange Rate and Transmission Among Central and Eastern European Countries: Evidence from the EGARCH Model. Global Business Review, 0972150918811713.
Hung, N.T. (2019). Return and volatility spillover across equity markets between China and Southeast Asian countries. Journal of Economics, Finance and Administrative Science, Vol.
24 Issue: 47, pp.66-81, DOI: https://doi.org/10.1108/JEFAS-10-2018-0106
Hung, N. T. (2019). Equity market integration of China and Southeast Asian countries: further evidence from MGARCH-ADCC and wavelet coherence analysis. Quantitative Finance and Economics, 3(2), 201-220.
Hung, N.T (2019). Interdependence of oil prices and exchange rates: Evidence from copula- based GARCH model. AIMS Energy, 7(4): 465-482.
Hung, N.T (2019). An analysis of CEE equity market integration and their volatility spillover effects. European Journal of Management and Business Economics, Vol. ahead-of- print No. ahead-of-print. https://doi.org/10.1108/EJMBE-01-2019-0007
Hung, N.T (2019). Dynamics of volatility spillover between stock and foreign exchange market:
empirical evidence from Central and Eastern European Countries. ECONOMY AND FINANCE: ENGLISH-LANGUAGE EDITION OF GAZDASÁG ÉS PÉNZÜGY, 6(3), 244- 265.
Hung, N. T. (2019). Spillover Effects Between Stock Prices and Exchange Rates for the Central and Eastern European Countries. Global Business Review, 0972150919869772