the Visegrád 4 countries and Romania*
* Imre Dobos(corresponding author) Budapest University of Technology and Economics, Hungary E-mail: dobos@kgt.bme.hu
Gábor Michalkó Corvinus University of Budapest;
Geographical Institute, Research Centre for Astronomy and Earth Sciences, Hungary E-mail: gabor.michalko@uni-
corvinus.hu E-mail:
michalko.gabor@csfk.mta.hu Péter Sasvári University of Public Service,
Hungary E-mail: sasvari.peter@uni-nke.hu Keywords:
scientometrics, economics and management, multivariate statistics, Scopus
The study analyses the publication performance of economics and management researchers in the Visegrád 4 countries (Czech Republic, Poland, Hungary, and Slovakia) and Romania based on their publications in the Scopus database. First, 150 researchers are selected from each country, who are then further selected according to their most recent affiliation and research area. Using a 449-item dataset, six multivariate statistical analyses (e.g. principal component analysis and cluster analysis) are carried out to examine the relationships among the seven variables (e.g. number of publications, citations, and co-authors) that characterize the performance of the publication activity of researchers. The results highlight the excellence criteria for the publication performance of economics and management researchers from the Visegrád 4 countries and Romania as well as their ranking position.
*An earlier version of the paper was published in the Statisztikai Szemle/Statistical Review (2020) 98 (8) pp.
981–1000., in Hungarian. English title: ‘A bridge too far? Comparison of economics and management researchers’
publication performance in Central and Eastern Europe’.
Introduction
The European academic community commemorated the 20th anniversary of the launch of the Bologna Process with a number of consultations and evaluative analyses in 2019.1 Although opinions on the results of the initiative to create the European Higher Education Area have been divided (Hrubos 2019, Zahavi–
Friedman 2019), the direction is clear: university-related training and research activities need to be made efficient, interoperable, and competitive. In order to strengthen this aim, following the Gothenburg Social Summit in May 2018, the European Commission published a Communication entitled ‘Building a stronger Europe: the role of youth, education and culture policies’ outlining the need to set up so-called European universities issuing European degrees.2 Just as Europe’s past and present, its future is undoubtedly intertwined with the success of knowledge creation and development, in which transnational networks play a crucial role.
Following the principle of subsidiarity in the European Union, higher education is a competence of member states; hence, an indispensable component of the recipe for success is the proportion of each country’s gross domestic product (GDP) spent on research & development (R&D) activities (Egri–Tánczos 2018). Although the longitudinal analysis by Vinkler (2008: 253) does not show a close correlation between annual GDP and knowledge production embodied in publications, the author found that ‘rich countries are in the position to spend more and poor countries can afford to spend less money on science’. This is supported by the complex investigation of Dima et al. (2018) that found that R&D expenditure can raise the competitiveness of EU member states significantly.
In 2018, 2.03 percent of the average GDP of the EU28 was spent on R&D, with the highest proportion in Sweden with 3.31 percent and the lowest in Romania with 0.51 percent.3 In this context, the link between member state subsidies and academic success is strengthened by the fact that, according to the World University Rankings 2020 based on the 2018/2019 database of the Times Higher Education (THE)4 magazine, several universities in Sweden can be found among the top 200 universities and 11 of them in the top 500, while only two universities in Romania are on the list of the first 1000 institutions, located only in the 801–1000 segment.
Considering that science is a long-term return on investment, neither per capita GDP nor R&D value growth directly induces a more favourable position on university lists. However, the development of a country strongly influences the scientometrics elements of progress (Vinkler 1992, 2018). Although the adequacy of the methodology of university rankings divides the scientific community (Millot
1 https://ec.europa.eu/education/policies/higher-education/bologna-process-and-european-higher-education- area_hu.
2 https://ec.europa.eu/education/education-in-the-eu/european-education-area/european-universities- initiative_hu.
3 https://stats.oecd.org/Index.aspx?DataSetCode=MSTI_PUB.
2015, Olcay–Bulu 2017), there is no chance of remaining competitive without scientific research results being published in recognized journals. Moreover, as is the case in sports, it is also advisable to compare higher education institutions in different ‘leagues’; if the aim is to advance scientific knowledge, it is worth analysing the performance of countries with similar capabilities and development trajectories.
The performance of the Hungarian academic sphere – primarily up until the regime change in 1989 and 1990 – should be compared with the Visegrád 4 countries (the Czech Republic, Poland, Hungary, and Slovakia) and Romania, which were influenced by former Soviet Union and joined the European Union in 2004 and 2007, respectively (Mező 2001, Lampertné 2010, Kocziszky et al. 2018). Thus, the territorial scope of the present study covers the Czech Republic, Poland, Hungary, Slovakia, and Romania. The share of GDP expenditure on R&D in the countries surveyed never reached the EU28 average in 2018 (Müller-Frączek 2019) (the Czech Republic had the highest rate of 1.93 percent), and their universities are not ranked in the top 400 institutions in the the World University Rankings (according to the list published in 2020, Charles University in Prague and Semmelweis University in Budapest are ranked in the 401–500 range).
The time dimension of this study covers the publications appearing in the Scopus database published between 2009 and 2018. Using data mining and mathematical statistics, we examine the key factors of a successful publishing strategy for the economics research community in the Visegrád 4 countries and Romania, on the basis of which criteria for researchers can be grouped. For the Visegrád 4 and Romanian institutions to become successful participants in the global higher education sector, they need to cross a metaphorical bridge well protected by their competitors, and our study might help in answering the question of how far that bridge is. In particular, we aim to answer two essential questions:
– What does the economics research community of the Visegrád 4 countries and Romania consider to be key factors in a successful publishing strategy?
– What criteria can be used to group researchers in terms of their publication performance?
The remainder of the paper is divided into the following sections. Higher education in Hungary and abroad outlines the ranking of the higher education institutions of the Visegrád 4 countries and Romania in international lists. The section dealing with data illustrates the difficulties of compiling the dataset and discusses who can be considered to be an economics researcher. Statistical variables are also presented in this section. The next section contains the statistical analyses, which map the relationships between the variables using correlation analysis and principal component analysis, examine multicollinearity, estimate collinear variables using linear regression, and map causal relationships using partial correlation. The following section attempts to group researchers using cluster analysis. In the section after that, by ranking the researchers of each country using the TOPSIS method, we
examine how effectively they are at publishing relative to each other. The relationship between the countries is also illustrated using cumulative rankings.
Finally, the last section summarizes the findings of the study.
Higher education in Hungary and abroad: The fields of economics and management
Measuring academic excellence may be an even more complex process than generating excellence itself. Exploring the contexts and mechanisms of action is partly the task of science management and partly that of scientometrics, and stakeholders are increasingly expecting to be ranked favourably on lists of excellence. The World University Rankings list is one of the more prestigious lists that assess the academic performance of higher education institutions. Although its methodology is debated along with other rankings with similar themes, it has become embedded in public thinking. In 2020, the list of 1397 universities and colleges in 92 countries globally included institutions from the Czech Republic (17), Poland (14), Hungary (8), Romania (9), and Slovakia (4), as shown in Table 1.
Hungary is represented in the World University Rankings list by the following universities: Semmelweis University, Eötvös Loránd University, University of Debrecen, University of Pécs, University of Szeged, Budapest University of Technology and Economics, Corvinus University of Budapest, and Szent István University. This ranking offers an opportunity to evaluate not only individual institutions, but also their disciplines.
Table 1 Global ranking of universities in Visegrád 4 countries and Romania,
by field, 2020
Ranking Czech Republic Hungary Poland Romania Slovakia Economics and econometrics (34 institutions)
401– 500 1 0 0 0 0 601– 800 1 0 2 0 0
801–1000 2 3 1 2 0
1000+ 8 3 5 2 4
Business and management (45 institutions)
601– 800 2 1 2 0 0
801–1000 2 3 1 2 0
1000+ 11 3 9 5 4
Accounting and finance (30 institutions)
601– 800 1 1 2 0 0
801–1000 2 3 0 2 0
1000+ 8 3 3 2 3
Source: THE World University Rankings
(https://www.timeshighereducation.com/world-university-rankings/2020/world- ranking#!/).
Examining disciplines in economics in the Visegrád 4 countries and Romania, the Czech Republic’s ranking superiority can be perceived. Indeed, although Charles University in Prague manages to be ranked in the range of 401–500 in the field of economics and econometrics, most institutions in the region fall out of the top 1000. Among Hungarian universities, only Eötvös Loránd University is included in the range of 601–800 in the fields of business and management and accounting and finance.
Data
When compiling the dataset, even at the beginning of the study, we were faced with the problem of which criteria to choose for selecting researchers from the Visegrád 4 countries and Romania in Scopus. First, we used the subroutine of the SciVal database. As we only wanted to select experts in the field of economics and management, we narrowed the dataset from the SCImago database to three disciplines: business, management, and accounting; decision sciences; and economics, econometrics and finance.
Only researchers who have already published in at least one of these three disciplines (i.e. are included in the Scopus database) were considered for the screening. The next question was what parameter to take outside the field demarcation, on the basis of which we ranked researchers by country. Outside the disciplines, the number of papers published in the three areas was chosen as the filter variable. We could determine this because Scopus assigns to a researcher the discipline on which he/she has already published. This function is based on the scientific classification of journals in the SCImago database. As SciVal can only highlight 150 researchers per country, this maximum number was taken into account. In other words, the starting database included 750 researchers active in the three disciplines from the five countries. However, we later realized that this approach was not completely reliable.
We had to further narrow the original database of 750 researchers, as there were several problems understanding whether the researchers were actually employed in the country, were only working there, or indeed were working in economics-related fields. First, the original database we compiled from Scopus included those researchers in the list of 150 researchers of a given country who were ever (even temporarily) employed in that country. Hence, when their affiliation was geographically identified, it was included in their publications. Therefore, to find out where the researchers had their actual jobs, the Scopus profile of the stakeholders was used.
Second, to decide whether the researcher was actually working in the field of economics, we set the three disciplines with the ‘or’ logical operation during the sorting stage. For example, if an economics scientist published an article with a mathematician, SciVal’s search engine would also add the mathematician into the
database. Therefore, we hypothesized that economics researchers are likely to have published in any of the ranked journals of the three chosen disciplines together with the field of social sciences at least three times. Although we could have taken this as a logical operation, too, it would have narrowed the dataset much further.
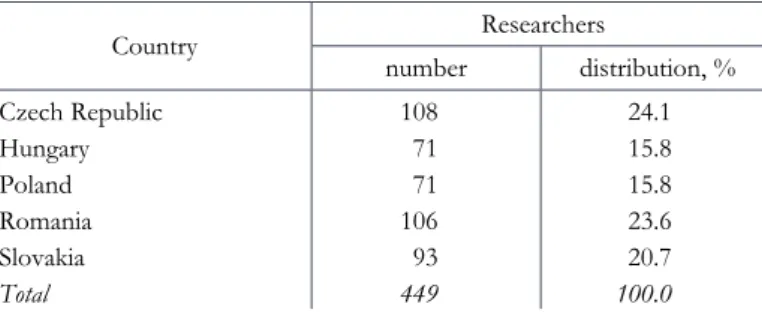
In summary, researchers who, according to Scopus, were employed in that country at the time of the survey and have already published papers in the three journals in the four disciplines were included in the final dataset. Therefore, our original dataset of 750 researchers fell to 449 after narrowing, as shown in Table 2.
Table 2 Number and distribution of researchers in the dataset, by country, 2019
Country Researchers
number distribution, % Czech Republic 108 24.1
Hungary 71 15.8
Poland 71 15.8
Romania 106 23.6
Slovakia 93 20.7
Total 449 100.0
Source: own compilation based on the Scopus database.
The distribution in Table 2 shows that the researchers in each country are unevenly included in the dataset. However, this does not affect the validity of our findings from our analyses because there is no need to assume uniformity. Next, we measured performance from Scopus through seven variables freely available on researchers’ datasheets. The variables also included publication, reference, and co- authorship indicators. These seven variables are as follows (with abbreviations in parentheses):
– number of co-authors (C-A), – number of publications (DOC), – number of citations (CIT), – the Hirsch index (H-I),
– number of publications between 2009 and 2018 (DOC09-18), – number of citations between 2009 and 2018 (CIT09-18), – the Field-Weighted Citation Impact (FWCI) indicator.
The first four of these variables contain the scientist’s results achieved in his/her entire research career, while the last three take into account the work of the past 10 years at the time of data collection (25 November 2019). Of the variables, only the FWCI needs more explanation (the rest, including the Hirsch index, are well known). The FWCI shows the degree of citations of a given discipline in the author’s publications. If the FWCI value is greater than 1, there are more citations to the publication than the average of the given discipline. The calculation algorithm
of the FWCI index is openly available from Elsevier (2019). The actual results and calculation schemes can be used freely from Scopus (Purkayastha et al. 2019).
Statistical analysis
Using our 449-item dataset for the seven variables, we performed six analyses to examine the relationships among them. First, we mapped the stochastic relationships among the variables by analysing the correlation matrix. Then, by applying principal component analysis, we reduced the number of variables. In the third analysis, we analysed the multicollinearity between the variables using the variance inflation factor (VIF). In the fourth analysis, the collinear variables filtered using the VIF were estimated by linear regression. The fifth analysis revealed the causal relationships among the variables using partial correlation. Finally, using cluster analysis, we examined the groups into which researchers should be enlisted.
Correlation analysis
With the exception of the FWCI indicator, the correlation is strong between the selected variables (Table 3). The FWCI has a weak linear relationship with the other six variables. The FWCI shows only a weak medium correlation with the Hirsch index and number of citations between 2009 and 2018, which is unsurprising since these are also citation variables. There are strong and very strong linear relationships among the other six variables.
Table 3 Correlations among the variables
Variable DOC CIT H-I DOC09–18 CIT09–18 FWCI C-A 0.833 0.720 0.624 0.821 0.750 0.208
Significance (two-tailed) 0.000 0.000 0.000 0.000 0.000 0.000 N 449 449 449 449 449 449 DOC 0.905 0.697 0.917 0.861 0.108
Significance (two-tailed) 0.000 0.000 0.000 0.000 0.022
N 449 449 449 449 449
CIT 0.784 0.764 0.892 0.195 Significance (two-tailed) 0.000 0.000 0.000 0.000
N 449 449 449 449
H-I 0.635 0.813 0.437 Significance (two-tailed) 0.000 0.000 0.000
N 449 449 449
DOC09–18 0.841 0.136
Significance (two-tailed) 0.000 0.004
N 449 449
CIT09-18 0.343
Significance (two-tailed) 0.000
N 449
Source: own compilation based on SPSS 20.
Another interesting feature of the correlations is that the Hirsch index shows a relatively strong correlation with all the variables. The correlation matrix suggests that the variables may be divided into two groups. All the correlation coefficients are significant. In Table 3, the correlations among the variables that express temporality in a logical chain are marked in grey. If the researcher first works with co-authors, then his/her work is accepted in a journal, so he/she publishes and then the published research result is cited, which makes the Hirsch index predictable.
The same is true for publications between 2009 and 2018. However, the grey shading indicates the correlation between the number of papers and number of publications between 2009 and 2018 as well as their citations.
Principal component analysis
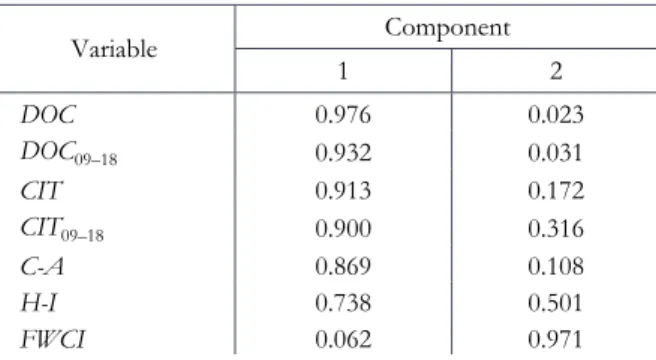
In the principal component analysis of the seven variables, two components account for 87.195 percent of the variance (Table 4). Further, the fit of the model according to the Kaiser–Meyer–Olkin test is 0.795, which is considered to be average.
Table 4 Rotated component matrix of the variables, 2019
Variable Component
1 2
DOC 0.976 0.023
DOC09–18 0.932 0.031
CIT 0.913 0.172
CIT09–18 0.900 0.316
C-A 0.869 0.108
H-I 0.738 0.501
FWCI 0.062 0.971
Note: The applied methods are principal component analysis and varimax rotation with Kaiser normalization.
The numbers in bold indicate values higher than 0.5 in the matrix, which help render the components to the variables.
Source: own compilation based on SPSS 20.
Owing to the high correlation coefficients of the seven variables, they are included in one main component. This component explains 68.100 percent of the standard deviation. The second component, which includes the Hirsch index and FWCI index, explains 19.095 percent of the standard deviation. Note that the Hirsch index is included in both components. Since the six variables have a high correlation coefficient and are included in one component, high multicollinearity can be expected between them, which is tested next.
Investigation of multicollinearity
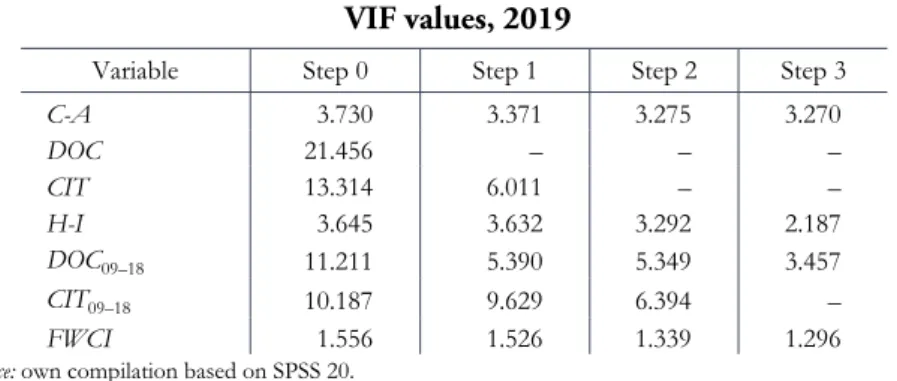
There is no general rule in the literature as to above what threshold variables are considered to be collinear. Although some empirically tested VIF thresholds range from 2.5 to 10, no set of theoretical or logical rules for redundancy filtering has thus far been reliably determined. Therefore, following the recommendations of several studies (Lafi–Kaneene 1992, Liao–Valliant 2012, O’Brien 2007), we chose 5 as the threshold value. A similar analysis is carried out by Vörösmarty and Dobos (2020).
Table 5 shows the sequential filtering of the variables. There is no deterministic algorithm for filtering out collinear variables. As a first step, it is recommended to filter out the variable with the highest VIF value; however, it is also appropriate to use any variable above the threshold. In the next step, researchers should select the element with the highest VIF value or the variable with the largest decrease in its VIF value. In our case, we chose the second option. In the first step, the number of references decreases the most between 2009 and 2018 (by about 45 percent), although the value of this variable and the VIF are not the largest. The first procedure also results in four variables, which are not detailed in the table. The examination of the initial VIF values reveals that the Hirsch index, number of co- authors, and initial value of the FWCI are less than 5, that is, below the threshold value. Hence, these variables cannot be included in the collinear variables to be eliminated because of the stepwise decrease of the VIF value. Therefore, the number of publications and number of citations both show linear dependence on the other variables.
Table 5 VIF values, 2019
Variable Step 0 Step 1 Step 2 Step 3 C-A 3.730 3.371 3.275 3.270
DOC 21.456 – – –
CIT 13.314 6.011 – –
H-I 3.645 3.632 3.292 2.187
DOC09–18 11.211 5.390 5.349 3.457
CIT09–18 10.187 9.629 6.394 –
FWCI 1.556 1.526 1.339 1.296
Source: own compilation based on SPSS 20.
Linear regression estimation of the collinear variables
The filtered three variables are estimated with the remaining four variables. The linear equation of the estimate is as follows:
DOC = –12.960 + 2.309 H-I + 0.319 C-A + 1.246
DOC09–18 7.223 FWCI. (1)
After estimating the number of publications in Scopus with the remaining four variables, the R2 value rises to 0.866, which is a high value. However, this is a natural
consequence of the high VIF value. The equation shows that the Hirsch index and the increase in the number of co-authors rises in the number of papers. The number of papers also co-moves with the number of publications between 2009 and 2018.
Equation (1) shows that the explanatory variables are logically positive. However, an increase in the FWCI index reduces the number of publications. The estimation of each of the parameters is significant at the 0.000 level, which confirms the explanatory power of the model.
The estimation of all the citations with four variables results in a model in which the R2 value is 0.749. The estimate of the variable is as follows:
CIT = –586.382 + 86.612 H-I + 3.447 C-A + 9.924
DOC09–18 110.394 FWCI. (2)
The same finding is made for all citations. The Hirsch index, number of co- authors, and number of publications increase the total number of citations between 2009 and 2018, whereas the FWCI index decreases it. The parameters are significant at the 0.000 level, while the coefficient of the number of co-authors is also high and significant at the 0.001 level.
Finally, we estimated the number of citations between 2009 and 2018. The R2 value is 0.844, which may be considered to be high. The linear equation of our estimate is as follows:
CIT09-18 = –244.272 + 26.108 H-I + 0.248 C-A + 6.734 DOC09–18+ 30.917
FWCI. (3)
Hence, a one-unit increase in each variable increases the number of citations between 2009 and 2018. The parameters are significant at the 0.000 level, except for the coefficient of the number of co-authors.
Partial correlation analysis
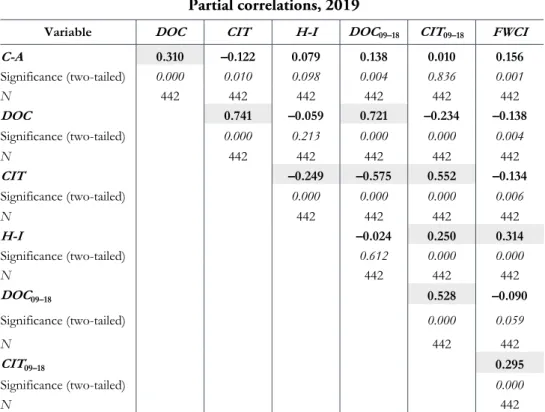
Partial correlation analysis is suitable for filtering out the effect of other variables when determining the correlation between two variables in a linear model. This can also be interpreted by mapping the causal relationship between these two variables.
Table 6 shows the partial correlations used to describe the causal relationships.
There are three types of causal relationships in the literature (Pearl 2009), namely, temporal, relationship, and non-spurious. We used temporal causality. The logical time series of the causal relationship C-A DOC CIT H-I was generated, which matches the DOC09–18 CIT09–18 FWCI temporality between 2009 and 2018. DOC DOC09–18 and CIT CIT09–18 can even be added as temporal relations. Indeed, temporal causality can also be illustrated with a cause-and-effect directed graph (Figure 1). In Table 6, these logical effects are marked in grey.
Table 6 Partial correlations, 2019
Variable DOC CIT H-I DOC09–18 CIT09–18 FWCI
C-A 0.310 –0.122 0.079 0.138 0.010 0.156
Significance (two-tailed) 0.000 0.010 0.098 0.004 0.836 0.001
N 442 442 442 442 442 442
DOC 0.741 –0.059 0.721 –0.234 –0.138
Significance (two-tailed) 0.000 0.213 0.000 0.000 0.004 N 442 442 442 442 442
CIT –0.249 –0.575 0.552 –0.134
Significance (two-tailed) 0.000 0.000 0.000 0.006
N 442 442 442 442
H-I –0.024 0.250 0.314
Significance (two-tailed) 0.612 0.000 0.000
N 442 442 442
DOC09–18 0.528 –0.090
Significance (two-tailed) 0.000 0.059
N 442 442
CIT09–18 0.295
Significance (two-tailed) 0.000
N 442
Note: Cells with a grey background show partial correlations. The p-values are 0.000 for the correlations higher than 0.3 in absolute value. The p-value of the variables having partial correlations lower than 0.3 in absolute value is higher than 0.004.
Source: own compilation based on SPSS 20.
Figure 1 Causal relations among the variables
Number of publications in 2009–2018
(DOC09-18)
Number of citations in 2009–2018
(CIT09-18)
FWCI
Number of co-authors
(C-A)
Number of publications
(DOC)
Number of citations
(CIT)
Hirsch index (H-I)
Note: Correlations between 0.55 and 0.75 are shown in black, while correlations between 0.25 and 0.40 are shown in grey.
Source: own compilation based on SPSS 20.
When exploring causal relationships, we consider partial correlation values above 0.25 in absolute value. There are five values between 0.50 and 0.75 and another five between 0.25 and 0.35. Figure 1 shows the causal relationships among the variables, highlighting that the block of citations including all citations, citations from the past 10 years, the Hirsch index, and the FWCI index depend on the number of publications, the number of citations between 2009 and 2018, and the number of co-authors. This finding suggests that the number of publications is strongly correlated with changes in the number of citations. At the same time, the number of co-authors is positively related to publication indicators (i.e. number of publications and number of publications between 2009 and 2018). The following system of causality can therefore be described: an increase in the number of co-authors increases the number of publications, whereas the number of publications can increase the number of citations together with the Hirsch index. This logical chain can also be interpreted as that several publications can mean several co-authors, which means that the system of relations cannot be illustrated with a directed graph.
Partial correlation analysis alone is insufficient to prove a causal relation. In addition, examining precedence would require a dynamic study or for the causal relationships among the variables to have been proven (e.g., by excluding inversion).
However, such analyses are outside the scope of the present study.
Grouping researchers with cluster analysis
We also clustered the researchers in the database into groups despite there being a high concentration of researchers in the database (i.e. the data on most researchers were similar). Table 7 summarizes the results. The number of clusters (13) was found to be relatively high, but even less of our dataset could be divided into interpretable clusters or groups. In eight of the 13 groups, the number of items was four or less. However, about 81 percent of the dataset was not further decomposed by the algorithm because many researchers stood out from the crowd in some way based on the seven variables. Indeed, better performing researchers were usually divided into different groups by the cluster analysis. This result was evenly distributed across the countries. A better solution could not be found by choosing a different grouping technique or distance definition. This led us to try to group researchers using a ranking procedure.
Table 7 Results of the cluster analysis, 2019
Cluster Number of units Cumulative percentage of units, %
1 4 0.9
2 7 1.6
3 4 0.9
4 4 0.9
5 362 80.6
6 42 9.4
7 1 0.2
8 18 4.0
9 1 0.2
10 3 0.7
11 1 0.2
12 1 0.2
13 1 0.2
Total 449 100.0
Source: own compilation based on SPSS 20.
Ranking of researchers using TOPSIS
A number of ranking techniques are used in decision theory, including analytic hierarchy process (AHP), data envelopment analysis (DEA), and elimination and choice reflecting reality (elimination and choix traduisant la realité – ELECTRE).
Among the available methods, we ranked researchers from the five countries using technique for order of preference by similarity to ideal solution (TOPSIS). This procedure is not widespread in Hungarian scientific publications (Gyarmati 2016, Kovács–Kő 2018). We chose TOPSIS because, like AHP, it allows the weights of aspects to be stopped objectively from the dataset, meaning that experts are not needed to determine the weights ex ante. In addition, the simplicity and geometric intelligence of the method help laypeople illustrate its applicability.
The basic feature of TOPSIS is that the available dataset can be normalized based on the variables using, for example, the Euclidean distance and the transformation of the data to the interval [0,1]. The normalized data are then weighted using the TOPSIS method in a subjective and an objective manner. In the case of subjective weighting, the weights of the aspects can be determined in advance (i.e. they are given). In the case of objective weighting, we start from the statistical properties of the dataset. Two methods are known for this: entropy (Zou et al. 2006) and the CRITIC criteria through intercriteria correlation (CRITIC) method (Diakoulaki et al. 1995). TOPSIS performs further calculations on the weighted normalized data matrix. First, it determines the ideal and negative ideal, that is, the preferred and rejected values for each aspect. In the next step, we
determine the distance from the ideal and negative ideal points for each observation unit (i.e. a researcher in our case). A quotient between 0 and 1 is then formed and the distance from the ideal point is proportional to the sum of the distances from the two preferred points. This value is 1 if the subject of observation (researcher) is preferred in everything and 0 if the observation is rejected in everything. The geometric approach aims to examine the distance from the two privileged points in the normalized space of the variables. This geometric is based on a well-known triangular inequality.
We used the transformation of the variables to the interval [0.1] in the normalization phase, while the entropy-based method was used to determine the weights. The variables taken from Scopus were supplemented with the number of citations per publication and the number of co-authors per publication (both total publications and publications between 2009 and 2018). Thus, each researcher was evaluated according to 10 criteria. The 449 observations or researchers were ranked using the TOPSIS method to shed light on how Hungarian economists perform compared with those in the Visegrád 4 countries and Romania. Hence, the 449 researchers were divided into ninths.
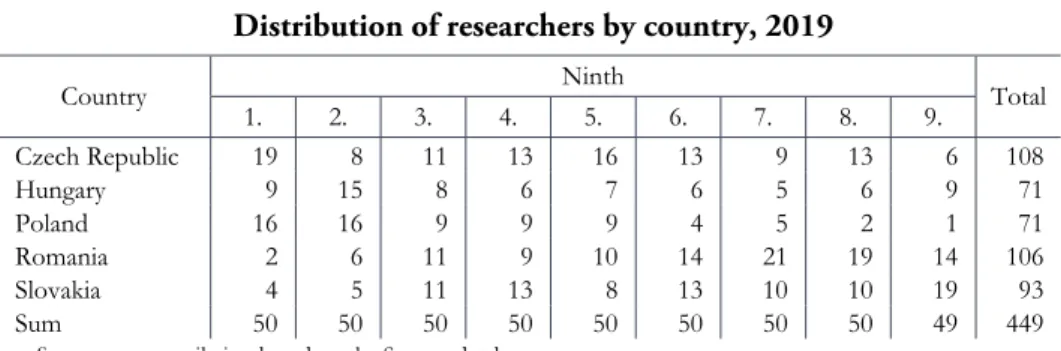
Table 8 Distribution of researchers by country, 2019
Country Ninth
Total 1. 2. 3. 4. 5. 6. 7. 8. 9.
Czech Republic 19 8 11 13 16 13 9 13 6 108 Hungary 9 15 8 6 7 6 5 6 9 71 Poland 16 16 9 9 9 4 5 2 1 71 Romania 2 6 11 9 10 14 21 19 14 106 Slovakia 4 5 11 13 8 13 10 10 19 93 Sum 50 50 50 50 50 50 50 50 49 449
Source: own compilation based on the Scopus database.
The results in Table 8 show that in the first ninth researchers from the Czech Republic and Poland have higher proportions, followed by Hungary, while researchers from Romania and Slovakia lag far behind. The same may be said for the second ninth, with the exception of the Czech Republic.
Table 9 Proportion of researchers by country, 2019
Country Ninth
Total 1. 2. 3. 4. 5. 6. 7. 8. 9.
Czech Republic 17.6 7.4 10.2 12.0 14.8 12.0 8.3 12.0 5.6 100.0 Hungary 12.7 21.1 11.3 8.5 9.9 8.5 7.0 8.5 12.7 100.0 Poland 22.5 22.5 12.7 12.7 12.7 5.6 7.0 2.8 1.4 100.0 Romania 1.9 5.7 10.4 8.5 9.4 13.2 19.8 17.9 13.2 100.0 Slovakia 4.3 5.4 11.8 14.0 8.6 14.0 10.8 10.8 20.4 100.0
Note: The highest proportion of researchers from a country in each ninth is highlighted in bold.
Source: own compilation based on the Scopus database.
Table 9 shows the proportion of researchers by country. Polish researchers have the highest proportion in the first ninth, followed by the Czech Republic and Hungary. At the same time in the second ninth Hungary closely follows Poland. The last four ninths are dominated by Romanian and Slovakian researchers.
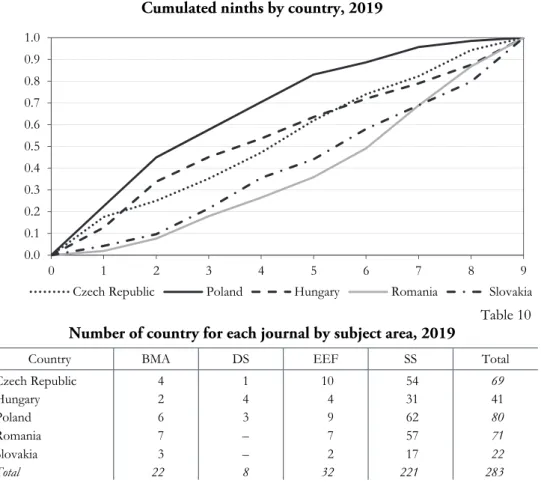
Finally, we examine how the distribution of each ninth changes by country.
Figure 2 shows that Polish researchers perform the best followed by Hungary, which has the best performance to the fifth ninth, except for the first where Poland is followed by the Czech Republic.
Figure 2 Cumulated ninths by country, 2019
0.0 0.1 0.2 0.3 0.4 0.5 0.6 0.7 0.8 0.9 1.0
0 1 2 3 4 5 6 7 8 9
Czech Republic Poland Hungary Romania Slovakia Table 10 Number of country for each journal by subject area, 2019
Country BMA DS EEF SS Total Czech Republic 4 1 10 54 69
Hungary 2 4 4 31 41
Poland 6 3 9 62 80
Romania 7 – 7 57 71 Slovakia 3 – 2 17 22
Total 22 8 32 221 283
Note: BMA (business, management, and accounting), DS (decision sciences), and EEF (economics, econometrics, and finance), and SS (social sciences).
Source: own compilation based on the SCImago database.
Table 10 shows how many Scopus journals each country has in the four disciplines. Behind Poland (80 titles), Romania (71), and the Czech Republic (69), 41 journals in Hungary are included in SCImago. This suggests that Hungarian researchers in the field of economics have fewer opportunities to publish in
English-language journals in Hungary. Czech and Polish researchers strive for research excellence, even though the ‘second line’ does not perform well in their case. Here, the ‘second’ and ‘third’ lines refer to researchers located in the higher ninths. Research sites in Hungary should strive to improve the performance of researchers in the ‘second’ and ‘third’ lines to catch up with the ‘first’ line.
Conclusion
Higher education institutions in the Visegrád 4 countries and Romania are not in the international vanguard; indeed, they rarely even reach the middle section of institutions and are usually placed in the lower third in economics and management.
This shortcoming can be explained by the fact that R&D expenditure as a proportion of GDP in these countries is below the EU average as well as by the publication performance being further away from the world standard. Expenditure on science increases the production of research results that are regularly published in prestigious journals; however, a change in attitudes and culture within the academic community is also an essential factor. The wealth of opportunities encouraging international student migration is having a draining effect on the gifted and committed supply of future scientists, and if they do not stay in or return to the region, there is no chance of catching up. The scientific elite committed to economics research in Central and Eastern Europe has a clearly observable publishing strategy: among other things, they focus on increasing their number of publications, while intensively seeking to publish their findings in a form of co- authorship, wishing to expand the volume of citations on the basis of these factors, which also have a positive effect on their Hirsch index. Based on publication performance, typical groups do not emerge in relation to the leading economics researchers in the Visegrád 4 countries and Romania. They, do form however a relatively homogeneous group when the characteristics of the publication of their results are examined. In the rankings of researchers compiled on the basis of their performance expressed in numbers, Polish and Czech economics researchers are at the forefront, their Hungarian colleagues have a solid position in second place, and their Slovak and Romanian peers lag behind.
As for future research avenues related to the survey methodology, calculating the population of each country would be worthwhile, as the number of higher education institutions is likely to be related to the population (e.g. GDP and number of university and college students). In the future, the quantitative indicators extracted from the Scopus database could also be qualitatively weighted to consider the quality of a publication or citation (Csomós 2017).
In summary, we do not know the extent of the challenge of making higher education in the Visegrád 4 countries and Romania catch up with the international vanguard and what sacrifices must be made by delaying the provision of resources
and dismantling structures impeding competitiveness. Nonetheless, our study has shown that economics researchers could move to a higher level in order to achieve this goal.
REFERENCES
CSOMÓS, GY. (2017): Visualising cities’ international scientific collaboration: a spatial scientometric approach based on Scopus data Regional Statistics 7 (1): 225–228.
https://doi.org/10.15196/RS0712
DIAKOULAKI, D.–MAVROTAS, G.–PAPAYANNAKIS, L. (1995): Determining objective weights in multiple criteria problems: The critic method Computers & Operations Research 22 (7): 763–770. http://dx.doi.org/10.1016/0305-0548(94)00059-H DIMA, M.–BEGU, L.–VASILESCU, D.–MAASSEN, A. (2018): The relationship between the
knowledge economy and global competitiveness in the European Union Sustainability 10 (1706): 1–15. https://doi.org/10.3390/su10061706
EGRI,Z.–TÁNCOS,T. (2018): The spatial peculiarities of economic and social convergence in Central and Eastern Europe Regional Statistics 8 (1): 49–77.
https://doi.org/10.15196/RS080108 ELSEVIER (2019): Research metrics guidebook. Available from:
https://www.elsevier.com/research-intelligence/resource-library/research- metrics-guidebook.
GYARMATI, J. (2016): Többszempontú csoportos döntési probléma megoldása TOPSIS módszerrel Hadmérnök 11 (3): 243–251.
http://hadmernok.hu/163_19_gyarmati.pdf
HRUBOS, I. (2019): Az Európai Felsőoktatási Térség létrehozása mint az Európai Unió felsőoktatás-politikájának központi eleme. Educatio 28 (1): 75–90.
https://doi.org/10.1556/2063.28.2019.1.6
KOCZISZKY,GY.(2018):The impact of the 2008 financial crisis on household income and wealth in Visegrad countries Regional Statistics 8 (1): 141–167.
https://doi.org/10.15196/rs080102.
KOVÁCS, T.–KŐ, A. (2018): Termelési hálózatok gyárainak összesített teljesítménymérése többváltozós döntési modellek alkalmazásával Vezetéstudomány 49 (4): 32–43.
https://doi.org/10.14267/VEZTUD.2018.04.04
LAFI,S.–KANEENE,J. (1992): An explanation of the use of principal-components analysis to detect and correct for multicollinearity Preventive Veterinary Medicine 13 (4):
261–275. https://doi.org/10.1016/0167-5877(92)90041-D
LAMPERTNÉ AKÓCSI,I. (2010): A humán tőke versenyképessége a visegrádi országcsoport régióiban Területi Statisztika 13 (6): 659–673.
LIAO,D.–VALLIANT,R. (2012): Variance inflation factors in the analysis of complex survey data Survey Methodology 38 (1): 53–62.
MEZŐ, F. (2001): Közép-Európa fogalmi változása térben és időben Tér és Társadalom 15 (3–4): 81–102. https://doi.org/10.17649/TET.15.3-4.822
MILLOT, B. (2015): International rankings: Universities vs. higher education systems International Journal of Educational Development 40 (January): 156–165.
https://doi.org/10.1016/j.ijedudev.2014.10.004
MÜLLER-FRĄCZEK,I. (2019): Dynamic measurement of complex phenomena in assessing the Europe 2020 strategy effects Regional Statistics 9 (1): 32–53.
https://doi.org/10.15196/RS090107
O’BRIEN,R. (2007): A caution regarding rules of thumb for variance inflation factors Quality
& Quantity 41 (5): 673–690. https://doi.org/10.1007/s11135-006-9018-6
OLCAY,G.–BULU,M. (2017): Is measuring the knowledge creation of universities possible?:
A review of university rankings Technological Forecasting & Social Change 123 (October): 153–160. https://doi.org/10.1016/j.techfore.2016.03.029
PEARL,J. (2009). Causality. Cambridge University Press, Cambridge https://doi.org/10.1017/CBO9780511803161
PURKAYASTHA, A.–PALMARO, E.–FALK-KRZESINSKI, H.–BAAS, J. (2019): Comparison of two article-level, field-independent citation metrics: Field-Weighted Citation Impact (FWCI) and Relative Citation Ratio (RCR) Journal of Informetrics 13 (2):
635–642. https://doi.org/10.1016/j.joi.2019.03.012
VINKLER,P. (1992): Research policy and publication productivity. In: Representations of Science and Technology Proceedings of the International Conference on Science and Technology Indicators, Bielefeld. pp. 75–91., Leiden: DSWO Press, Leiden University.
VINKLER,P. (2008): Correlation between the structure of scientific research, scientometric indicators and GDP in EU and non-EU countries Scientometrics 74 (2): 237–254.
https://doi.org/10.1007/s11192-008-0215-z
VINKLER,P. (2018): Structure of the scientific research and science policy Scientometrics (114):
737–756. https://doi.org/10.1007/s11192-017-2568-7
VÖRÖSMARTY,GY.–DOBOS,I. (2020): Green purchasing frameworks considering firm size:
a multicollinearity analysis using variance inflation factor. Supply Chain Forum: An International Journal, accepted. https://doi.org/10.1080/16258312.2020.1776090 ZAHAVI,H.–FRIEDMAN,Y.(2019): The Bologna Process: an international higher education
regime European Journal of Higher Education 9 (1): 23–39.
https://doi.org/10.1080/21568235.2018.1561314
ZOU,Z.–YUN,Y.–SUN,J.(2006): Entropy method for determination of weight of evaluating indicators in fuzzy synthetic evaluation for water quality assessment Journal of Environmental Sciences 18 (5): 1020–1023.
https://doi.org/10.1016/S1001-0742(06)60032-6