For Peer Review
Proteins arrangement factor (PA factor) as a new photosynthetic parameter characterizing organization of
thylakoid membrane proteins.
Journal: Physiologia Plantarum Manuscript ID PPL-2018-00612-EPS30 Manuscript Type: Special Issue article Date Submitted by the
Author: 31-Oct-2018
Complete List of Authors: Konert, Grzegorz; Institute of Microbiology, Czech Academy of Sciences Canonico, Myriam; Institute of Microbiology, Czech Academy of Sciences Steinbach, Gabor; Institute of Microbiology, Czech Academy of Sciences Kaňa, Radek; Institute of Microbiology, Czech Academy of Sciences Key Words: photosynthesis, thylakoid membrane, photosystems, cyanobacteria,
photoprotection
For Peer Review
Title: Proteins arrangement factor (PA factor) as a new photosynthetic parameter characterizing organization of thylakoid membrane proteins.
Authors: G. Konert1, G. Steinbach1#, M. Canonico1, R. Kaňa*1
Affiliations:
1Institute of Microbiology, CAS, Centrum Algatech, Třeboň, Czech Republic
*Correspondence to: R. Kaňa, kana@alga.cz.
# Present address: Institute of Biophysics, Biological Research Center, Szeged, Hungary
Abstract
The spatial distribution of pigmented proteins complexes – PPCs (namely photosystems and phycobilisomes) in thylakoid membranes of cyanobacteria play fundamental roles in their adaptation to various environmental conditions. In higher plants, photosystems are heterogeneously distributed between granal and stromal thylakoids that affects linear and cyclic electron transport. This heterogeneous organization is still opened question in cyanobacteria. Here, we have explained a new method to characterize changes in organization of PPCs in Synechocystis sp PCC 6803 strained with YFP tagged Photosystem I. The technique is based on newly developed method analyzing 3 channel RGB pictures of single cells (reflecting distribution of photosystems and phycobilisomes) and plotting the observed RGB fluorescence intensities into CIE1931 color space. The most common position in color space has been then defined as a new parameter called Proteins Arrangement factor (PA-factor). The presented methods allowed us fast, simple and human-error limiting method to analyze confocal microscopy images of single cell. The PA-factor reflects changes in ratios of PPCs fluorescence and their co-localization within thylakoid membranes by one numerical parameter. The parameter has been recognized to be very sensitive to 6 hours long high-light treatment, when 4 phases of acclimation have been recognized and discussed. We have compared the observed changes in the PA-factor on single cell level with variability in bulk measurements of maximal PSII efficiency (address by FV/FM). PA factor proved to be very sensitive to characterize physiological status of single cyanobacteria cell.
Abbreviations
FV/FM, maximal quantum yield of Photosystem II photochemistry; HL, High Light; ML, Moderate Light;
NPQ, Non-Photochemical Quenching; PA-factor, Proteins Arrangement factor; PBS, Phycobilisomes;
PPCs, Pigmented Protein Complexes (Photosystem I, Photosystem II, Phycobilisomes); PSI, Photosystem I; PSII, Photosystem II; YFP, Yellow Fluorescent Protein
Introduction
Precise characterization of physiological state of photosynthetic organisms is at the base of every successful experiment. Changes in photosynthesis during stressful conditions (e.g. high light, high 3
4 5 6 7 8 9 10 11 12 13 14 15 16 17 18 19 20 21 22 23 24 25 26 27 28 29 30 31 32 33 34 35 36 37 38 39 40 41 42 43 44 45 46 47 48 49 50 51 52 53 54 55 56
For Peer Review
temperature), ageing, or regular daily rhythm require a proper and sensitive experimental method.
There are several well-established methods to describe the physiological state of cyanobacterial cell cultures, such as growth rate, absorption spectra and methods based on variable chlorophyll a fluorescence (see e.g. (Maxwell and Johnson, 2000)). They includes detection of various parameters like non-photochemical and photochemical quenching or assessment of maximal quantum yield of Photosystem II – commonly used parameter FV/FM (Krause and Weis, 1991). These parameters reflect behavior of millions of cells and require few milliliters of their culture. Even thou this is usually enough to know the status of your cell suspension, single cell variations might be easily lost.
Up to now there are only few well established methods that can measure photosynthesis of on single cell level (see e.g. (Komárek et al., 2010) for review). Epifluorescence microscopy method combined with standard variable fluorescence machines (see for (Küpper et al., 2000) method description) allows to detect fluorescence inductions kinetics (Setlikova et al., 2005), absorption spectra including fluorescence emission spectra (Kupper et al., 2009) later described as a Spectrally Resolved Fluorescence Induction methods for bulk measurements (see (Kaňa et al., 2009) or review (Kaňa, 2018). The epifluorescence microscopy methods characterize whole cell behavior, however, they cannot resolve heterogeneity in single cell cyanobacteria membrane organization (Steinbach et al., 2015; Vermaas et al., 2008) as it requires confocal microscopy methods (Steinbach and Kaňa, 2016). It is well known that thylakoid membrane of cyanobacteria is densely packed, complex structure (Kirchhoff et al., 2008; Liu, 2016) with restricted proteins mobility of membrane proteins (Kaňa, 2013). These membrane proteins includes pigmented photosynthetic complexes (PPCs) catalyzing primary photochemical reactions. In cyanobacteria, they are represented by Photosystem I (PSI), Photosystem II (PSII) and light-harvesting antennae – Phycobilisomes (PBS). While the arrangement of the photosystems and light harvesting antenna in plant thylakoids has been described in detail (see granal/stromal heterogeneity in plants (Ruban and Johnson, 2015)), their localization in cyanobacteria is still not fully resolved. Heterogeneity of pigmented proteins in Synechocystis thylakoid membranes have shown confined regions in thylakoid membranes or microdomains (Agarwal et al., 2010; Casella et al., 2017; Collins et al., 2012; Grigoryeva and Chistyakova, 2018; Heinz et al., 2016; Strašková et al., 2018).
Except confocal microscopy methods, this spatial heterogeneity in photosystems has been reported also by proteomics or electron and atomic force microscopy (Agarwal et al., 2012; MacGregor-Chatwin et al., 2017; Sherman et al., 1994). It has been proposed, that the heterogeneity in localization of photosystems can be affected by short period of high light stress (Casella et al., 2017; Sarcina et al., 2006; Steinbach and Kaňa, 2016). On a level of bulk measurements with cell suspension, changes in gene expression and protein content during High Light (HL) stress in cyanobacteria present different mechanism operating in the first minutes and after few hours after shift (Fujita and Murakami, 1987;
Hihara and Ikeuchi, 1997; Hihara et al., 2001; Muramatsu and Hihara, 2012). This short-term changes involve PBS uncoupling, state transition, protective energy dissipation, and changes in photosynthetic gene expression (Acuna et al., 2016; Hihara et al., 2001; Chukhutsina et al., 2015). Long term acclimations involves composition, function and structure changes of thylakoid complexes (Allahverdiyeva et al., 2015; Majumder et al., 2017; Muramatsu et al., 2009; Oquist et al., 1995). All these changes detected during bulk measurements (short- and long-term) must be, to some extent, mirrored it in the microscopic localization of fluorescence pigmented protein complexes (Photosystems during the microscopic measurements as it has been shown previously (Casella et al., 2017; Sarcina et al., 2006; Steinbach and Kaňa, 2016).
3 4 5 6 7 8 9 10 11 12 13 14 15 16 17 18 19 20 21 22 23 24 25 26 27 28 29 30 31 32 33 34 35 36 37 38 39 40 41 42 43 44 45 46 47 48 49 50 51 52 53 54 55
For Peer Review
There are several methods suitable for characterization of fluorescence proteins localization on single cell level. It includes image segmentation (Wählby, 2015) or proteins co-localization (Dunn et al., 2011).
These methods lead to descriptive characteristics of spatial distribution of proteins of interests within cells, however they have several pitfalls including human error or parameters set-up that affects output of the analysis. In fact, there is a lack of fast and simple method in which the distribution of photosynthetic proteins in thylakoid membrane can be numerically defined. Numbers descripting localization of proteins are obtained by plotting fluorescence values collected from fluorescence emission from the cell on the chromacity diagram (Fairman et al., 1997; Guild, 1932; Wright, 1929). The chromacity diagram has been initially used in geology for characterization fluorescence colors of fluid inclusion oil trapped during the evolution of an oil reservoirs (Bourdet and Eadington, 2012; Schubert et al., 2007). Later, it has been applied in biology for objective characterization of surface color of sand- beetles (Harris and Weatherall, 1990).
In our work we have introduced a new method based on chromacity parameter to address membrane heterogeneity Synechocystis sp. PCC 6803 (hereafter Synechocystis 6803) during high-light treatment.
The method is based localization of three main pigmented proteins complexes in single cells by confocal microscopy method. We have applied simultaneous detection of chlorophyll autofluorescence of PSII, autofluorescence of phycobilisomes (PBS) and YFP fluorescence of PSI in PSI-YFP (PsaF-YFP) tagged strain of Synechocystis 6803. We have found that the position these three signals in the chromacity diagram represent a very sensitive new photosynthetic parameter that have been defined as a ”protein arrangement factor” – PA factor. The PA value represents the most occurring value on the chromacity diagram and thus it reflects proxy to fluorescence color in the single cell for system of three pigmented protein complexes, PSI, PSII and PBS. In this way, it can address the heterogeneity in organization in these proteins complexes in Synechocystis 6803 inside of thylakoid membranes. As a case study we have studied changes in the PA factor during high-light treatment and our newly developed parameter was compared with standard measurements of maximal quantum yield of PSII by FV/FM. We have identified four phases in behavior of PA factor, first that happens in first 10 minutes where both x and y values of PA-factor increase rapidly, reflected in fluorescence of PSI-YFP increase and decrease of CHL and PBS fluorescence. Second phase when fluorescence stabilizes and PA-factor x value decreases significantly, followed by similar phase where PA-factor doesn’t change and neither does fluorescence. Finally, last one with fluorescence of PBS increase and PSI-YFP decrease while PA-factor both x and y values decrease significantly. It turned out the PA factor represent a new independent physiological parameter characterizing status of single cyanobacteria cell. Our PA-factor was supposed to describe not only the ratios between protein fluorescence but also their localization within the cell at the same time.
Material and methods
Growth conditions of cells and high light treatment
Synechocystis strains used in the study represented the glucose-tolerant strain of Synechocystis sp. PCC 6803 (Williams, 1988) (hereafter referred to as Synechocystis 6803) previously described in (Tichy et al., 2016) that was fluorescently tagged at PSI subunit (PsaF) and described previously (Straskova et al., 2018). Cells were grown at continual light (35 µmol m-2 s-1) at orbital shaker at constant temperature (28
°C) in liquid medium (BG11). Cell in exponential growth phase (OD730=0.2) were used for experiments.
3 4 5 6 7 8 9 10 11 12 13 14 15 16 17 18 19 20 21 22 23 24 25 26 27 28 29 30 31 32 33 34 35 36 37 38 39 40 41 42 43 44 45 46 47 48 49 50 51 52 53 54 55 56
For Peer Review
High light treatment was induced by white LED lamp (700 µmol m-2 s-1) at temperature controlled room (28 °C), the cell culture was continuously shaked during incubation for 6 hours. Regular measurements of variable fluorescence and image acquisition were carried out at regular times of high-light treatment (0, 10, 30, 60, 90, 120, 240 and 360 minutes).
Measurement of variable fluorescence
Variable fluorescence was measure by DUAL-PAM-100 (Heinz Walz GmbH), and cells were dark adapted for 10 minutes before measurements. The maximal fluorescence was measured after exposure to dim blue (80 µmol m-2 s-1) for light for 3 minutes to induced high fluorescence state 1. Then multiple turnover flash was applied (4000 µmol m-2 s-1, 400 ms) to calculate maximal quantum yield of photochemistry of Photosystem II (FV/FM) calculated from (FM-F0)/FM, where FV stands for variable fluorescence, FM for maximum fluorescence, and F0 for minimum fluorescence.
Confocal microscopy
Cells were centrifuged at 8000 rpm for 5 minutes. Pellet was re-suspended in small volume of BG11 and 4 µL were pipetted on agar disc that was placed on thin cover glass. All results are averages of individual measuring points from 4 independent biological experiments; each individual measuring point 20-80 cells. Images were acquired by laser scanning confocal microscope (Zeiss LSM 880, Carl Zeiss Microscopy GmbH, Germany) equipped with a Plan-Apochromatic 63x/1.4 Oil DIC M27 objective. Signal was detected by GaAsP photomultiplier in 8-bit mode. The imaging was done with following parameters:
zoom: 5x; pinhole: 49, 53, and 63 µm (CHL, PSI-YFP, PBS respectively); pixel dwell time: 8.24 µs;
sequential imaging: 1 fps framerate at 512 x 512 pix; dichroic mirror: MBS 488/543/633 for CHL and PBS and 458/514 for PSI-YFP. Chlorophyll autofluorescence of PSII was excited with 488 nm laser and detected at 696-758 nm. Phycobilisome autofluorescence (PBS) were excited by 633 nm laser and detected at 642-677 nm. YFP fluorescence reflection PSI was excited with 514 nm laser and detected at 526-579 nm. The three channels were taken sequentially.
The acquired images for presentation were analyzed by FIJI version of ImageJ (ver. 1.52g) as 3 channel 8 bit RGB pictures. Protein arrangement factor (PA-factor) was calculated from whole cell areas. We applied color measurement system established by the Commission Intemationale de l’Eclairage (CIE1931). With this method we assigned precise numerical values for observed cells and then plot them on 2-dimensional space. Each single pixel of the image consisted of 3 fluorescence values: Red, Green, and Blue that represented fluorescence signal of PSII, PSI and PBS. We used transformation matrix (Wright 1929, Guild 1931, Fairman 1931) to recalculate this values into functions that could be later used to plot the value onto 2 dimensional color space.
Each cell was individually converted from 3 channels, 8-bit image to RGB-Color bitmap. Each pixel of cell area was composed of Red (R; PSII), Green (G; PSI-YFP), and Blue (B; PBS) values directly taken from 8-bit image corresponding channel. The RGB values were used to calculate XYZ values (Fairman et al., 1997):
X = (0.4121 ×𝑅)+ (0.3576 ×𝐺)+ (0.1805 ×𝐵) Y = (0.2126 ×𝑅)+ (0.7152 ×𝐺)+ (0.0722 ×𝐵) Z = (0.0193 ×𝑅)+ (0.1192 ×𝐺)+ (0.9505 ×𝐵) 3
4 5 6 7 8 9 10 11 12 13 14 15 16 17 18 19 20 21 22 23 24 25 26 27 28 29 30 31 32 33 34 35 36 37 38 39 40 41 42 43 44 45 46 47 48 49 50 51 52 53 54 55
For Peer Review
These XYZ representation was transformed directly to xy coordinates of CIE1931 color space using following equations (Fairman et al., 1997):
x = X
X + Y + Z
y = Y
X + Y + Z
The distribution of xy coordinates in CIE1931 were then plotted for every pixel of individual cell. The position of color (in xy coordinate) with maximal number of counts for one cell was then defined as cell’s Protein arrangement (PA)-factor.
Results
Estimation of Protein arrangement (PA) factor from single cells images of Synechocystis 6803
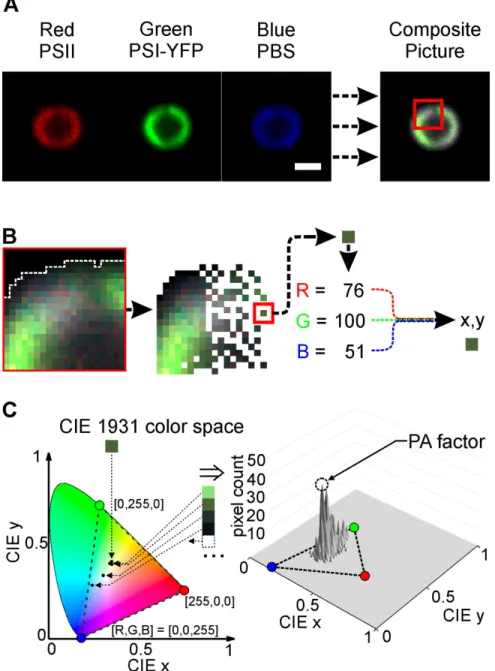
PA factor represents a parameter that allows to address organization of three main pigmented protein complexes (PPCs) inside of thylakoid membrane of Synechocystis 6803. Our confocal microscopy setup allowed us to detect three independent channels simultaneously, namely chlorophyll fluorescence of PSII (see red channel in Figure 1, Panel A), YFP fluorescence of YFP tagged PSI (see green channel in Figure 1, Panel A) and PBS fluorescence (see blue channel in Figure 1, Panel A). The simultaneous imaging of these PPCs allows us to define combined RGB picture of thylakoid membrane of Synechocystis 6803 (see Figure 1, Panel A). The picture were further numerically analyzed pixel-by-pixel (see Figure 1, Panel B) to obtain chromacity index of single cell (x, y) defining position in the chromacity CIE space (see Figure 1, Panel C) as it has been defined by color measurement system established by the Commission Intemationale de l’Eclairage (CIE1931) (Guild, 1932; Wright, 1929). The position reflecting higher counts of pixels (i.e. the most common color of the pixels in the thylakoid membrane) have been defined as Protein Arrangement factor (PA-factor, see Figure 1, Panel C). Variability in this parameter has been then explored during short high light treatment of Synechocystis 6803 cells.
Characterization of fluorescence intensity during highlight – single cells measurements
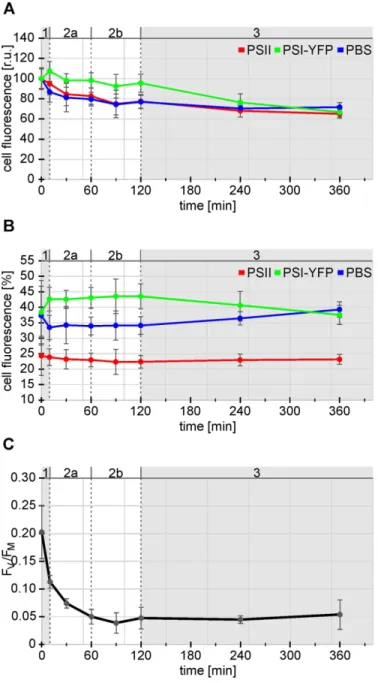
During High Light (HL) treatment we observed continual decrease in fluorescence intensity of single cell measured by confocal microscope (Fig. 2A). During 6 hours, the total fluorescence intensity of al PPCs decreased to about 75% of its initial value detected on the beginning of experiment. However, the loss of fluorescence was not proportional for all PPCs, for instance, during first ten minutes of HL (see t10) there was a clear relative increase in fluorescence of PSI-YFP (by 7%) while PBS and PSII dropped (by 13% and 5%, respectively see Fig. 2A). For prolonged irradiation (between 10 – 360 min) the fluorescence of all PPCs, continuously decreased with different kinetics. To address kinetic changes in the fluorescence drop in each channel separately, we compared the fluorescence for each channel (i.e.
for PSI, PSII and PBS) to the total fluorescence of the cell (i.e. to the sum of the fluorescence for these 3 channels). This allowed us to estimate kinetic changes in fluorescence of PSI, PSII and PBS in single cell during HL stress (Fig. 2B).
Kinetics of normalized fluorescence revealed presence of three phases during acclimation to HL. It is clearly visible especially for the PBS fluorescence, and for the fluorescence of YFP tagged PSI (Fig. 2B). In the case of PBS (see blue line in Fig. 2B), the initial drop (by about 10 %; during first ten minutes of HL 3
4 5 6 7 8 9 10 11 12 13 14 15 16 17 18 19 20 21 22 23 24 25 26 27 28 29 30 31 32 33 34 35 36 37 38 39 40 41 42 43 44 45 46 47 48 49 50 51 52 53 54 55 56
For Peer Review
(t10) was followed by a more stabilized phase that lasted 2 hours of HL (see t120 in Fig. 2B). Finally, relative PBS fluorescence was slightly rising till the end of experiment (t360). On the other hand, quite opposite kinetics were observed in PSI-YFP fluorescence, when initial increase was followed by a more stabilized phase (similarly with PBS), however the final phase (during last 4 hours) YFP signal of PSI decreased in contrast to the increase of the PBS signal (compare green and blue lines in Fig. 2B). PSII fluorescence fraction was the most stable, as it did not change significantly during HL treatment.
Physiological changes in PSII activity during HL treatment – bulk measurement
We have found minimal changes in the PSII fluorescence during single cells measurements (see red line in Fig. 2B). It is known that HL treatment can induced photoinhibition of cyanobacteria (Ogawa et al., 2018) that is accompanied by reversible PSII degradation and decrease in maximal efficiency of PSII measured as FV/FM (Aro et al., 1993). Therefore, except single cell measurements (see Fig. 1, 2A, 2B) bulk measurements of FV/FM have been carried out as well (Fig. 2C). The observed kinetics clearly showed progress of photoinhibition – parameter FV/FM decreased during initial 60 minutes of HL to about ¼ of its initial value and then it remained almost stable (Fig. 2C). We can conclude, that the applied HL treatment induced photoinhibition, however parameter of variable fluorescence (FV/FM) was sensitive to HL stress only during initial 1 hour of treatment. Therefore, we have tested newly developed Protein arrangement factor (see Fig. 1), to be a more sensitive stress sensor (see Fig. 3) in comparison to (FV/FM).
Physiological changes during HL treatment characterized by PA-factor
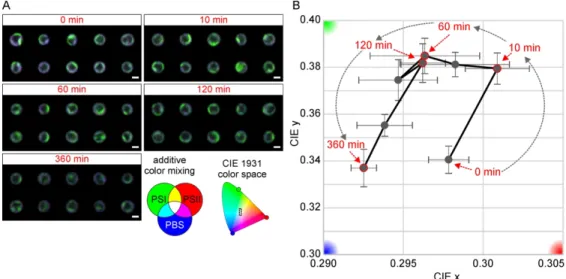
We have tested the newly developed PA factor to be a good indicator of physiological state of cyanobacteria thylakoids. The images acquired during HL treatment and used for calculation of average fluorescence of cells (Fig. 2A and 2B) were further used to calculate PA-factor (Fig. 3). In contrast to total cell fluorescence (shoeing 3 clear phases, see Fig. 2B) and even more in comparison to quantum yield of PSII (showing only two phases, see Fig. 2C), the PA factor allowed us to visualized 4 somehow distinct phases reflecting adaptation of thylakoid membrane to HL (Fig. 3B). We could detected following phases: (1) the initial increase of x and y values between t0 and t10; (2) decrease of x and slight increase of y values until t60; (3) stabilization of x and y values until t120; (4) decrease of both x and y values until t360 (Fig. 3B). The PA factors was able to distinguish in between 2a and 2b phases as defined during single cell fluorescence measurements (see almost no changes in the PBS and YFP fluorescence between 10- 120 min treatments in Fig. 2B).
Our results demonstrate that PA-factor can show precise changes in the cell physiological status.
Readjustment in fluorescence intensities are clearly visible. PA-factor not only characterizes ratios between channels fluorescence but also addresses co-localization of them within cells. Thylakoid membrane structure and average RGB color changes during HL stress, although visible by human-eye, are not so easily characterized or systematized into precise categories (Fig. 3A). However, with PA-factor heterogeneous distribution of fluorochromes in thylakoid membranes can be easily and precisely described.
Discussion
We have developed a new quantitative method confocal microscopy, protein arrangement factor – PA factor (Fig. 1 and Fig. 3B) to characterized physiological state of Synechocystis sp PCC 6803 with YFP tagged Photosystem I (Straskova et al., 2018) on single cell level. Simultaneously, the data were 3
4 5 6 7 8 9 10 11 12 13 14 15 16 17 18 19 20 21 22 23 24 25 26 27 28 29 30 31 32 33 34 35 36 37 38 39 40 41 42 43 44 45 46 47 48 49 50 51 52 53 54 55
For Peer Review
compared during 6 hour of high-light (HL) treatment with detection of single cell fluorescence of three pigmented proteins complexes (see Fig. 2A and 2B), namely PSII based on chlorophyll autofluorescence (red channel in Fig. 1A), PBS based on phycobilin autofluorescence (blue channel in Fig. 1A) and PSI based on YFP fluorescence (green channel in Fig. 1A). During HL (Fig. 2B) we observed 3 distinct phases in relative fluorescence of PPCs: initial (in few minutes), where PSI fluorescence showed a significant increase, while PSII and PBS decreased. The second, stabilization phase (between 10 min and 2 hours) when fluorescence ratios of PPCs did not vary (Fig. 2B) although total fluorescence of fluorochromes was steadily decreasing (Fig. 2A). The last, adaptation, phase (between 2 and 6 hours) was typical by slow decrease (increase) in PSI (PBS) per cell with no effect on PSII (Fig. 2B).
These three phases measured based on cell fluorescence level are comparable with changes in transcript levels of PSI, PSII and PBS subunits during HL treatment (Hihara et al., 2001). These authors observed three distinct phases, rapid (first 30 minutes) downregulation of PSI and PBS genes, slower stabilization (during 1 h), and final recovery in RNA content for PSI and PBS (between 1-15 hours). The transcripts of PSII subunits was initially upregulated, and decreased afterwards with slower (around 1h), followed by further decreased later. The apparent discrepancy between initial increase in PSI fluorescence we observed (Fig. 2A and 2B) and PSI transcript level decrease (Hihara et al., 2001) could be caused by ability our fast method to detect the initial phase (10 min after irradiation) that is not possible to see in transcript level (see the first point at 15 min in (Hihara et al., 2001)). Interestingly, the PA-factor measurement portrayed same 3 phases as cell fluorescence measurement (Fig. 3B) and PSI, PSII and PBS transcript levels (Hihara et al., 2001). Additionally PA factor revealed dynamicity between 10-60 minutes (Fig. 3B) when fluorescence ratios did not change (Fig. 2B). As PA-factor moved towards
“green corner” of CIE space between 10-60 minutes as cells become slightly more “greenish” because the PSI complexes were spatially reorganized on microscale level (at “single pixel”) away from PSII and PBS (Fig. 3A); the process is however is invisible in averaged value of cell fluorescence (Fig. 2B). It shows that PA factor is able to address small changes in the organization of PPCs in thylakoid membrane. Its application for characterization of PPCs distribution in specific mutants (e.g. without PSI, PSII) will be useful to understood the problem of PPCs Heterogeneity in cyanobacteria thylakoid membranes reported previously (Casella et al., 2017; Steinbach et al., 2015; Vermaas et al., 2008).
Level of transcript of PSI subunits in every publications instantly decreasing during HL stress (Hihara et al., 2001; Hihara et al., 1998; Muramatsu and Hihara, 2012). It is due to avoid absorbing excess light energy as PSI proteins are a dominant sink for de novo synthetized chlorophylls (Kopecna et al., 2012).
Indeed, during our long run experiment (after 2 h of HL) the decrease in absolute PSI-YFP fluorescence was clearly visible (Fig. 2A), although initial phase (0-10 min) showed big increase. This might be explained by downregulation in level of PSI subunits (Muramatsu et al., 2009) even though photosynthetically active centers inside thylakoid membrane are PSI-YFP still present as it is very stable in membrane in comparison to PSII (Li et al., 2018). It is known that PSII are the complexes that undergoes faster replacement that is connected with D1 protein turnover (Li et al., 2018). It was previously reported that upon shift to HL Synechococcus cells exhibit 3 phases: photoinhibition (0-1 h), regeneration (1-3 h), and acclimation (>3 h). Similarly in Synechocystis, the psbA2 and psbA3 genes transcript increased at the beginning of HL stress with lower expression at later phase (Hihara et al., 2001; Tu et al., 2004). These data reflected change in PSII proteins transcript levels in stroma, our data on average cell fluorescence of PSII (Fig. 2A and 2B) shown rather actual concentrations of PSII in membrane. Therefore, we saw continual decrease in PSII during HL treatment that need to be obviously 3
4 5 6 7 8 9 10 11 12 13 14 15 16 17 18 19 20 21 22 23 24 25 26 27 28 29 30 31 32 33 34 35 36 37 38 39 40 41 42 43 44 45 46 47 48 49 50 51 52 53 54 55 56
For Peer Review
balanced by hither expression of PSII proteins (Kopecna et al., 2012). The last protein complex that we have studied, phycobilisome (see Fig. 2 and 3) have shown similar pattern. It is known that amount PBS during HL treatment is downregulated (see review: (Zhan and Wang, 2018) on level of transcripts (apc and cps subunits) during first 1h of HL treatment or because degradation of PBS linker proteins (Pojidaeva et al., 2004). Both mechanism lead to avoidance of absorption of excess light energy, resulting in shortening of PBS rods (Zhan and Wang, 2018) and degradation of functional PBS decoupling from the membrane causing increasing PBS fluorescence (see e.g. (Kaňa et al., 2009; Tamary et al., 2012) or review (Kirilovsky et al., 2014)). However, in both cases, on a level actual proteins content in thylakoid membrane (our data in Fig. 2B), in PA-factor stages reflecting PPCs co-localization, and for average cell fluorescence of PPCs (Fig. 2B) at least three phases are detectable with similar time scale: initial photoinhibition (in minutes), followed by regeneration (up to two hours), and final stage regeneration or adaptation (several hours). It points out to the simultaneous response of Synechocystis on level membrane organization and protein transcription.
This co-regulation of thylakoid membrane organization and PPCs composition is also reflected in multiphasic response to light stress on level of actual protein content (Komenda, 2000; Kopecna et al., 2012; Muramatsu and Hihara, 2012) and pigment content (Hihara et al., 1998; Kopecna et al., 2012).
Upon shift to HL Synechocystis cells do show rapid decrease of CHL and PBS absorption during first 4 hours, followed by lag phase from 4 to 6 h after shift (Kopecna et al., 2012). Actual levels of D1 protein response to HL stress is even faster, it is already lower in 30 mins on HL and reduced for 4 h and the level is reduced even after 24 hours of HL (Kopecna et al., 2012). Considering PSI content, it drops during HL stress in two phases, first rapid drop up to 6 h after HL onset, followed by slower drop after that time point (Muramatsu et al., 2009) and remained lowered after 24 hours of HL (Kopecna et al., 2012). The process is not controlled by reduced PsaAB transcript (Muramatsu et al., 2009) but rather degradation of the newly synthetized polypeptide and lack of de novo synthetized Chlorophyll molecules (Kopecna et al., 2012; Muramatsu et al., 2009). However, all these data clearly showed decrease in content of key proteins subunits already during several hour of HL that is reflected in decrease of the average cell fluorescence measured by confocal microscope (Fig. 2A).
Observed fluorescence decrease of PBS and PSII can be also impacted by photoprotective mechanisms decreasing the quantum yield of these proteins complexes. it can be achieved by OCP dependent non- photochemical quenching (NPQ), PBS decoupling, or state transitions (Kirilovsky, 2015). State transition is the process of redistributing energy between PSI and PSII, while the illumination conditions change.
This allows fine-tuning redox processes in the photosystems and protecting from photooxidative damage. In state 1 PBS favorable arrangement towards PSII excitation, while during state 2 preferentially excites PSI (Derks et al., 2015). State transitions in cyanobacteria is faster in time scale (up to few minutes) than those found in higher plants and green algae (Kirilovsky, 2015). It is also accompanied by small fluorescence rise peaking at 685 nm (so called SM rise, see (Kana et al., 2012)).
However, the SM fluorescence rise (in range of minutes) increases fluorescence therefore it cannot be attributed to observed reduction in PSII and PBS fluorescence (Fig. 2A). On the other hand, the OCP dependent NPQ reduce PBS fluorescence. Therefore, we tend to suggest that it can affects reduction in average fluorescence of PBS during first 10 minutes of HL (Fig. 2A and 2B) and it can be also involved in transition of PA factor in this time range further from the blue corner (Fig. 3B). PBS decoupling is able to increase fluorescence of PBS for longer periods of HL (Steinbach and Kana, 2016). Therefore, it could 3
4 5 6 7 8 9 10 11 12 13 14 15 16 17 18 19 20 21 22 23 24 25 26 27 28 29 30 31 32 33 34 35 36 37 38 39 40 41 42 43 44 45 46 47 48 49 50 51 52 53 54 55
For Peer Review
partially explained relative increase in single cell PBS fluorescence (Fig. 2B) and transition of PA factor towards blue corner (Fig. 3B)
This shows applicability of PA factor for estimation of physiological stage of cyanobacteria cells. It is even more sensitive parameter that FV/FM parameter (see Fig. 2C) that is commonly used as stress indicator. This study showing usage of CIE1931 color scheme in the confocal image analysis of Synechocystis thylakoid membrane complexes. Significance of the newly described PA-factor can be visible while observing its relation to fluorescence and eye-description of cells. What was visible by human eye as “change of color” of cells now can be precisely monitored and given numerical value reflects current state or even small changes in cyanobacteria culture. PA-factor in addition to the fluorescence values of channels inform us not only of amount of fluorescence of PSI, PSII and PBS per cell (Fig. 2A and B) it also reflects redistribution and colocalisation of these PPCs within membranes of thylakoids. Although PA-factor can be calibrated for particular setup of microscope and represents valuable and well reproducible parameter. The PA factor can be used as a “health standard” for cyanobacteria cells before any other experiment. In fact, the type of colorimetric applications were used in food quality check (Gaiani et al., 2013; Huang and Miskelly, 2016; Russell, 2005).
Acknowledgements:
This research project was supported by The Czech Science Foundation GAČR (Grantová agentura České republiky) project GACR 16-10088S. The work at center ALGATECH has been and by the institutional projects Algatech Plus (MSMT LO1416) and Algamic (CZ 503 1.05/2.1.00/19.0392) from the Czech Ministry of Education, Youth and Sport.
References
Acuna AM, Kana R, Gwizdala M, Snellenburg JJ, van Alphen P, van Oort B, Kirilovsky D, van Grondelle R and van Stokkum IHM (2016) A method to decompose spectral changes in Synechocystis PCC 6803 during light-induced state transitions. Photosynth Res 130:237-249.
Agarwal R, Maralihalli G, Sudarsan V, Choudhury SD, Vatsa RK, Pal H, Melzer M and Sainis JK (2012) Differential distribution of pigment-protein complexes in the Thylakoid membranes of Synechocystis 6803. Journal of bioenergetics and biomembranes 44:399-409.
Agarwal R, Matros A, Melzer M, Mock H-P and Sainis JK (2010) Heterogeneity in thylakoid membrane proteome of Synechocystis 6803. Journal of Proteomics 73:976-991.
Allahverdiyeva Y, Suorsa M, Tikkanen M and Aro EM (2015) Photoprotection of photosystems in fluctuating light intensities. Journal of experimental botany 66:2427-2436.
Aro EM, McCaffery S and Anderson JM (1993) Photoinhibition and D1 Protein Degradation in Peas Acclimated to Different Growth Irradiances. Plant Physiol 103:835-843.
Bourdet J and Eadington P (2012) Fluorescence and Infrared Spectroscopy of inclusion oil, in CSIRO.
p^pp 60.
Casella S, Huang F, Mason D, Zhao GY, Johnson GN, Mullineaux CW and Liu LN (2017) Dissecting the Native Architecture and Dynamics of Cyanobacterial Photosynthetic Machinery. Molecular Plant 10:1434-1448.
Collins AM, Liberton M, Jones HDT, Garcia OF, Pakrasi HB and Timlin JA (2012) Photosynthetic Pigment Localization and Thylakoid Membrane Morphology Are Altered in Synechocystis 6803
Phycobilisome Mutants. Plant Physiol 158:1600-1609.
3 4 5 6 7 8 9 10 11 12 13 14 15 16 17 18 19 20 21 22 23 24 25 26 27 28 29 30 31 32 33 34 35 36 37 38 39 40 41 42 43 44 45 46 47 48 49 50 51 52 53 54 55 56
For Peer Review
Derks A, Schaven K and Bruce D (2015) Diverse mechanisms for photoprotection in photosynthesis.
Dynamic regulation of photosystem II excitation in response to rapid environmental change.
Biochimica et biophysica acta 1847:468-485.
Dunn KW, Kamocka MM and McDonald JH (2011) A practical guide to evaluating colocalization in biological microscopy. American journal of physiology Cell physiology 300:C723-C742.
Fairman HS, Brill MH and Hemmendinger H (1997) How the CIE 1931 color-matching functions were derived from Wright-Guild data. Color Research and Application 22:11-23.
Fujita Y and Murakami A (1987) Regulation of Electron Transport Composition in Cyanobacterial Photosynthetic System: Stoichiometry among Photosystem I and II Complexes and Their Light- Harvesting Antennae and Cytochrome b6/f Complex. Plant Cell Physiology 28:1547-1553.
Gaiani C, Burgain J and Scher J (2013) Surface composition of food powders, in Handbook of Food Powders (Bhandari B, Bansal N, Zhang M and Schuck P eds), Woodhead Publishing. p^pp 339- 378.
Grigoryeva N and Chistyakova L (2018) Fluorescence Microscopic Spectroscopy for Investigation and Monitoring of Biological Diversity and Physiological State of Cyanobacterial Cultures, in Cyanobacteria (Tiwari A ed), IntechOpen. p^pp 11-43.
Guild J (1932) The colorimetric properties of the spectrum. Philosophical Transactions of the Royal Society of London:149-187.
Harris AC and Weatherall IL (1990) Objective evaluation of color variation in the sand-burrowing beetle Chaerodes trachyscelides White (Coleoptera: Tenebrionidae) by instrumental determination of CIELAB values. J R Soc NZ 20:253-259.
Heinz S, Rast A, Shao L, Gutu A, Gugel IL, Heyno E, Labs M, Rengstl B, Viola S, Nowaczyk MM, Leister D and Nickelsen J (2016) Thylakoid Membrane Architecture in Synechocystis Depends on CurT, a Homolog of the Granal CURVATURE THYLAKOID1 Proteins. Plant Cell 28:2238-2260.
Hihara Y and Ikeuchi M (1997) Mutation in a novel gene required for photomixotrophic growth leads to enhanced photoautotrophic growth of Synechocystis sp. PCC 6803. Photosynth Res 53:243-252.
Hihara Y, Kamei A, Kanehisa M, Kaplan A and Ikeuchi M (2001) DNA microarray analysis of cyanobacterial gene expression during acclimation to high light. Plant Cell 13:793-806.
Hihara Y, Sonoike K and Ikeuchi M (1998) A novel gene, pmgA, specifically regulates photosystem stoichiometry in the cyanobacterium Synechocystis species PCC 6803 in response to high light.
Plant Physiol 117:1205-1216.
Huang S and Miskelly D (2016) Laboratory Preparation and Evaluation of Steamed Bread, in Steamed Breads (Huang S and Miskelly D eds), Woodhead Publishing. p^pp 109-137.
Chukhutsina V, Bersanini L, Aro EM and van Amerongen H (2015) Cyanobacterial Light-Harvesting Phycobilisomes Uncouple From Photosystem I During Dark-To-Light Transitions. Scientific reports 5:14193.
Kaňa R (2013) Mobility of photosynthetic proteins. Photosynth Res 116:465-479.
Kaňa R (2018) Application of spectrally resolved fluorescence induction to study light-induced nonphotochemical quenching in algae. Photosynthetica 56:132-138.
Kana R, Kotabova E, Komarek O, Sediva B, Papageorgiou GC, Govindjee and Prasil O (2012) The slow S to M fluorescence rise in cyanobacteria is due to a state 2 to state 1 transition. Biochimica et biophysica acta 1817:1237-1247.
Kaňa R, Prášil O, Komárek O, Papageorgiou GC and Govindjee (2009) Spectral characteristic of
fluorescence induction in a model cyanobacterium, Synechococcus sp (PCC 7942). Biochimica Et Biophysica Acta 1787:1170-1178.
Kirchhoff H, Haferkamp S, Allen JF, Epstein DBA and Mullineaux CW (2008) Protein diffusion and macromolecular crowding in thylakoid membranes. Plant Physiol 146:1571-1578.
3 4 5 6 7 8 9 10 11 12 13 14 15 16 17 18 19 20 21 22 23 24 25 26 27 28 29 30 31 32 33 34 35 36 37 38 39 40 41 42 43 44 45 46 47 48 49 50 51 52 53 54 55
For Peer Review
Kirilovsky D (2015) Modulating energy arriving at photochemical reaction centers: orange carotenoid protein-related photoprotection and state transitions. Photosynth Res 126:3-17.
Kirilovsky D, Kaňa R and Prášil O (2014) Mechanisms Modulating Energy Arriving at Reaction Centers in Cyanobacteria, in Non-Photochemical Quenching and Energy Dissipation in Plants, Algae and Cyanobacteria (Demmig-Adams B, Garab G, Adams Iii W and Govindjee eds), Springer Netherlands. p^pp 471-501.
Komárek O, Felcmanová K, Šetlíková E, Kotabová E, Trtílek M and Prášil O (2010) Microscopic Measurements of the Chlorophyll a Fluorescence Kinetics, in Chlorophyll a Fluorescence in Aquatic Sciences: Methods and Applications (Suggett DJ, Prášil O and Borowitzka MA eds), Springer Netherlands, Dordrecht. p^pp 91-101.
Komenda J (2000) Role of two forms of the D1 protein in the recovery from photoinhibition of
photosystem II in the cyanobacterium Synechococcus PCC 7942. Biochimica et biophysica acta 1457:243-252.
Kopecna J, Komenda J, Bucinska L and Sobotka R (2012) Long-term acclimation of the cyanobacterium Synechocystis sp. PCC 6803 to high light is accompanied by an enhanced production of chlorophyll that is preferentially channeled to trimeric photosystem I. Plant Physiol 160:2239- 2250.
Krause GH and Weis E (1991) Chlorophyll fluorescence and photosynthesis - the basics. Annu Rev Plant Physiol Plant Molec Biol 42:313-349.
Kupper H, Andresen E, Wiegert S, Simek M, Leitenmaier B and Setlik I (2009) Reversible coupling of individual phycobiliprotein isoforms during state transitions in the cyanobacterium
Trichodesmium analysed by single-cell fluorescence kinetic measurements. Biochim Biophys Acta 1787:155-167.
Küpper H, Šetlík I, Trtílek M and Nedbal L (2000) A Microscope for Two-Dimensional Measurements of In Vivo Chlorophyll Fluorescence Kinetics Using Pulsed Measuring Radiation, Continuous Actinic Radiation, and Saturating Flashes. Photosynthetica 38:553-570.
Li L, Aro EM and Millar AH (2018) Mechanisms of Photodamage and Protein Turnover in Photoinhibition.
Trends Plant Sci 23:667-676.
Liu LN (2016) Distribution and dynamics of electron transport complexes in cyanobacterial thylakoid membranes. Biochimica et biophysica acta 1857:256-265.
MacGregor-Chatwin C, Sener M, Barnett SFH, Hitchcock A, Barnhart-Dailey MC, Maghlaoui K, Barber J, Timlin JA, Schulten K and Hunter CN (2017) Lateral Segregation of Photosystem I in
Cyanobacterial Thylakoids. Plant Cell 29:1119-1136.
Majumder EL, Wolf BM, Liu H, Berg RH, Timlin JA, Chen M and Blankenship RE (2017) Subcellular pigment distribution is altered under far-red light acclimation in cyanobacteria that contain chlorophyll f. Photosynth Res 134:183-192.
Maxwell K and Johnson GN (2000) Chlorophyll fluorescence - a practical guide. J Exp Bot 51:659-668.
Muramatsu M and Hihara Y (2012) Acclimation to high-light conditions in cyanobacteria: from gene expression to physiological responses. J Plant Res 125:11-39.
Muramatsu M, Sonoike K and Hihara Y (2009) Mechanism of downregulation of photosystem I content under high-light conditions in the cyanobacterium Synechocystis sp. PCC 6803. Microbiology (Reading, England) 155:989-996.
Ogawa K, Yoshikawa K, Matsuda F, Toya Y and Shimizu H (2018) Transcriptome analysis of the
cyanobacterium Synechocystis sp. PCC 6803 and mechanisms of photoinhibition tolerance under extreme high light conditions. Journal of bioscience and bioengineering 126:596-602.
Oquist G, Campbell D, Clarke AK and Gustafsson P (1995) The cyanobacterium Synechococcus modulates Photosystem II function in response to excitation stress through D1 exchange. Photosynth Res 46:151-158.
3 4 5 6 7 8 9 10 11 12 13 14 15 16 17 18 19 20 21 22 23 24 25 26 27 28 29 30 31 32 33 34 35 36 37 38 39 40 41 42 43 44 45 46 47 48 49 50 51 52 53 54 55 56
For Peer Review
Pojidaeva E, Zinchenko V, Shestakov SV and Sokolenko A (2004) Involvement of the SppA1 peptidase in acclimation to saturating light intensities in Synechocystis sp. strain PCC 6803. Journal of bacteriology 186:3991-3999.
Ruban AV and Johnson MP (2015) Visualizing the dynamic structure of the plant photosynthetic membrane. Nature Plants 1.
Russell SM (2005) Rapid detection and enumeration of pathogens on poultry meat., in Food safety control in the poultry industry (Mead GC ed), Woodhead Publishing, Cambridge. p^pp 454-485.
Sarcina M, Bouzovitis N and Mullineaux CW (2006) Mobilization of photosystem II induced by intense red light in the cyanobacterium Synechococcus sp PCC7942. Plant Cell 18:457-464.
Setlikova E, Setlik I, Kupper H, Kasalicky V and Prasil O (2005) The photosynthesis of individual algal cells during the cell cycle of Scenedesmus quadricauda studied by chlorophyll fluorescence kinetic microscopy. Photosynth Res 84:113-120.
Sherman DM, Troyan TA and Sherman LA (1994) Localization of Membrane Proteins in the Cyanobacterium Synechococcus sp pcc7942 - Radial Asymmetry in the Photosynthetic Complexes. Plant Physiol 106:251-262.
Schubert F, Diamond LW and Toth TM (2007) Fluid-inclusion evidence of petroleum migration through a buried metamorphic dome in the Pannonian Basin, Hungary. Chem Geol 244:357-381.
Steinbach G and Kana R (2016) Automated Microscopy: Macro Language Controlling a Confocal
Microscope and its External Illumination: Adaptation for Photosynthetic Organisms. Microscopy and microanalysis : the official journal of Microscopy Society of America, Microbeam Analysis Society, Microscopical Society of Canada 22:258-263.
Steinbach G and Kaňa R (2016) Automated microscopy: macro language controlling a confocal
microscope and its external illumination – adaptation for photosynthetic organisms. Microscopy and Microanalysis 22:258-263.
Steinbach G, Schubert F and Kaňa R (2015) Cryo-imaging of photosystems and phycobilisomes in Anabaena sp. PCC 7120 cells. Journal of Photochemistry and Photobiology B: Biology 152, Part B:395-399.
Straskova A, Knoppova J and Komenda J (2018) Isolation of the cyanobacterial YFP-tagged photosystem I using GFP-Trap (R). Photosynthetica 56:300-305.
Strašková A, Steinbach G, Kotabová E, Komenda J, Tichý M and Kaňa R (2018) Stable photosynthetic microdomains in thylakoid membrane of cyanobacteria. J Exp Bot submitted.
Tamary E, Kiss V, Nevo R, Adam Z, Bernat G, Rexroth S, Rogner M and Reich Z (2012) Structural and functional alterations of cyanobacterial phycobilisomes induced by high-light stress. Biochim Biophys Acta-Bioenerg 1817:319-327.
Tichy M, Beckova M, Kopecna J, Noda J, Sobotka R and Komenda J (2016) Strain of Synechocystis PCC 6803 with Aberrant Assembly of Photosystem NN Contains Tandem Duplication of a Large Chromosomal Region. Frontiers in Plant Science 7.
Tu CJ, Shrager J, Burnap RL, Postier BL and Grossman AR (2004) Consequences of a deletion in dspA on transcript accumulation in Synechocystis sp. strain PCC6803. Journal of bacteriology 186:3889- 3902.
Vermaas WFJ, Timlin JA, Jones HDT, Sinclair MB, Nieman LT, Hamad SW, Melgaard DK and Haaland DM (2008) In vivo hyperspectral confocal fluorescence imaging to determine pigment localization and distribution in cyanobacterial cells. Proceedings of the National Academy of Sciences of the United States of America 105:4050-4055.
Wählby C (2015) Image Segmentation, Processing and Analysis in Microscopy and Life Science, in Mathematical Models in Biology: Bringing Mathematics to Life (Zazzu V, Ferraro MB and Guarracino MR eds), Springer International Publishing, Cham. p^pp 1-16.
3 4 5 6 7 8 9 10 11 12 13 14 15 16 17 18 19 20 21 22 23 24 25 26 27 28 29 30 31 32 33 34 35 36 37 38 39 40 41 42 43 44 45 46 47 48 49 50 51 52 53 54 55
For Peer Review
Williams JGK (1988) Construction of Specific Mutations in Photosystem-Ii Photosynthetic Reaction Center by Genetic-Engineering Methods in Synechocystis-6803. Method Enzymol 167:766-778.
Wright WD (1929) A re-determination of the trichromatic coefficients of the spectral colours.
Transactions of the Optical Society:141-164.
Zhan J and Wang Q (2018) Photoresponse Mechanism in Cyanobacteria: Key Factor in Photoautotrophic Chassis. Advances in experimental medicine and biology 1080:75-96.
Figure legends
Figure 1. Calculation of protein arrangement factor (PA-factor) from RGB images of cyanobacteria cells. The standard image (80 x 80 pixels) of Synechocystis sp. PCC 6803 (with YFP tagged PSI) were acquired in three channel mode when fluorescence of PSII (Chlorophyll – Red), PSI (YFP – Green), and PBS (Phycobilin – Blue) were detected simultaneously. The obtained RGB image of single cell were then used for calculation of PA-factor that defines “mode (most common) color” of the cell based on chromacity diagram as defined by CIE1931 system (Fairman et al., 1997; Guild, 1932; Wright, 1929).
Panel A: Confocal images acquired in three channel mode (Red: PSII fluorescence, Green: PSI-YFP fluorescence, Blue: PBS fluorescence; 8-bit) were merged together to form 24-bit color RGB image; scale bar represents 1 µm. Panel B: Magnified fragment from RGB image from Panel A. To calculate PA-factor each pixel (53 nm) belonging to cell area (see cell edges marked by dashed grey line) was used for calculations. Color of every pixel was defined by the intensity of 3 base colors (Red (PSII), Green (PSI- YFP), Blue (PBS) – see example [R, G, B] = [76, 100, 51]). The pixel values ([R, G, B]) were transformed in few steps to coordinates of chromacity space (x, y) based on equations described in (Fairman et al., 1997) (see Materials and Methods for details). Panel C: Values xy define chromacity color space coordinates, and represent “color” of the pixel. Each pixel’s xy value is plotted independently on the CIE1931 color space (left panel, example of 5 pixels positions). After all pixels belonging to single cell have been plotted, the value xy with the highest number count is defined as the PA-factor. The blue, green and red dots in the CIE space (right panel) represents pixels defend as pure red [255, 0, 0], green [0, 255, 0] and blue [0, 0, 255] (right panel).
Figure 2. Comparison of relative fluorescence intensity of cells with maxima quantum yield of PSII photochemistry (FV/FM). Relative change in fluorescence intensity of single cells were calculated from confocal images during 6 hours high light treatment (starting time: 0 min). Three fluorescence channels reflecting presence of 3 pigmented protein complexes were detected, namely: Photosystem II fluorescence – PSII (Red); Photosystem I fluorescence – PSI-YFP (Green); Phycobilisome fluorescence – PBS (Blue); these data were compared with bulk measurements of maximal quantum yield of PSII photochemistry FV/FM, after the same time of HL treatment. Panel A: Fluorescence intensities of PSII, PSI, and PBS detected from the single cell, data are normalized to fluorescence intensity of articular channel before HL treatment (t0). Panel (B); Fluorescence intensities of PSII, PSI, and PBS measured with single cells, data are normalized to the sum of fluorescence intensity at particular time for all channels.
Panel (C) Effect of HL treatment on FV/FM values (C). All error bars indicate standard deviation of the four biological replicates; the numerical values for microscopic measurements each replicate consisted from 20-100 cells.
Figure 3. Evolution of protein arrangement (PA) factor during high-light treatment of Synechocystis sp.
PCC 6803 cells. PA factor defines chromacity of the single cell in CIE1931 color space was calculated from 3
4 5 6 7 8 9 10 11 12 13 14 15 16 17 18 19 20 21 22 23 24 25 26 27 28 29 30 31 32 33 34 35 36 37 38 39 40 41 42 43 44 45 46 47 48 49 50 51 52 53 54 55 56
For Peer Review
RGB image of Synechocystis sp. PCC 6803 cells. Three fluorescence channels reflecting localization/concentration of 3 pigmented protein complexes in cells were detected, namely:
Photosystem II fluorescence – PSII (Red); Photosystem I fluorescence – PSI-YFP (Green); Phycobilisome fluorescence – PBS (Blue) (see descriptive scheme for additive color mixing). Obtained RGB image for calculation of PA factor (see Figure 1) were acquired from single cells exposed for particular time to high light (see red numbers) and PA factor was calculated from collected pictures (see Materials and Method). Panel A: Original confocal microscopy images used for calculation of PA factor from single cells at representative time points after HL treatment. Panel B: Evolution of protein arrangement (PA) factor during high-light treatment, red numbers represent HL exposure time (from 0 min to 360 min). The colored insert characterizes position of PA values presented in the graph in the overall CIE CIE1931 color space. The red, green and blue corners shows orientation of basic colors (Red for PSII; Green for PSI;
Blue for PBS) in the overall CIE CIE1931 color space. All error bars indicate standard error of the four replicates; each replicate consisted of 20-100 cells.
3 4 5 6 7 8 9 10 11 12 13 14 15 16 17 18 19 20 21 22 23 24 25 26 27 28 29 30 31 32 33 34 35 36 37 38 39 40 41 42 43 44 45 46 47 48 49 50 51 52 53 54 55
For Peer Review
Figure 1. Calculation of protein arrangement factor (PA-factor) from RGB images of cyanobacteria cells.
80x110mm (300 x 300 DPI)
3 4 5 6 7 8 9 10 11 12 13 14 15 16 17 18 19 20 21 22 23 24 25 26 27 28 29 30 31 32 33 34 35 36 37 38 39 40 41 42 43 44 45 46 47 48 49 50 51 52 53 54 55 56
For Peer Review
Figure 2. Comparison of relative fluorescence intensity of cells with maxima quantum yield of PSII photochemistry (FV/FM).
80x144mm (300 x 300 DPI)
3 4 5 6 7 8 9 10 11 12 13 14 15 16 17 18 19 20 21 22 23 24 25 26 27 28 29 30 31 32 33 34 35 36 37 38 39 40 41 42 43 44 45 46 47 48 49 50 51 52 53 54 55
For Peer Review
Figure 3. Evolution of protein arrangement (PA) factor during high-light treatment of Synechocystis sp. PCC 6803 cells.
166x82mm (300 x 300 DPI)
3 4 5 6 7 8 9 10 11 12 13 14 15 16 17 18 19 20 21 22 23 24 25 26 27 28 29 30 31 32 33 34 35 36 37 38 39 40 41 42 43 44 45 46 47 48 49 50 51 52 53 54 55 56