Pressure induced structural changes of proteins studied by infrared and fluorescence spectroscopy
Ph.D. Thesis
Somkuti Judit
Semmelweis University
School of Ph.D. studies, Basic Medicine
Supervisor: Dr. Smeller László, Ph.D., D.Sc.
Opponents: Dr. Páli Tibor, Ph.D., D.Sc.
Dr. Müllner Nándor, Ph.D.
Chairman of the Exam Committee: Dr. Monos Emil, M.D., Ph.D., D.Sc.
Members of the Exam Committee: Dr. Vásárhelyi Barna, M.D., Ph.D., D.Sc.
Dr. Kovács Mihály, Ph.D., D.Sc.
Budapest
2013
2
1. Introduction
Proteins have very important functions in living organisms, they are macromolecules having general and unique characteristics as well. The proper formation of protein structure is often critical to fulfill the various functions. The temperature and pH change, presence of organic and inorganic denaturing agents are known to influence the structure of proteins. The pressure is equally important thermodynamic parameter as temperature, which can also cause changes in the protein structure, but this is still much less investigated. A reason for this is the technical difficulties associated with the pressure testing. Another reason is that for inducing structural changes often very high pressure is required, outside the physiological range. However, we can learn more about the properties of proteins even if we examine them under not physiological conditions.
First, Bridgman reported results in 1914 about the effect of high pressure on protein structure. In his experiments he found that egg white is coagulated at high pressure (at room temperature). However, it was not clear that this seemingly similar coagulation is indeed the same what happens during cooking. After a long silence, examining the effect of high pressure re-started in the 1990’s, ever since there are researches about the possibilities of application as well. These include, for example dissociation of protein aggregates (or inclusion bodies and amyloid). High pressure can be used in the food industry for modification of the enzyme activity or inactivate microorganisms. In addition it can be used in the production of viral vaccines and has the ability to protect mammalian cells from damage during freezing. The discovery of recent years is that relatively low pressure treatment can ‘train’ the cells. Thus, for example microorganisms who survive the pressure treatment will be more resistant to other food technology treatment, or some pressure-treated vegetable seeds have higher yields.
Joining to these high pressure researches I investigated the properties of some selected proteins at different pressure and temperature parameters, mainly by infrared, to a lesser extent by fluorescence spectroscopy.
3
2. Aims
2.1. The major fish allergen parvalbumin (Gad m 1) represents an extremely abundant allergen in many fish species; therefore better understanding of its structural features can be very important. If we can irreversibly denature the protein in the rationally feasible pressure-temperature range these changes may lead to decreased allergenicity.
If the spectroscopic changes are associated with reduced level of IgE binding, this can open new perspectives for producing weakly allergenic or nonallergenic processed food.
Parvalbumin can be regarded as a model Ca2+-binding protein; therefore it is also interesting in terms of Ca2+-binding.
The main aims related to Gad m 1 parvalbumin:
examine the pressure induced structural changes and stability of Gad m 1 with ’in situ’ high pressure spectroscopic methods
reveal the pressure-temperature phase diagram, and determine the reversibility of the transitions
2.2. Pressure induced denaturation of protein is well known for a long time but there are unresolved questions about its mechanism. The pressure-temperature phase diagram is only known for a few proteins. From the diagram we can explore new properties of the protein especially if the diagram differs from the conventional Hawley-type elliptic phase diagram. We searched for proteins whose phase diagrams are potentially different from the usual.
The protein polyE is a fragment of the PEVK domain of the giant titin molecule. The PEVK was known to be intrinsically disordered, but recently there are some speculations that it may contain secondary structural elements. It was suggested that the protein may be ordered under atypical pressure-temperature values. The stability of the protein was studied by varying different parameters. My aim was to figure out if the following physical-chemical parameters can induce ordering in the structure of the fragment of PEVK:
varying the pD
increasing the pressure
increasing and decreasing the temperature
addition of kosmotropic agents
4
In comparison, another characteristic domain of titin, the Immunoglobulin 27 was also examined. It plays important role in the mechanical flexibility of muscle. The aims of the study were to detect the previously unknown isotropic pressure–dependent response and reveal the pressure-temperature phase diagram.
The Rv3221c protein from Mycobacterium tuberculosis has been published to be unstructured at room temperature, however, becoming ordered at higher temperature.
This property is interesting and suggests a phase diagram which is different from the usual, so my aim was to determine the pressure-temperature phase diagram of this protein as well.
3. Methods
PolyE and I27 fragments of titin were His6-tagged on the N terminus and inserted in a pET-28a vector between the NheI and XhoI cloning sites. The 171 residues long polyE fragment contains a tandem doublet of the 6769-6840 residue sequence, separated by an EcoRI cleavage site. Proteins were expressed in BL21 derivative Rosetta (DE3) pLysS competent cells (Merck) and purified on HisTrap FF (Ni2+ loaded) affinity column (GE Healthcare) by an ÄKTA FPLC (fast protein liquid chromatography) system under native conditions following manufacturer’s instructions. Further purification was performed on a HiTrap Q HP ion exchange column (GE Healthcare).
The other two proteins (Gad m 1 and Rv3221c) were available in lyophilized form.
The lyophilized proteins were dissolved at 75 mg/ml concentration in 1M Bis-Tris, pD=7 D2O buffers prior to the measurements.
We performed basically two kinds of experiments: pressure experiments (increasing pressure at constant temperature) and temperature experiments (increasing temperature at constant pressure).
For the infrared measurements a Bruker Vertex80v FTIR spectrometer equipped with a beam condenser and a high sensitivity MCT detector was combined with a high pressure diamond anvil cell (Diacell, Leichester, UK). The thickness of the gasket was
5
75 µm. This was indented before the measurement which resulted in an optical path length of 50 μm. 256 scans were collected at 2 cm-1 resolution. For determining pressure, BaSO4 was used. Temperature was controlled by a Eurotherm controller (typ 2216e, Durrington, UK) and measured with a thermocouple (OMEGA Engineering, Stamford, CT).
Fluorescence spectra were recorded by using a Fluorolog-3 (Horiba Jobin Yvon) spectrometer equipped with a custom-built temperature controller. Fluorescence spectra were measured as a function of temperature at atmospheric pressure. A 50 times smaller concentration of protein (1.5mg/ml) was used. The path length was 3 mm. Samples were excited at 290 nm and emission collected at 300-540 nm with 2 nm resolution.
The spectra were analyzed with the OPUS software (Bruker). The transitions were fitted with the Origin 7 software using the ‘non-linear curve fit’ function. The pressure- and temperature-induced transitions were fitted with the following formulae, respectively, either of which can be derived from the two-state transition model:
RT V p p
bp bp a
a p
y ( )
exp 1 )
(
2 / 1
for pressure transitions, and
2 / 1
1 exp 1
1 )
(
T T R
H bT bT a
a T
y
for temperature scans. Here y is the physical parameter to be fitted (e.g. position of a certain spectral line) a and b are the parameters describing the linear dependence of y(p) or y(T) below the transition, Δa and Δb are the changes of a and b during the transition, p1/2 and T1/2 are the transition midpoints, all the other symbols have their usual meaning.
The homology modeling was performed with the Swissmodel Protein Modeling Server.
(http://swissmodel.expasy.org)
6
4. Results
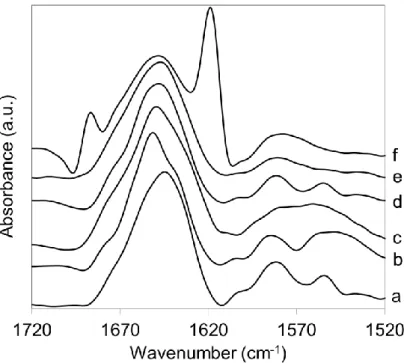
I measured the infrared spectra of the proteins at different pressure and temperature values and I have found the proteins in different structural phases. The typical spectra of Gad m 1 protein at different phases can be seen in figure 1.
Figure 1. Typical deconvoluted FTIR spectra of Gad m 1: a) without added Ca2+, 28 °C, atmospheric pressure (Ca2+ depleted form), b) with 0.2 M CaCl2, 28 °C, atmospheric pressure (native), c) 28 °C, 8.9 kbar (partially unfolded), d) 60 °C, atmospheric pressure (molten globule), e) 80 °C, 2 kbar (denatured), f) 90 °C, atmospheric pressure (aggregated).
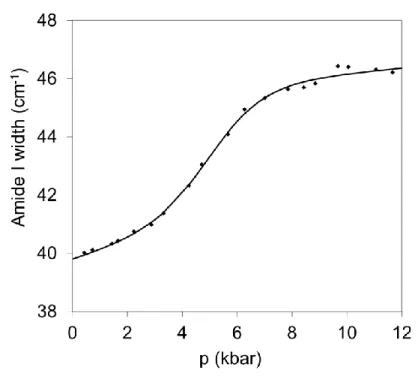
To study the phase transitions I plotted the characteristic spectral features (e.g. amide I maximum position, amide I width, integrated area under the peak) as the function of pressure (figure 2.) and temperature (figure 3).
7
Figure 2. Pressure induced transition in Gad m 1 at ambient temperature
Figure 3. Heat denaturation of Gad m 1 at atmospheric pressure
I determined the midpoints of the transitions by fitting sigmoid curves. I measured the spectra as the function of temperature at different constant pressures, and as the function of pressure at different constant temperatures. I fitted the transitions and I determined the pressure-temperature phase diagram of the proteins from the midpoints of the transitions.
8
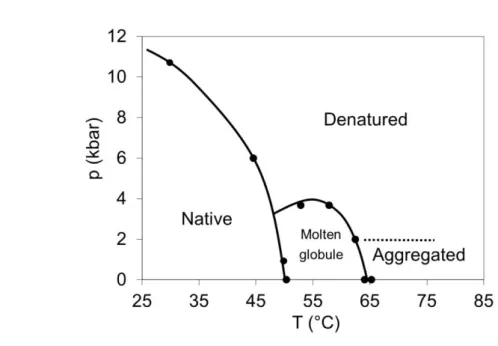
From the analysis of the spectra at different pressure-temperature values I received the following pressure-temperature phase diagram for Gad m 1 parvalbumin, titin Immunoglobulin 27 and Rv3221c (figure 4-6.). The polyE fragment of titin preserved its disordered structure at every examined pressure-temperature value.
Figure 4. Pressure-temperature phase diagram of Gad m 1 parvalbumin
Figure 5. Pressure-temperature phase diagram of titin Immunoglobulin 27
9
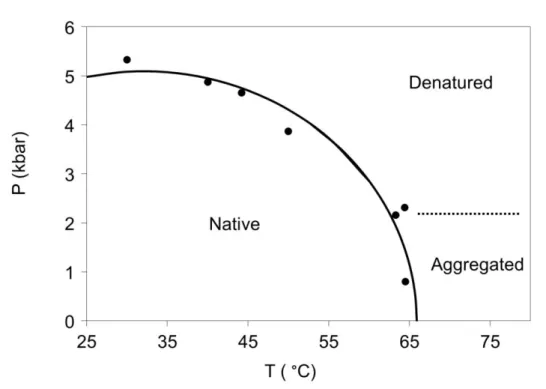
Figure 6. Pressure-temperature phase diagram of Rv3221c from Mycobacterium tuberculosis
10
5. Conclusions
5.1. Parvalbumin
According to the infrared spectra as well as on the basis of homology modeling Gad m 1 consists of 50% alpha helices, in addition loops and unordered elements.
In its Ca2+-depleted form parvalbumin is mainly disordered, it contains approximately 5% helices which unfold at 2 kbar.
As the function of temperature there are two transitions; the first (at 50 °C) leads to a molten globule-like state, during the second transition (at 75 °C) the protein become totally unfolded. The denaturation is followed by aggregation at atmospheric pressure; however 2 kbar pressure was enough to protect the protein from aggregation.
As the function of pressure (at room temperature) there is a transition (at 5.2 kbar) which leads to a partially unfolded state. At 40 °C we observed two transitions as the function of pressure: at 4.8 kbar the protein transformed into a partially unfolded state and lost one of its Ca2+ ions, at 11.4 kbar it became totally unfolded. At 55 °C these pressure values were lower (2.2 kbar and 8.9 kbar).
The protein contains two Ca2+ ions in the native and molten globule-like states, one Ca2+ ion in the partially unfolded state and it does not bind any Ca2+ in the denatured and aggregated states.
The denaturation due to heat treatment is irreversible while the transitions due to pressure proved to be reversible.
We determined the pressure-temperature phase diagram of Gad m 1 (figure 4.) revealing five distinct states; therefore it is not very similar to the two-state Hawley’s diagram. Besides the normally observable native, unfolded and aggregated states, we obtained a molten globule and a partially unfolded state.
11 5.2. Titin
5.2.1. PolyE
PolyE preserves its disordered characteristics across a wide range of pressure (0-16 kbar), temperature (0-100 °C), pD (3-10.5) and in different cosmotropic solvents (CaCl2, KNO3, glycerol, TMAO).
5.2.2. Immunoglobulin 27
Based on the infrared spectra titin Immunoglobulin 27 contains mainly beta sheets. This agrees well with the literature and the results of the homology modeling.
Upon pressure treatment, titin Immunoglobulin 27 unfolds at 10.5 kbar at 30 °C and at 0.9 kbar at 50 °C.
The pressure induced denaturation is reversible in 95%, at atmospheric pressure the protein refolds.
Two transitions can be observed as temperature is raised. A loosening of the secondary structure and formation of a molten globule state is observed with a midpoint of 50 °C. The protein completely unfolds at 65 °C. Unfolding is followed by aggregation at ambient pressure. Moderate pressures (>2 kbar), however, can prevent the protein from aggregation.
The resulting aggregate after the heat treatment was subjected to pressure treatment.
85% of the aggregate dissociate at high pressure and 50% remained dissociated after the pressure treatment, returning to atmospheric pressure.
Detailed temperature-pressure phase diagram of titin Immunoglobulin 27 was determined (figure 5.), which contains molten globule and aggregated states besides the usual native and unfolded ones. Irreversibility of the aggregation process at low pressures leads to appearance of metastable regions in the phase diagram.
12 5.3. Rv3221c
The amide I band of Rv3221c can be resolved into two main components, the peak at 1637 cm-1 is characteristic of the beta sheet, the peak 1652 cm-1 of the biotin binding.
Upon pressure treatment (at room temperature) the protein unfolds in one step at 5.3 kbar. After a pressure cycle only a fraction of the protein refolds to the original state, the rest forms pressure sensitive aggregates.
Upon heat treatment the Rv3221c unfolded with a midpoint of 64.4 °C, and then became aggregated. The transition was irreversible.
The pressure-temperature phase diagram of Rv3221c was determined (figure 6.), which fits very well to the elliptic shape predicted by the Hawley’s theory.
13
6. List of publications
Publications related to the current Ph.D. thesis:
1. Somkuti J, Bublin M, Breiteneder H, Smeller L. (2012) Pressure-temperature stability, Ca2+ binding, and pressure-temperature phase diagram of cod parvalbumin: Gad m 1. Biochemistry, 51:5903-5911.
2. Somkuti J, Martonfalvi Z, Kellermayer MS, Smeller L. (2013) Different pressure-temperature behavior of the structured and unstructured regions of titin.
Biochim Biophys Acta, 1834:112-118.
3. Somkuti J, Jain S, Ramachandran S, Smeller L. (2013) Folding-unfolding transitions of Rv3221c on the pressure-temperature plane. High Press Res, 33:250-257.
Publications not related to the current Ph.D. thesis:
1. Somkuti J, Houska M, Smeller L. (2011) Pressure and temperature stability of the main apple allergen Mal d1. Eur Biophys J, 40:143-151.
2. Somkuti J, Smeller L. (2013) High pressure effects on allergen food proteins.
Biophys Chem, 183:19-29.