1 Application of 4-amino-N-adamantylphthalimide solvatochromic dye for fluorescence
microscopy in selective staining of lipid droplets and mitochondria
Patricia Benčić,a Leo Mandić,b Iva Džeba,c Ivana Tartaro Bujak,c László Biczók,d Branka Mihaljević,c Kata Mlinarić-Majerski,b Igor Weber,e Marijeta Kralja* and Nikola Basarićb*
a Division of Molecular Medicine, Ruđer Bošković Institute, Bijenička cesta 54, 10 000 Zagreb, Croatia. E-mail, MK: marijeta.kralj@irb.hr
b Department of Organic Chemistry and Biochemistry, Ruđer Bošković Institute, Zagreb, Croatia. E-mail, NB: nbasaric@irb.hr
c Division of Materials Chemistry, Ruđer Bošković Institute, Zagreb, Croatia
d Institute of Materials and Environmental Chemistry, Research Centre for Natural Sciences, , Hungarian Academy of Sciences, 1519 Budapest, P.O. Box 286, Hungary
e Division of Molecular Biology, Ruđer Bošković Institute, Zagreb, Croatia
Graphical abstract
2 Abstract: 4-Amino-N-adamantylphthalimide (1) is a dye with moderate absorptivity (in CH3CN ε363 = 4200 M-1 cm-1) and high quantum yield of fluorescence (ΦF = 0.15-0.80) that exhibits fluorosolvatochromic properties. The dye can be excited at 405 nm and the position of fluorescence maximum and the Stokes shift are well correlated with the ET(30) parameter. The excitation in the near-visible part of the spectrum and low cytotoxicity allow use of the dye in live cell microscopy. Due to its amphiphilic character, the dye stains artificial membranes in liposomes. Using confocal microscopy on two human cancer cell lines, we have shown that 1 binds primarily to intracellular lipid droplets. Colocalization experiments with different organelle markers indicated that 1 additionally binds to mitochondrial membranes. The fluorosolvatochromism of 1 allows the simultaneous visualization of mitochondria and intracellular lipid droplets in two separate emission channels, which has a potential use in cells and tissues exhibiting intense oxidative metabolism of lipids.
Key words: aminophthalimide, biological membranes, fluorescent dyes, confocal fluorescence microscopy, nonpolar lipids
1. Introduction
Fluorescence spectroscopy is an important analytical tool used for numerous applications in chemistry and biology.[1] In particular, research in biomedicine was significantly facilitated by use of fluorescence microscopy and organic dyes that allow for the specific targeted staining of intracellular organelles, or probing different intracellular analytes.[2] Although a large number of dyes is already being used, there is a continuing pursuit for new chromophores with potential use
3 in microscopy. Suitable dyes have to fulfil numerous demands including tunable spectral properties, good photophysical properties and photochemical stability, no cytotoxicity, and selectivity in staining specific intracellular targets or processes. Important targets are cellular and intracellular membranes, which delineate different organelles such as mitochondria, Golgi apparatus, or endoplasmic reticulum. It is highly desirable to develop new organic dyes that selectively stain only one type of intracellular membranes, which is generally a difficult task due to a similar structure and chemical composition of these membranes.
The common organic dyes used for membrane staining are DPH (1,6-diphenyl-1,3,5- hexatriene),[3] Nile red, Texas red, or pyrenes connected to lipids.[1,2] Moreover, for the measurement of local polarity, viscosity, temperature or phase transition in membranes, organic dyes that undergo photoinduced charge transfer (CT) upon photoexcitation are often employed.[1,2] The CT chromophores are commonly push-pull conjugated organic molecules bearing electron-donating and electron-withdrawing groups. The commercial dyes include ANS
(1-anilino-8-naphthalenesulfonate),[4] PRODAN (6-propionyl-2-
(dimethylaminonaphthalene)),[5] and LAURDAN (2-dimethylamino-6-lauroylnaphthalene).[6]
More recent examples include BODIPY derivatives which were investigated as molecular rotors that enable measurement of viscosity and temperature in membranes, and are particularly useful in FLIM (fluorescence lifetime imaging microscopy).[7,8] Furthermore, a number of different CT dyes have recently been reviewed with respect to their applicability in fluorescence microscopy for the staining of lipid droplets.[9]
4-Aminophthalimide is a fluorescent chromophore whose lowest singlet excited state (S1) has a CT character.[10] Generally, the substitution of imides by electron-donating groups changes photophysical properties,[11] whereas non-substituted N-alkylphthalimide derivatives are
4 characterized by short singlet excited state lifetimes [12,13] (e.g. N-methylphthalimide, τ = 0.2 ns)[14] and high quantum yields of intersystem crossing to the triplet manifold (ΦISC = 0.5- 1.0).[15] In the triplet excited state, phthalimides undergo different photochemical reactions involving H-abstraction, single electron transfer and cycloaddition.[16] Due to the CT character of the S1 state, 4-aminophthalimide is a highly fluorosolvatochromic.[17] Moreover, upon increasing solvent H-bond donor ability the fluorescence of 4-aminophthalimide is quenched.[18] Due to its high values of fluorescence quantum yield, 4-aminophthalimides were used in the cation [19] and anion sensing, [20,21,22] design of logic gates,[23] or for the labelling of nucleosides for the study of DNA-protein interactions.[24] Herein, we present the spectral and photophysical characterization of 4-amino-N-adamantylphthalimide (1), and its use in fluorescence microscopy. The bulky lipophilic adamantyl substituent of phthalimide chromophore renders the molecule amphiphilic and useful in the staining of intracellular membranes. To date, the adamantyl derivative 1 has been prepared for the investigation of antiviral activity.[25,26] Furthermore, Wintgens et al. reported a photophysical investigation for a series of 4-amino-N-alkylphthalimides and their binding to β-cyclodextrin.[27] However, a detailed photophysical study for 1 by steady-state and time-resolved fluorescence, its use in fluorescence sensing or confocal microscopy have not been reported.
2. Materials and Methods
General. 1H and 13C NMR spectra were recorded on a Bruker Spectrometer at 300, or 600 MHz (75 MHz and 150 MHz) at 25 °C using TMS as a reference and chemical shifts were reported in ppm. IR spectra were recorded on a FT-IR-ABB Bomem MB 102 spectrophotometer in KBr, and the characteristic peak values are given in cm-1. HRMS were obtained on an Applied Biosystems
5 4800 Plus MALDI TOF/TOF instrument (AB, Foster City, CA). Melting points were determined using a Köfler Mikroheiztisch apparatus (Reichter, Wien) and were not corrected. Silica gel (0.05–0.20 mm) was used for chromatographic purifications. Chemicals were purchased from the usual commercial sources and were used as received. Solvents for chromatographic separations were used as delivered from the supplier (p.a. or HPLC grade) or purified by distillation (CH2Cl2). Dry CH2Cl2 was obtained after standing of commercial product over anhydrous MgSO4 overnight, then filtered and stored over 4Å molecular sieves. Dry methanol was obtained by standard Mg-methoxide method and stored over 3Å molecular sieves.
2.1. 4-Nitro-N-adamantylphthalimide (2)
A flask (50 mL) was charged with 4-nitrophthalic anhydride (3.25 g, 16.8 mmol). Upon heating by an oil bath to 170-180 °C, the anhydride melted. To the melt, 1-aminoadamantane (1.23 g, 8.1 mmol) was added in several portions. The reaction mixture was heated 15 min with a stopper, and 15 min without the stopper to remove water. To the cooled reaction mixture, CH2Cl2 (100 mL) was added, and the solution washed with 1 M HCl (2 × 20 mL). The washed organic layer was dried over anhydrous MgSO4, filtered and the solvent was removed on a rotary evaporator.
The crude reaction mixture was purified by column chromatography on SiO2 using CH2Cl2 as an eluent to afford the pure product (1.53 g, 58%).
Colorless crystals, mp 180 - 182 °C; IR (KBr) νmax/cm-1: 3105, 2917, 2853, 1706, 1543, 1341, 1321, 1304, 1085, 720; 1H NMR (DMSO-d6, 300 MHz) δ/ppm: 8.59 (dd, J = 8.1, 1.9 Hz, 1H, H- 6'), 8.38 (d, J = 1.9 Hz, 1H, H-4'), 8.02 (d, J = 8.1 Hz, 1H, H-7'), 2.45 (d, J = 2.6 Hz, 6H, H-2), 2.13 (br s, 3H, H-3), 1.62 - 1.78 (m, 6H, H-4); 13C NMR (DMSO-d6, 75 MHz) δ/ppm: 167.4 (s, C-2'/C-9'), 167.1 (s, C-2'/C-9'), 151.4 (s, C-5'), 135.9 (s, C-8'), 132.6 (s, C-3'), 129.4 (d, C-7'),
6 124.1 (d, C-6'), 117.3 (d, C-4'), 60.2 (s, C-1), 39.5 (t, 3C, C-2), 35.7 (t, 3C, C-4), 29.1 (d, 3C, C- 3); HRMS calcd for [C18H18N2O4+H]+ 327.1345, observed 327.1345.
2.2. 4-Amino-N-adamantylphthalimide (1)
4-Nitro-N-adamantylphthalimide (1.22 g, 3.74 mmol) was dissolved in a mixture of dry CH2Cl2
(25 mL) and MeOH (25 mL). To the solution, Pd/C (10%, 240 mg, n(Pd) = 0.23 mmol) was added. The mixture was stirred over 1 day at rt under balloon of H2. The catalyst was filtered off by use of a blue ribbon filter paper and washed with MeOH (50 mL). The solvent was removed on a rotary evaporator and the residue was chromatographed on a column of silica gel using CH2Cl2/EtOAc (10%) as eluent to afford the pure product (800 mg, 72%).
Yellowish crystals; mp 191 - 193 °C; IR (KBr) νmax/cm-1: 3469, 3367, 2907, 2854, 1756, 1686, 1630, 1499, 1375, 1332, 1302, 1072, 751, 634; 1H NMR (DMSO-d6, 300 MHz) δ/ppm: 7.37 (d, J
= 8.1 Hz, 1H, H-7'), 6.81 (d, J = 1.9 Hz, 1H, H-4'), 6.76 (dd, J = 8.1, 1.9 Hz, 1H, H-6'), 6.36 (br s, 2H, NH2), 2.40 (d, J = 2.5 Hz, 6H, H-2), 2.08 (br s, 3H, H-3), 1.60 - 1.76 (m, 6H, H-4); 13C NMR (DMSO-d6, 75 MHz) δ/ppm: 169.5 (s, C-2'/C-9'), 169.4 (s, C-2'/C-9'), 154.8 (s, C-5'), 134.1 (s, C-3'), 124.2 (d, C-7'), 117.0 (d, C-6'), 116.7 (s, C-8'), 106.0 (d, C-4'), 58.6 (s, C-1), 39.8 (t, 3C, C-2), 35.8 (t, 3C, C-3), 29.1 (d, 3C, C-4); HRMS calcd for [C18H20N2O2+H]+ 297.1603, observed 297.1609.
2.3. UV-vis and fluorescence measurements
The absorption and fluorescence spectra were measured on a PG T80/T80+ and a Cary Eclipse Varian spectrometers, respectively. For the fluorescence measurements, the samples were excited at 345, 350 and 355 nm and the slits were set to a bandpass of 2.5 nm. The fluorescence
7 spectra were recorded in the range 370-700 nm. All solvents used for the measurements were of spectral grade quality. Prior to the measurements, the solutions were purged with N2 15 min. The measurements were conducted at 20 ºC. For the determination of fluorescence quantum yields a solution of quinine sulfate in 0.5 M H2SO4 was used (ΦF = 0.55).[28] Three spectra were measured by exciting at three different wavelengths and the mean value of the quantum yield was calculated (by use of Eq. S1 in the ESI).
The lifetimes of the singlet excited state were measured by time-correlated single photon counting (SPC) method on a previously described instrument.[29] The samples were excited by a Picoquant diode laser (pulse duration ∼70 ps, wavelength 372 nm) and the decays were detected with a Hamamatsu R3809U-51 microchannel plate photomultiplier, which was connected to a Picoquant Timeharp 100 electronics (36 ps/channel time resolution). The instrument response function (IRF), obtained using silica gel in H2O as the scatterer, had a half width of ≈ 0.4 ns. The decays were analyzed by sum of exponentials (Eq. S2. in the ESI) using Picoquant FluoFit software. The fitting parameters (decay times and pre-exponential factors) were determined by a nonlinear least-squares deconvolution method minimizing the reduced chi-square χ2. The quality of the fits was judged by χ2 < 1.2 and the random distribution of the weighted residuals.
2.4. Preparation of liposomes
1,2-Dipalmitoyl-sn-glycero-3-phosphocholine (DPPC) was dissolved in chloroform (0.5 and 5.0 mg/mL) and dried under nitrogen. The lipid films were kept under vacuum at rt overnight. The liposome suspension was prepared by vortexing lipid films with a PBS solution. The size of the DPPC large unilamellar vesicles was reduced by sequential extrusion of the multilamellar vesicles through polycarbonate membranes of 400 and 200 nm after five freezing and thawing
8 cycles. A small aliquot of 1 was incubated into the liposome suspension at 50 °C for 60 min and let cool down to rt before conducting the measurements.
2.5. Dynamic Light Scattering (DLS)
Hydrodynamic diameter of the liposomes was measured using Zetasizer Nano ZS (Malvern Instruments, UK) equipped with a 532 nm laser. The intensity of the scattered light was detected at an angle of 173°. All measurements were conducted at 25 °C. The particle size was reported as volume weighted distribution and represented as the average size value of nine measurements.
All data processing was done by the Zetasizer software 7.12 (Malvern Instruments).
2.6. Cell culture
Human lung carcinoma cells NCI-H460 and breast cancer cells MCF-7 were grown in RPMI- 1640 medium with the addition of 10% fetal bovine serum (FBS), 2 mM L-glutamine, 100 U/mL penicillin and 100 µg/mL streptomycin, and cultured as monolayers at 37°C in a humidified atmosphere with 5% CO2.
2.7. Cell viability assay
Cell viability assay was performed as described previously.[30] Cells were seeded at 2×10³ cells/well in a standard 96-well microtiter plates and left to attach for 24 h. Next day, test compound was added in five serial 10-fold dilutions. The cell growth rate was evaluated after 72 h of incubation, using MTT assay. Obtained results are expressed as IC50 value which stands for the concentration of the compound necessary for 50% of growth inhibition. The IC50 values are calculated from concentration-response curve using linear regression analysis.
9 2.8. Sample preparation and staining for microscopy
The cells were seeded onto glass coverslips at a density of 40000 cells/coverslip, left to attach and next day the growth medium was replaced with 1 at the concentration of 10-6 M in PBS. For live cell imaging, after different incubation periods (see SI) coverslips were rinsed three times with PBS and immediately analyzed. For immunofluorescence analysis, the slides were fixed with 4% paraformaldehyde (PFA) for 15 min. After thorough rinsing, cells were permeabilised with 0.1% Triton™ X-100 in PBS and incubated for 15 min at rt. Next, the cells were incubated in blocking solution (4% bovine serum albumin (BSA) in PBS) for 60 min. Slides were then incubated with primary antibodies diluted in blocking solution overnight at 4 °C in a humidified atmosphere (for Golgi complex: Rabbit anti human Mannosidase II AHP674, Bio-Rad Laboratories, Inc, 1:100; for endoplasmic reticulum and endoplasmic reticulum - Golgi intermediate complex: mouse anti KDEL-R 421400, Calbiochem, 1:100). The next day, after thorough rinsing, cells were incubated with the appropriate AlexaFluor™568-conjugated secondary antibody (AlexaFluor™568-conjugated goat anti-rabbit and goat anti-mouse antibodies (ThermoFisher Scientific, A-11036 and A-11031, respectively); diluted 1:400, for 60 min at rt, protected from light, followed by rinsing with PBS. Thereafter, cells were treated with 1 for 30 min at rt. Finally, the coverslips were mounted and stored, protected from light, at 4 °C.
For mitochondrial staining, an organelle-selective dye (MitoTracker® Deep Red FM) was used at the concentration of 200 nM in PBS. For this purpose, cell medium was removed from cells, and replaced with the pre-warmed staining solution. The samples were incubated for 15 min under growth conditions, after which the MitoTracker®-dilution was removed and the cells were rinsed thoroughly with PBS. The procedure for fixation and permeabilization was the same as
10 described above, however, after treatment with Triton ™ X-100, the cells were immediately stained with 1 (10-6 M in PBS). The coverslips were mounted and stored, protected from light, at 4°C. In order to stain non-polar cellular lipids, including lipid droplets, Nile red (9-diethylamino- 5H-benzo[a]phenoxazine-5-one) was used.[31] For colocalization experiments, the cells were stained with a dilution of Nile red at 100 ng/mL in PBS, as described previously.[32] The Nile red staining solution was applied to the cells only after staining with compound 1, independent of previous treatment, for 10 min at rt. After rinsing, samples could be further processed.
2.9. Confocal microscopy and colocalization analysis
Confocal fluorescence microscopy was performed using Leica TCS SP8 X microscope equipped with a HC PL APO CS2 63×/1.4 oil objective (Leica Microsystems, Germany). The excitation and emission wavelengths were the following: λex/em (1, blue emission) = 405 nm / 410-455 nm, λex/em (1, green emission) = 405 nm / 485-540 nm, λex/em (AlexaFluor™568) = 568 nm / 584-638 nm, λex/em (MitoTracker® Deep Red FM) = 644 nm / 665-727 nm, λ ex/em (Nile red) = 540 nm / 579-631 nm. Colocalization analysis was performed based on images of fixed cells after pairwise staining with 1 and organelle-specific markers (see above). To quantify colocalization of 1 with the counterstained intracellular structures, lipid droplets, mitochondria and the Golgi apparatus, we computed the Manders' Colocalization Coefficient (MCC) that estimates the fraction of the signal corresponding to 1 localized in the structures labelled with the respective organelle- specific markers.[33] The analysis was conducted using the tools Chromatic Aberration Correction, Costes Background Subtraction, and Colocalization Analysis available in Huygens Professional image processing program (Scientific Volume Imaging, Netherlands).
11 3. Results
3.1. Synthesis
Aminophthalimide derivative 1 [25,26] was prepared in a moderate yield in a two-step synthetic procedure. In the first step, nitrophthalic anhydride was condensed with 1-aminoadamantane to afford 2.[25] In the second step, the nitro group in 2 was reduced by hydrogenation over Pd/C at atmospheric pressure (Scheme 1).
NH2 +
-H2O N
O
O
NO2 O
O
O O2N
2 (58%)
1 (72%) H2
1 Pd/C
3 2 4
2' 3' 4' 5'
6' 8' 7'
9' N
O
O
NH2
1 3 2 4
2' 3' 4' 5'
6' 8' 7'
9'
Scheme 1. Synthesis of fluorescent dye 1.
3.2. Photophysical properties
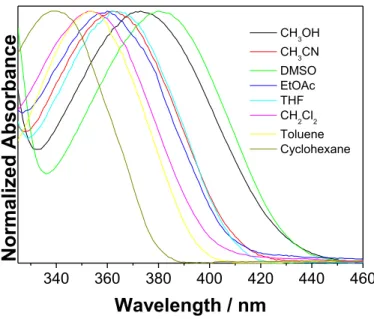
It is generally known that 4-aminophthalimide derivatives have S1 state of CT character and solvatochromic properties.[10,17,18] To test the solvatochromic properties of adamantyl derivative 1, which are important for its use in confocal microscopy, we measured the absorption and fluorescence spectra in different solvents (Figs. 1 and 2, and Table 1 and Fig S1 in the SI).
Generally, an increase of the solvent polarity induces bathochromic shifts in both absorption and fluorescence spectra. However, the shifts in the absorption spectra cannot be correlated with the solvent polarity or polarizability. The most pronounced bathochromic shift was observed in DMSO solution, probably due to the H-bonding of the DMSO molecules with the phthalimide NH2 group, which enhanced the electron density on the amine nitrogen in the ground state (S0), and the CT character of the excitation. Large, but less pronounced is the bathochromic shift
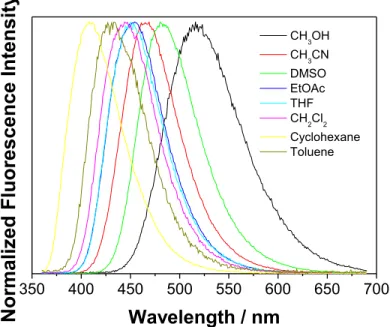
12 induced by methanol which forms H-bonds with the phthalimide carbonyl groups, and in that way affects the CT character of the transition. On the contrary to the absorption, the solvatochromic shifts in the emission spectra generally follow the trend of the Lippert solvent polarity factor [34,35] but with a poor correlation (see Fig. S4 in the SI). A better correlation was obtained between the emission maxima with the Reichardt ET(30) parameter (Fig. S5 in the SI),[36] and particularly well correlated were the Stokes shifts with ET(30) (Fig. S6 in the SI).
However, the data for DMSO solution deviated from the trend, probably due to the specific solvatochromic effects imposed by the H-bonding in S0.
340 360 380 400 420 440 460
Normalized Absorbance
Wavelength / nm
CH3OH CH3CN DMSO EtOAc THF CH2Cl2 Toluene Cyclohexane
Fig. 1. Normalized absorption spectra of 4-amino-N-adamantylphthalimide (1) in different solvents at room temperature.
13
350 400 450 500 550 600 650 700
CH3OH CH3CN DMSO EtOAc THF CH2Cl2 Cyclohexane Toluene
Normalized Fluorescence Intensity
Wavelength / nm
Fig. 2. Normalized fluorescence spectra of 4-amino-N-adamantylphthalimide (1) in different solvents at room temperature (λexc = 350 nm).
Table 1. Spectral properties of 1.
Solvent λmax(abs) nma
λmax(em) nmb (cm-1)
Stokes shift c cm-1
εR d f(n2) e Δf f ET(30) g kcal mol-1
Cyclohexane 340 408 (24270)
5140 2.023 0.204 -0.001 31.2
Toluene 353 433
(22990)
5340 2.379 0.226 0.013 33.9
CH2Cl2 353 444
(22220)
6110 8.93 0.203 0.219 41.1
THF 362 450
(22070)
5550 7.58 0.198 0.267 37.4
14
EtOAc 360 454
(21930)
5850 6.09 0.185 0.270 38.1
CH3CN 362 469
(21320)
6300 35.94 0.175 0.306 46.0
CH3OH 373 516
(19120)
7690 32.66 0.169 0.309 55.5
DMSO 380 480
(20490)
5830 46.45 0.221 0.265 45.0
a The maximum in the absorption spectrum. b The maximum in the emission spectrum. The maximum in the wavenumber scale, obtained by multiplying the intensities at nm scale with λ2, is given in parenthesis. c The Stokes shift νabs/cm-1-νem/cm-1. d The relative permittivity. e Solvent polarizability factor dependent on the refractive index n; 𝑓(𝑛2) = (𝑛2− 1)/(2𝑛2+ 1). f The Lippert factor Δ𝑓 = 𝑓(𝜀) − 𝑓(𝑛2) = 𝜀−1
2𝜀+1− (𝑛2−1)
(2𝑛2+1). g The Reichardt solvent polarity factor taken from ref [36].
Absorption and fluorescence spectra were also measured in aqueous solution containing PBS buffer at different concentrations of 1 to probe for the aggregation of the dye (Fig S2 and S3 in the SI). In the absorption spectrum of 1 at the concentration 10-4 M an increase of the baseline was observed due to light scattering by insoluble nanocrystals of 1. Furthermore, fluorescence spectrum at 10-4 M has a maximum at ≈463 nm, whereas at lower concentration < 10-5 M, the maximum was observed at ≈545 nm. The fluorescence measurements suggest that the dye starts to aggregate at the concentration 10-5 M, whereas at the concentration 10-6 M, the aggregation is negligible.
Fluorescence quantum yields (ΦF) were determined by use of quinine sulfate in 0.5 M H2SO4
(ΦF = 0.55),[28] and the singlet excited state lifetimes by SPC (Table 2). The ΦF generally
15 ranges between 0.17 and 0.85 and does not follow any trend with polarity. The fluorescence decays were fit to monoexponential function for all solvents except for toluene where a sum of two exponentials was used (See Figs. S7-S13 in the SI). The lifetimes (τ) are relatively long and range between 9.5 and 24.6 ns. From the lifetimes and the ΦF, the radiative rate constant kF = ΦF/τ can be calculated, which does not change with the solvent, except for methanol where the quenching of fluorescence due to the H-bonding takes place, in accord with literature precedent.[14]
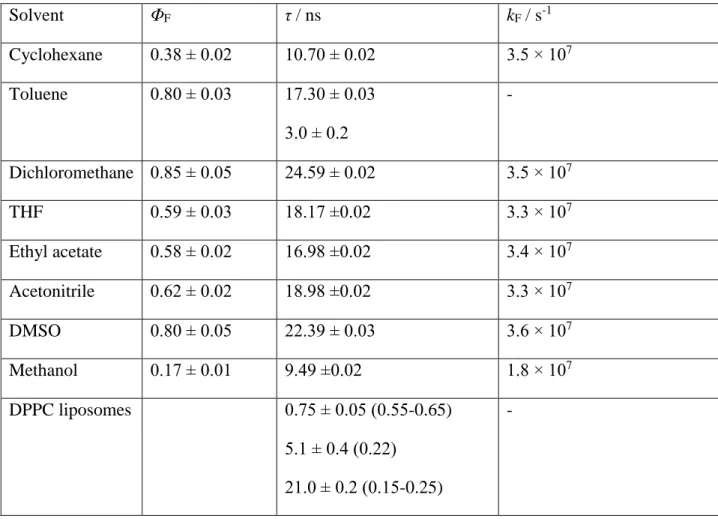
Table 2. Quantum yields of fluorescence (ΦF),a singlet lifetimes (τ / ns)b and radiative rate constant kF = ΦF/τ for 1 in different solvents.
Solvent ΦF τ / ns kF / s-1
Cyclohexane 0.38 ± 0.02 10.70 ± 0.02 3.5 × 10⁷
Toluene 0.80 ± 0.03 17.30 ± 0.03 3.0 ± 0.2
-
Dichloromethane 0.85 ± 0.05 24.59 ± 0.02 3.5 × 10⁷
THF 0.59 ± 0.03 18.17 ±0.02 3.3 × 10⁷
Ethyl acetate 0.58 ± 0.02 16.98 ±0.02 3.4 × 10⁷
Acetonitrile 0.62 ± 0.02 18.98 ±0.02 3.3 × 10⁷
DMSO 0.80 ± 0.05 22.39 ± 0.03 3.6 × 10⁷
Methanol 0.17 ± 0.01 9.49 ±0.02 1.8 × 10⁷
DPPC liposomes 0.75 ± 0.05 (0.55-0.65) 5.1 ± 0.4 (0.22)
21.0 ± 0.2 (0.15-0.25)
-
16
a Measured using quinine sulfate in 0.5 M H2SO4 (ΦF = 0.55)[28] as a reference. An average value is reported from single experiment by excitation at three wavelengths. The errors quoted correspond to maximum absolute deviations (see experimental). b Determined by time-correlated SPC (see experimental). Amplitudes are given in parenthesis.
In order to test the ability of 1 to stain cellular membranes and lipid inclusions, we tested its capacity to be incorporation into liposomes. The liposome suspensions containing DPPC and 1 were prepared following the procedure described in literature.[37] The size of the liposomes was determined by dynamic light scattering (DLS), and the absorption and fluorescence spectra were measured, as well as decays of fluorescence. An average nanoparticle size with the size distribution percentage of more than 80% confirmed the homogeneous liposomes in DPPC concentrations used (Fig. S15 and Fig. S18 in the SI). Interestingly, the DLS measurements indicated that the concentration of 1 affects the size of liposomes. At lower concentrations when the dye is not aggregated (< 10-6 M), 1 reduces the size of liposomes (Table S1 in the SI), whereas at higher concentrations, polydispersion and the aggregation of liposomes take place.
The aggregation of the DPPC liposomes due to the presence of amphiphilic adamantyl compounds has been reported.[38] However, polydispersion of liposomes observed by DLS may partly be due to the aggregation of 1.
The absorption spectrum of 1 in the suspension of DPPC liposomes has a maximum at 375 nm and the emission maximum is located at 490 nm (Fig. S14 in the SI). The position of the emission maximum suggests that 1 in the liposome is positioned with the fluorophore exposed to a microenvironment whose polarity is similar to DMSO or CH3CN. Note that the fluorescence spectrum of 1 in PBS at the concentration used for the liposomes labeling (6×10⁻⁷ M) has a maximum at ≈543 nm, without the band at 463 nm corresponding to the aggregated dye.
17 However, fluorescence decay for the solution containing liposomes was fit to a sum of three exponentials. We tentatively assign these three decay times to 1 located in different environments. The most dominant decay component is the one with the shortest decay time, probably corresponding to the chromophore being in the proximity to the polar groups of the DPPC bilayer. The decay time of ≈ 5 ns probably corresponds to the 1 exposed to H2O, whereas the longest decay time is probably due to 1 being deep inside the lipophilic DPPC bilayer.
The steady state and time-resolved fluorescence measurements suggest that 1 is incorporated in the lipid bilayer, most probably in the way where the lipophilic adamantyl group is deep in the nonpolar environment of the bilayer, whereas the chromophore is at the polar surface of the bilayer or exposed to H2O. A similar orientation of aminophthalimide chromophore in micelles with the chromophore oriented to H2O has been reported.[39]
3.3. Influence on cell viability
Prior to investigating the ability of 1 to enter the cell and its intercellular distribution, we tested its influence on cell viability, i.e. potential cytotoxicity. It was shown that the 72 h treatment of NCI-H460 is nontoxic at the concentration range 0.01 µM - 10 µM, while the compound is cytotoxic at the concentration of 100 µM (Fig S35). The calculated IC50 concentration for NCI- H460 cell line is 17 µM.
3.4. Fluorescence microscopy
Confocal laser scanning microscopy was used to assess the intracellular distribution of 1. No autofluorescence was detected by examining untreated cells under typical imaging conditions in all channels (data not shown). Live cells were treated with various concentrations of 1 (10-8 to
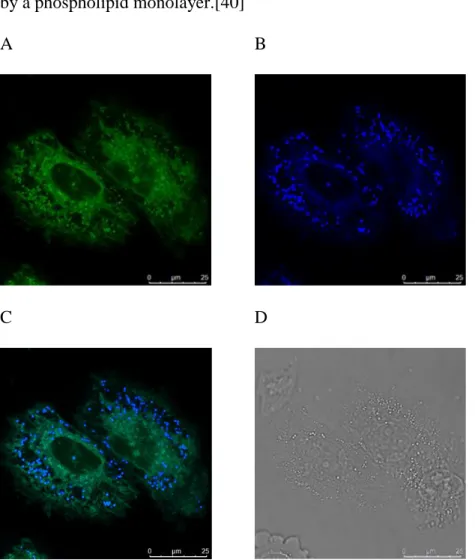
18 10-4 M) from 20 min to 24 h in order to determine the optimal treatment protocol that should not cause cell damage and result in high-contrast images (Figs. S25-S27). Because of the solvatochromic nature of dye 1 emitting over a wide range of wavelengths, we used two emission channels to detect its fluorescence. Distinct intracellular structures were readily visualized in blue (410-455 nm) and green (485-540 nm) detection channels after incubation with 1 µM 1 for as short as 20 min (Fig. S28), and longer incubation periods significantly improved the fluorescent signal (Fig. 3). Appearance of the stained structures was generally independent of working concentrations of 1. Since an optimal visualization was obtained by the treatment with 1 at 10-6 M, where no cytotoxicity was detected, this concentration was used in all further experiments.
Compound 1 appeared to stain two types of intracellular structures - a reticular, probably membranous staining pattern distributed throughout the cellular environment, and numerous distinct spherical structures. Inspection of labelled cells by optical sectioning made evident that 1 does not enter the nucleus and does not label the cell plasma membrane. Fluorescent signal belonging to compound 1 was also not diffusely distributed in the cytoplasm, which is in agreement with its fluorescence being quenched in aqueous medium. Fluorescent signal in the blue detection channel was localized almost exclusively to the spherical structures, which were also prominently visible in the green detection channel. Reticular labelling was detected only in the green detection channel, accompanied with a less distinct fluorescent staining in the background, which is probably due to unspecific binding of the dye (Fig. 3 and Figs. S25-S29).
The structures corresponding to fluorescently labeled spheres are also visible as bright dots in transmission images (Fig. 3D). Based on its fluorosolvatochromic properties, dye 1 localized in the spherical structures appears to be exposed to an environment of less polar lipids than in the
19 reticular structure. Therefore, we hypothesized that the spherical structures are lipid droplets, since they consist largely of uncharged lipids, such as triglycerides and sterol esters, surrounded by a phospholipid monolayer.[40]
A B
C D
Fig. 3. Confocal images of live NCI-H460 cells incubated with 1 at 10-6 M for 24 h.
Excitation: 405 nm. A: detection at 485-540 nm (green channel); B: detection at 410-455 nm (blue channel); C: overlay of the blue and green channels; D: transmission light image.
In order to confirm that the spherical structures labeled with 1 are indeed lipid droplets, we labeled the cells with the lipid droplet-specific dye Nile red, which is suitable for staining live and fixed cells. A very high degree of spatial overlap between fluorescence signals originating from Nile red and 1 (410-455 nm) (Fig. 4A, MCC = 0.93), together with its photophysical
20 properties, solubility, and fluorosolvatochromism, leads to the conclusion that compound 1 strongly stains lipid droplets. We proceeded to compare the reticular structure that fluoresces in the 485-540 nm range when stained with 1, with specific markers for the following intracellular organelles: mitochondria, the Golgi complex, endoplasmic reticulum (ER), and the ER-Golgi intermediate compartment (ERGIC). Mitochondria, most likely the mitochondrial membranes, were clearly stained with 1 (Fig. 4B, MCC = 0.81), whereas the Golgi complex was not (Fig. 4C, MCC < 0.05), which also applies to ER and ERGIC (data not shown).
3.5. Influence of different fixation, permeabilization and staining techniques
We also tested the influence of various fixation/permeabilization agents on staining performance of 1 (Figs. S30-S32). The best results were obtained when 1 was applied to live cells. However, if cells need to be permeabilized after fixation, e.g. for immunofluorescence, compound 1 should be applied to the cells as the final step to yield the best results. In contrast to fixation with paraformaldehyde, fluorescence of 1 was not sustained after fixation of stained live cells with organic solvents, such as methanol, regardless of subsequent permeabilization. On the other hand, staining with 1 after the fixation and permeabilization with methanol resulted in unspecific diffuse fluorescent signal since this treatment led to disintegration of lipid droplets (Fig. S32).
These results show that organic solvents and detergents used as fixation and permeabilization agents completely disrupt the structure of lipid droplets (Figs. S30-S32), which is in accordance with published literature.[41]
21 Fig. 4. Colocalization of counterstained intracellular structures (left column, shown in red) with 1 (10-6 M, 30 min – middle column, shown in green) in fixed NCI-H460 cells. Overlay images are shown in the right column. A: lipid droplets were stained with Nile red (100 ng/mL, 10 min) and a high spatial overlap between the two channels shows that the compound 1 also stains lipid droplets. B: mitochondria were stained with MitoTracker® Deep Red FM (200 nM, 15 min) and overlay image strongly indicates that the compound 1 also stains mitochondria. C: the Golgi complex was stained with AlexaFluor™ 568-labeled anti-mannosidase II antibody, showing that 1 does not stain the Golgi complex. Fluorescence signal of 1 was recorded in the range 410-455 nm in panels A and C, and 485-540 nm in panel B. Scale bars, 10 μm.
22 Finally, we tested the applicability of 1 to stain other cell lines, by applying it to breast cancer cells MCF-7 (Figs. S33-34). The results demonstrate that the staining of this cell line was also successful, however only very few LDs could be detected in these cells.
4. Discussion
Fluorescent probes (or chemosensors) have emerged as very useful tools in analytical sensing and optical imaging. For example, they are widely used for visualization and quantification of dynamic processes at the subcellular level with high spatial and temporal resolution. Among numerous requirements that a fluorescent probe must meet to be used in biological systems, it has to be nontoxic, sensitive, specific, and soluble in aqueous solutions. Moreover, probes to be used for intracellular labeling need to be able to cross plasma membranes.[42]
A complete characterization of the photophysical properties of a dye is pivotal for its use as a fluorescent label in microscopy. Here, we have shown that 1 is a highly fluorosolvatochromic dye, as anticipated from its structure and previous reports for similar molecules.[10,17,18]
However, its solvatochromism cannot be correlated well with dielectric constant and refractive index of solvents. The changes in Stokes shifts are well-correlated to the empirical ET(30) solvent polarity parameter, allowing for the estimation of fluorescence maxima in different media. Fluorescence quantum yields and lifetimes do not follow any trend with solvent polarity, but the S1 state of 1 is quenched by addition of protic solvents. It is an important property for the application of 1 in biology. Thus, in living cells, high fluorescence from 1 is anticipated only if it is imbedded in the nonaqueous environment in proteins, or in cellular membranes. However, in very apolar media, the dye does not absorb at 405 nm, whereupon selective excitation of the dye can be facilitated.
23 The amphiphilic character of 1 is ideal for its incorporation in artificial and intracellular membranes. The steady-state and time-resolved fluorescence measurements for the DPPC liposome solutions indicated that 1 is incorporated into lipid bilayer, and depending on the position of the chromophore in the bilayer, the molecule has different S1 lifetimes. Such a property could find applications in the FLIM imaging of intracellular membranes. It should be noted, however, that lifetime measurements for 1 were performed in deoxygenated solution. On the contrary, O2 in the intracellular environment is anticipated to quench the fluorescence, which may impede the application of the dye in FLIM imaging. Nevertheless, solvatochromic properties by of the dye, which are not affected by O2, allowed for the visualization of different intracellular lipids. The particularly appealing property of 1 is its ability to simultaneously stain lipid droplets and mitochondrial membranes, and due to their different polarity, give different fluorescence response. Thus, by using only one dye, it is possible to simultaneously observe lipid droplets (in blue) and mitochondrial membranes (in green). Although 1 is an amphiphilic molecule, we cannot rule out the possibility that it may be present in cytosol. However, quenching of fluorescence in protic solvent probably contributes to the staining of intracellular lipidicstructures only. Furthemore, the dye which is incorporated in more lipophylic structures then mitochodrial membranes/lipid droplets is not excited with 405 nm light.
Nile red is a commercial dye whose fluorescence emission is also environmentally sensitive - intracellular fat vacuoles, filled with neutral lipids such as cholesterol, lipoproteins and triglycerides will fluoresce green (EX 485 nm/EM 525 nm) while polar lipids, such as phospholipids, will fluoresce red.[31,32] Another example of a commercial dye that can stain different cellular structures is cyanine dye DiOC6(3), which is a green-fluorescent, lipophilic dye that stains mitochondria at low concentrations, while at higher concentrations, it can be used to
24 stain other internal membranes such as the endoplasmic reticulum. Thus, to produce rigorous and reproducible results, the dye and the cell concentrations have to be monitored with care.[43]
Remarkably, we have shown that 1 can simultaneously stain various structures at the same concentration of 10-6 M. Since the compound does not emit at λ > 600 nm, it can be used in combination with red-emitting probes in multicolor imaging.
Since 1 has a high affinity for lipid structures inside the cell, it was important to find out whether permeabilization with different agents had an effect on the overall staining efficiency. Even though the primary object of permeabilization is the controlled disruption of the plasma membrane, possible destruction of other intracellular membranous structures has to be taken into account. Although the best images of intracellular structures stained with 1 were obtained with live cells, the use of formaldehyde in the fixation protocol did not interfere significantly with the applicability of the dye. On the contrary, alcohols which are known to disrupt the target lipidic structures stained by 1, cannot be used for the fixation.
Colocalization experiments with different dyes or specific antibodies were performed in order to more precisely determine the localization/nature of stained structures. The colocalization with Nile red proved that the spherical structures visible in both blue and green fluorescence channels are lipid droplets. Reticular membranous structures, stained primarily with the green-fluorescing variant of 1, largely correspond to mitochondria. Still, a weak interaction of 1 with other intracellular membranous structures cannot be excluded.
The makeup of LDs fundamentally differs from most other organelles: the neutral lipid core, consisting of triglycerides, sterol esters etc., is surrounded by a single layer of phospholipids, solubilizing the lipophilic centre, more akin to micelles.[40,44] The visibility of lipid droplets at both wavelengths can be explained by their composition - the more polar phospholipid
25 monolayer accounts for the green fluorescence, while the non-polar core causes light emission in the blue spectral domain.[45] In general, the lipophilic nature of 1 allows it to be incorporated into lipid droplets, emitting a signal in the blue spectrum, whereas its amphiphilic character allows it to be used for staining mitochondria. However, depending on the cell line, intracellular lipid droplets can be observed or not, which is the property of the specific cell line, rather than the dye. Besides, depending on the type of cell, lipid droplets can greatly vary in size, ranging from only tens of nanometres up to 200 µm in adipocytes.[40]
The interaction of an amphiphilic compound with model lipid systems, for instance a simple lipid micelle[46] or a lipid bilayer[34,47] is facilitated by the presence of polar (e.g.
aminophthalimide) and non-polar (e.g. adamantyl) groups. However, upon incorporation of an amphiphilic molecule into the lipid bilayer, hydrogen bonds between the water molecules and the phospholipid phosphate groups are being disturbed or destroyed. Dynamic light scattering experiments at the rt with liposomes stained with 1, showed that the dye affects liposomes by changing their size. Most probably, the lipophilic adamantyl part of 1 interacts with phospholipids in the liposome, weakening the intermolecular van der Waals interactions between the phospholipid molecules, enforcing the liposomes size change. Changes in the lipid bilayer upon binding 1 should be put in the context of its observed cytotoxicity. Upon treatment of cells with 1 at > 10-6 M, and particularly at > 10-5 M, its concentration approaches the IC50 value.
Thus, at longer incubation times, damage of the intracellular membranes can occur and lead to cell death. However, our results indicate that binding of 1 to membranes at concentrations ≈10-6 M is not cytotoxic and is therefore well suited for applications in live cell microscopy.
26 5. Conclusions
We have synthesized 4-amino-N-adamantylphthalimide (1) and investigated its photophysical properties in different solvents. 1 is a moderightly bright and highly fluorescent dye (ΦF = 0.15- 0.80) with relatively long singlet excited state lifetimes (τ = 9-25 ns), and characterized by fluorosolvatochromic properties dependent on the ET(30) parameter. The fact that the dye can be excited at 405 nm allows for its use in biological applications. Due to its amphiphilic character, 1 stains liposomes and intracellular lipidous structures in living cells, as shown by confocal microscopy in two human cancer cell lines. Colocalization experiments with a panel of specific organelle markers indicated that 1 primarily binds to intracellular lipid droplets and mitochondrial membranes. This unique feature makes it an attractive candidate for the vital staining of cells and tissues involved in lipid storage and oxidation, such as adipose, liver, muscle and myocardium. In particular, the much debated question of lipid trafficking mechanism between the lipid droplets and mitochondria could be addressed by using this dye.[48]
Acknowledgement
These materials are based on work financed by Croatian Science Foundation (HRZZ IP-2014-09- 6312 to NB and IP-2013-5660 to MK), and Hungarian National Research, Development and Innovation Office (NKFIH, Grant K123995 to LB). The work was also supported by the FP7- REGPOT-2012-2013-1 project, Grant Agreement Number 316289 - InnoMol. The authors thank Ms. Lucija Horvat for the help with confocal microscopy.
27 Supporting information contains: Spectral and photophysical properties of 1, characterization of liposome suspensions, confocal microscopy images, MTT test and NMR spectra. This material is available free of charge via the Internet.
References:
[1] J. R. Lakowicz, Principles of Fluorescence Spectroscopy, Springer, USA, 2006.
[2] The Molecular Probes Handbook -A Guide to Fluorescent Probes and Labeling Technologies, TermoFisher Scientific.
[3] F. G. Prendergast, R. P. Haugland, P. J. Callahan, 1-[4-(Trimethylamino)phenyl]-6-
phenylhexa-1,3,5-triene: Synthesis, Fluorescence Properties and Use as a Fluorescence Probe of Lipid Bilayers, Biochemistry 20 (1981) 7333-7338.
[4] B. Valeur, Molecular Fluorescence, Viley WCH, Weinheim, 2002.
[5] G. Weber, F. J. Farris, Synthesis and Spectral Properties of a Hydrophobic Fluorescent Probe:
6-Propionyl-2-(dimethylamino)naphthalene, Biochemistry 18 (1979) 3075-3078.
[6] T. Parasassi, E. K. Krasnowska, L. Bagatolli, E. Gratton, Laurdan and Prodan as Polarity- Sensitive Fluorescent Membrane Probes, J. Fluorescence 8 (1998) 365-373.
[7] M. R. Dent, I. López-Duarte, C. J. Dickson, N. D. Geoghegan, J. M. Cooper, I. R. Gould, R.
Krams, J. A. Bull, N. J. Brooks, M. K. Kuimova, Imaging Phase Separation in Model Lipid Membranes Through the Use of BODIPY Based Molecular Rotors, Phys. Chem. Chem. Phys. 17 (2015) 18393-18402.
[8] A. Vyšniauskas, I. López-Duarte, N. Duchemin, T.-T. Vu, Y. Wu, E. M. Budynina, Y. A.
Volkova, E. Peña Cabrera, D. E. Ramírez-Ornelas, M. K. Kuimova, Exploring Viscosity, Polarity and Temperature Sensitivity of BODIPY-Based Molecular Rotors, Phys. Chem. Chem.
Phys. 19 (2017) 25252-25259.
[9] T. K. Fam, A. S. Klymchenko, M. Collot, Recent Advances in Fluorescent Probes for Lipid Droplets, Materials 11 (2018) 1768; doi:10.3390/ma11091768.
[10] T. Soujanya, R. W. Fessenden, A. Samanta, Role of Nonfluorescent Twisted Intramolecular Charge Transfer State on the Photophysical Behavior of Aminophthalimide Dyes, J. Phys. Chem.
100 (1996) 3507-3512.
28 [11] V. Wintgens, P. Valat, J. Kossanyi, A. Demeter, L. Biczók, T. Bérces, Spectroscopic
Properties of Dicarboximides. Part 4 On the Modification of the Fluorescence and Intersystem Crossing Processes of Molecules by Electron-donating Methoxy Groups at Different Positions.
The Case of 1,8-Naphthalimides, New J. Chem. 20 (1996) 1149-1158.
[12] J. D. Coyle, G. L. Newport, A. Harriman, Nitrogen-Substituted Phthalimides: Fluorescence, Phosphorescence, and the Mechanism of Photocyclization, J. Chem. Soc. Perkin Trans. 2. (1978) 133-137.
[13] J. D. Coyle, A. Harriman, G. L. Newport, Reversible Photorearrangement of N-substituted Phthalimides: a Flash Photolysis Study, J. Chem. Soc. Perkin Trans. 2. (1979) 799-802.
[14] V. Wintgens, P. Valat, J. Kossanyi, L. Biczók, A. Demeter, T. Bérces, Spectroscopic
Properties of Aromatic Dicarboximides. Part 1 N-H and N-Methyl-substituted Naphthalimides, J.
Chem. Soc. Faraday Trans. 20 (1994) 411-421.
[15] M. Oelgemöller, A. G. Griesbeck, Photoinduced Electron Transfer Chemistry of Phthalimdes: An Efficient Tool for C–C-Bond Formation, J. Photochem. Photobiol. C:
Photochem. Rev. 3 (2002) 109-127.
[16] M. Horvat, K. Mlinarić-Majerski, N. Basarić, Photochemistry of N-alkyl and N-aryl
Substituted Phthalimides: H-Abstractions, Single Elelctron Transfer and Cycloadditions, Croat.
Chem. Acta 83 (2010) 179-188.
[17] D. E.Wetzler, C. Chesta, R. Fernández-Prini, P. F. Aramendía, Dynamic Solvation of Aminophthalimides in Solvent Mixtures, J. Phys. Chem. A 106 (2002) 2390-2400.
[18] A. Morimoito, T. Yatsuhashi, T. Shimada, L. Biczók, D. A. Tryk, H. Inoue, Radiationless Deactivation of an Intramolecular Charge Transfer Excited State through Hydrogen Bonding:
Effect of Molecular Structure and Hard-Soft Anionic Character in the Excited State, J. Phys.
Chem. A 105 (2001) 10488-10496.
[19] S. Banthia, A. Samanta, Calix[4]azacrown and 4-Aminophthalimide-Appended
Calix[4]azacrown: Synthesis, Structure, Complexation and Fluorescence Signaling Behaviour, Org. Biomol. Chem. 3 (2005) 1428-1434.
[20] H. Okamoto, H. Konishi, M. Kohno, K. Satake, Fluorescence Response of a 4-
Trifluoroacetylaminophthalimide to Iodide Ions upon 254 nm Irradiation in MeCN, Org. Lett. 10 (2008) 3125-3128.
29 [21] A. G. Griesbeck, S. Hanft, Y. Díaz Miara, Colorimetric Detection of Achiral Anions and Chiral Carboxylates by a Chiral Thiourea-Phthalimide Dyade, Photochem. Photobiol. Sci. 9 (2010) 1385-1390.
[22] R. Pérez-Ruiz, A. G. Griesbeck, D. Sampedro, Computational Study of Fluoride Recognition by an Urea-Activated Phthalimide Chemosensor, Tetrahedron 68 (2012) 5724-5729.
[23] H. Okamoto, M. Kohno, K. Satake, M. Kimura, An Azacrowned Phthalimide as a Metal-Ion Sensitive and Solvatofluorochromic Fluorophore: Fluorescence Properties and a Mimic
Integrated Logic Operation, Bull. Chem. Soc. Jpn. 78 (2005) 2180-2187.
[24] J. Riedl, R. Pohl, N. P. Ernsting, P. Orság, M. Fojta, M. Hocek, Labelling of Nucleosides and Oligonucleotides by Solvatochromic 4-Aminophthalimide Fluorophore for Studying DNA- Protein Interactions, Chem. Sci. 3 (2012) 2797-2806.
[25] J. Vamecq, K. Van Derpoorten, J. H. Poupaert, J. Balzarini, E. De Clercq, J. P. Stables, Anticonvulsant Phenytoinergic Pharmacophores and Anti-HIV Activity - Preliminary Evidence for the Dual Requirement of the 4-Aminophthalimide Platform and the N-(1-adamantyl)
Substitution for Antiviral Properties, Life Sci. 63 (1998) PL267-PL274.
[26] K. Van Derpoorten, J. Balzarini, E. De Clercq, J. H. Poupaert, Anti-HIV Activity of N-1- adamantyl-4-aminophthalimide, Biomed. Pharmacother. 51 (1997) 464-468.
[27] V. Wintgens, C. Amiel, New 4-amino-N-alkylphthalimides as Fluorescence Probes for Beta- Cyclodextrin Inclusion Complexes and Hydrophobic Microdomains of Amphiphilic Systems, J.
Photochem. Photobiol. A: Chem. 168 (2004) 217-226.
[28] J. Olmsted III, Calorimetric Determinations of Absolute Fluorescence Quantum Yields, J.
Phys. Chem. 83 (1979) 2581-2584.
[29] M. Megyesi, L.Biczók, Considerable Change of Fluorescence Properties upon Multiple Binding of Coralyne to 4-Sulfonatocalixarenes, J. Phys. Chem. B. 114 (2010) 2814-2819.
[30] L. Uzelac, Đ. Škalamera, K. Mlinarić-Majerski, N. Basarić, M. Kralj, Selective
Photocytotoxicity of Anthrols on Cancer Stem-like Cells: The Effect of Quinone Methides or Reactive Oxygen Species, Eur. J. Med. Chem. 137 (2017) 558-574.
[31] G. Diaz, M. Melis, B. Batetta, F. Angius, A. M. Falchi, Hydrophobic Characterization of Intracellular Lipids in situ by Nile Red Red/Yellow Emission Ratio, Micron. 39 (2008) 819-824.
[32] P. Greenspan, E. P. Mayer, S. D. Fowler, Nile Red: a Selective Fluorescent Stain for Intracellular Lipid Droplets, J. Cell Biol. 100 (1985) 965-973.
30 [33] K. W. Dunn, M. M. Kamocka, J. H. McDonald, A Practical Guide to Evaluating
Colocalization in Biological microscopy, Am. J. Physiol. Cell Physiol. 300 (2011) C723-C742.
[34] E. von Lippert, Spektoskopishe Bistimmung des Dipolmomentes Aromatischer
Verbindungen im Ersten Angeregten Singuletzustand, Z. Electrochem. 61 (1957) 962-975.
[35] N. Mataga, Y. Kaifu, M. Koizumi, Solvent Effects upon Fluorescence Spectra and the Dipole Moments of Excited Molecules, Bull. Chem. Soc. Jpn. 29 (1956) 465-470.
[36] C. Reichardt, Solvatochromic Dyes as Solvent Polarity Indicators, Chem. Rev., 94 (1994) 2319-2358.
[37] C. Espinosa-Bustos, D. Cortés-Arriagada, M. A. Soto-Arriaza, J. Robinson-Duggon, N.
Pizarro, A. R. Cabrera, D. Fuentealba, C. O. Salas, Fluorescence Properties of Aurone Derivatives: An Experimental and Theoretical Study with Some Preliminary Biological Applications, Photochem. Photobiol. Sci. 16 (2017) 1268-1276.
[38] M. Šekutor, A. Štimac, K. Mlinarić-Majerski, R. Frkanec, Syntheses and Characterization of Liposome-Incorporated Adamantyl Aminoguanidines, Org. Biomol. Chem. 12 (2014) 6005- 6013.
[39] G. Saroja, B. Ramachandram, S. Saha, A. Samanta, The Fluorescence Response of a Structurally Modified 4-Aminophthalimide Derivative Covalently Attached to a Fatty Acid in Homogeneous and Micellar Environments, J. Phys. Chem. B 103 (1999) 2906-2911.
[40] T. C. Walther, R. V. Farese, The Life of Lipid Droplets, Biochim. Biophys. Acta BBA-Mol.
Cell Biol. Lipids. 1791 (2009) 459-466.
[41] D. DiDonato, D. L. Brasaemle, Fixation Methods for the Study of Lipid Droplets by Immunofluorescence Microscopy, J. Histochem. Cytochem. 51 (2003) 773-780.
[42] E. Oliveira, E. Bértolo, C. Núñez, V. Pilla, H. M. Santos, J. Fernández-Lodeiro, A.
Fernández-Lodeiro, J. Djafari, J. L. Capelo, C. Lodeiro, Green and Red Fluorescent Dyes for Translational Applications in Imaging and Sensing Analytes: A Dual-Color Flag. Chem. Open 7 1 (2017) 9-52. doi: 10.1002/open.201700135. eCollection 2018 Jan.
[43] C. Cottet-Rousselle, X. Ronot, X. Leverve, J.-F. Mayol, Cytometric Assessment of Mitochondria Using Fluorescent Probes, Cytometry Part A 79A (2011) 405-425.
[44] M. A. Welte, Expanding Roles for Lipid Droplets, Curr. Biol. 25 11 (2015) R470-481.
[45] T. Fujimoto, R. G. Parton, Not Just Fat: The Structure and Function of the Lipid Droplet.
Cold. Spring. Harb. Perspect. Biol. 3 3 (2011) 1-18.
31 [46] B. Mihaljević, I. Tartaro, C. Ferreri, C. Chatgilialoglu, Linoleic Acid Peroxidation vs.
Isomerization: a Biomimetic Model of Free Radical Reactivity in the Presence of Thiols, Org.
Biomol. Chem. 9 (2011) 3541-3548.
[47] C. Chatgilialoglu, C. N. Ferreri, I. Lykakis, B. Mihaljević, Biomimetic Radical Chemistry by
-Irradiation of Micelles and Vesicle Containing Fatty Acid Residues, Isr. J. Chem. 54 (2014) 242-247.
[48] M. A. Aon, N. Bhatt, C. S. Cortassa, Mitochondrial and Cellular Mechanisms for Managing Lipid Excess, Front. Physiol. 5 (2014) 282.