Applied Surface Science xxx (xxxx) xxx
Available online 17 November 2020
0169-4332/© 2020 Elsevier B.V. All rights reserved.
Full Length Article
Fluorescence probing of binding sites on graphene oxide nanosheets with Oxazine 1 dye
Adrien Paudics
a, Shereen Farah
a, Imre Bert oti ´
b, Attila Farkas
c, Krisztina L ´ aszl ´ o
a,*, Mikl os Mohai ´
b, Gy orgy S ¨ ´ afr ´ an
d, Andr ´ as Szil ´ agyi
a, Mikl ´ os Kubinyi
aaDepartment of Physical Chemistry and Materials Science, Budapest University of Technology and Economics, Budapest H-1521, Hungary
bInstitute of Materials and Environmental Chemistry, Research Centre for Natural Sciences, E¨otv¨os Lorand Research Network, Magyar tud´ ´osok k¨orútja 2., Budapest H- 1117, Hungary
cDepartment of Organic Chemistry and Technology, Budapest University of Technology and Economics, Budapest H-1521, Hungary
dResearch Institute for Technical Physics and Materials Science, E¨otv¨os Lor´and Research Network, Konkoly Thege M. út 29-33., Budapest H-1121, Hungary
A R T I C L E I N F O Keywords:
Cationic dye GO Fluorescence detection No need to separate supernatant
A B S T R A C T
The adsorption of the fluorescent dye, Oxazine 1 (OX) was studied on graphene oxide (GO), in the range of low (⩽10−7 M) OX concentrations, exploiting the high sensitivity of fluorescence spectroscopy. Dry GO was char- acterized using XRD, TEM, XPS, Raman and IR spectroscopy, while its chemistry in aqueous suspension was examined with potentiometric titration. Adsorption isotherms were measured at pH 6.4 and 10.2 at temperatures 20 and 35 ◦C. All the isotherms were well described by the Langmuir equation. The saturation capacities nm were higher at pH 10.2 than at 6.4 at the respective temperature, in accordance with the presence of additional dissociated acidic groups on the GO surface. The nm values corresponded to a few percent occupancy of the dissociated acidic groups of GO. The equilibrium constant KL for OX was substantially higher than the values reported for the adsorption of other cationic dyes from more concentrated solutions, indicating that our results refer to binding to the most active sites. The large negative adsorption enthalpy and the positive adsorption entropy are also indicative of strong binding interactions. In this case, probably the Coulomb interactions be- tween the opposite charges on the adsorbent and adsorbate are dominant in the binding interactions.
1. Introduction
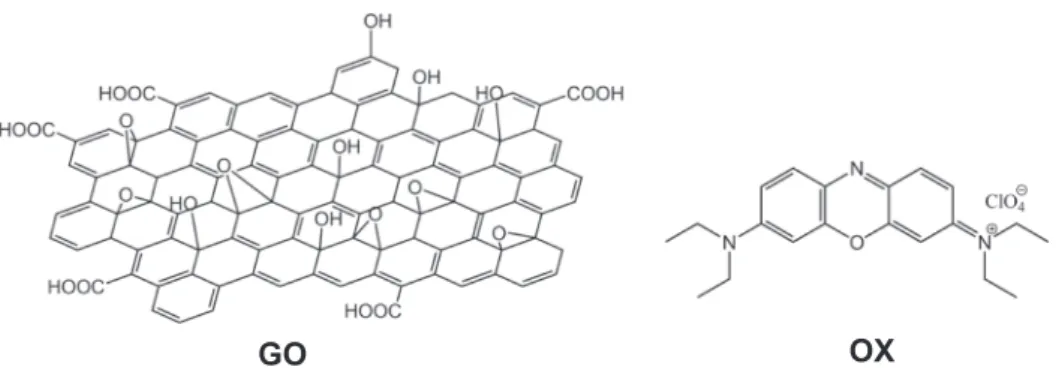
Although graphene oxide (GO) has been known since the middle of the 19th century [1], it has become a widely studied material only in the 21st century, following the successful preparation of single-layered graphene sheets [2]. Initially, GO served mainly as a convenient inter- mediate in the large-scale manufacture of graphene [3–5]. GO is a non- stoichiometric lattice of sp2 and sp3 hybrid state carbon atoms, with a large concentration of various oxygen containing functional groups on its surface (see Fig. 1). Hydroxy and epoxy groups are attached to the basal planes of GO sheets, whereas carboxyl, carbonyl, phenol, lactone and quinone groups are located at the edges [6]. GO is prepared by oxidation of graphite, and the chemical composition of the GO formed is determined by the quality of the graphite starting material and the re- action conditions [7,8]. GO has hydrophilic character [3,4] and it forms stable aqueous suspensions [9]. The stability of such suspensions is due partly to the increased separation, and hence weakened interactions,
between the GO sheets with oxygen containing groups on their surface, and partly to the formation of hydrogen bonds between the hydroxyl and carboxyl groups on the sheets and the water solvent molecules [3].
By now, owing to its tunable hydrophilic/hydrophobic character and easy processability in polar solvents, particularly in water, it has a wide range of applications in its own right. The variety of its functional groups makes GO a promising candidate for many applications [10–13]. Many different polymers and biomolecules can be bound to GO via the oxygen functional groups [14–17]. In this way, GO can function as a carrier for the transport of bioactive compounds [18]. Several applications of GO as catalysts [19,20] and adsorbents [21–23] in aqueous media have been reported. The functional groups also affect the electronic, mechanical and electrochemical properties of GO [24]. The concentration of defects in GO is much higher than in graphene, this may, however, be advan- tageous in some special applications in the semiconductor industry [4].
That GO is a photostable, non-toxic, biocompatible and environment- friendly material, has given rise to the development of many types of
* Corresponding author at: M˝uegyetem rkp. 3, Budapest 1111, Hungary.
E-mail address: klaszlo@mail.bme.hu (K. L´aszlo). ´
Contents lists available at ScienceDirect
Applied Surface Science
journal homepage: www.elsevier.com/locate/apsusc
https://doi.org/10.1016/j.apsusc.2020.148451
Received 7 September 2020; Received in revised form 6 November 2020; Accepted 9 November 2020
GO-based optical biosensors and chemical sensors [25–30]. In the ma- jority of GO-based fluorescent sensors reported so far, GO acted as the acceptor of a FRET-system (F¨orster resonance energy transfer), with quantum dots or an organic dye as donors [31]. As another fluorescence- related application, aptamer-conjugated GO-s have been prepared which functioned as fluorophores for NIR two-photon microscopic im- aging [32,33].
In this work, the adsorption of a fluorescent indicator dye, Oxazine 1 (perchlorate salt, OX in Fig. 1) on GO has been investigated. Studying the adsorption of organic dyes is a straightforward means of charac- terizing the binding sites on GO nanosheets. Furthermore, the results may contribute to some technical applications of GO, e.g. the cleaning of industrial waste water with GO adsorbent or the development of GO based optical sensors. The adsorption of many dyes on GO [34–41], reduced GO [42] and GO composites [43] have been reported. Primar- ily, in these studies cationic dyes were the adsorbates, which interact strongly with the negatively charged GO nanosheets. In most cases, the surface coverage was determined by separating the solution phase and measuring the concentration of the unabsorbed dye by absorption spectroscopy [36,37]. In the case of fluorescent dyes, fluorescence quenching that accompanies the binding to GO provides a direct method for monitoring the adsorption process [38].
OX was chosen as the fluorescent probe in our study because (i) it absorbs in the red region of the visible spectrum, where GO absorbs very weakly; (ii) the fluorescent quantum yield of OX is relatively high in aqueous solution [44], and (iii) oxazine dyes have high pKa values: they are therefore present in the same protonation form (mono-protonated) over a wide pH range. Owing to the high sensitivity of fluorescence detection, samples with low dye and low GO concentrations could be used, and for this reason information was expected primarily on the interactions of the dye with the strongest binding sites. The adsorption process was characterized quantitatively by the Langmuir parameters, determined from the spectra of mixtures with constant GO and varied dye concentrations.
Prior to the fluorescence spectroscopic experiments, the structure of GO was characterized by powder X-ray diffraction (XRD), transmission electron microscopic imaging (TEM), X-ray photoelectron spectroscopy (XPS), infrared and Raman spectroscopic methods. A detailed ther- mogravimetric (TG) study of GO and its derivatives has been published recently [45]. The specific surface of GO was determined by nitrogen adsorption technique.
2. Materials and methods
GO was prepared from natural graphite powder (average particle size 63 µm) purchased from Graphite Týn (Týn nad Vltavou, Czech Republic) using the improved Hummers’ method [46,47]. Oxazine 1, the fluorescent dye, was supplied by Sigma.
The powder X-ray diffraction (XRD) pattern of GO was measured with a PANalytical X’pert Pro MPD X-ray diffractometer using Cu Kα (1.54056 Å) radiation.
The morphology of the samples was characterized by a FEI Titan Themis 200 kV spherical aberration (Cs) corrected TEM 0.09 nm HRTEM and 0.16 nm STEM resolution equipped with 4 Thermofischer
“Super X G1” EDS detectors. The samples were drop-dried on TEM microgrids coated with ultrathin carbon layer.
Raman spectra were recorded with a LabRAM (Horiba Jobin Yvon) instrument having a λ =532 nm Nd-YAG laser source (laser power at the focus point is 15 mW). Filter of 0.6 OD was used to reduce excitation beam energy reducing the chance of sample degradation. After baseline correction the first and second order regions of the spectrum were deconvoluted to Lorentzian functions using the conventional fitting procedures of the Origin program. The crystallite size (La) was estimated by the Tuinstra-Koenig-Cancado equation [48]
La=(
2.4×10⁻¹⁰nm−3) λ4(ID
IG
)−1 (1)
The infrared spectra were recorded on a Tenzor 37 (Brooker) FT-IR spectrometer in ATR mode. X-ray photoelectron spectra were recorded on a Kratos XSAM 800 spectrometer operating in fixed analyzer trans- mission mode, using Mg Kα (1253.6 eV) excitation. After subtraction of a Shirley type baseline, the quantitative analysis was performed by the Kratos Vision 2 and XPS MultiQuant programs.
For the potentiometric titration of GO, 0.05 g of the sample was suspended in 50 mL NaCl solution (0.01 M) at 25 ◦C. The suspension was titrated with 0.1 M NaOH solution in the pH window 3–10. The specific net proton surface excess was derived from the initial and equilibrium concentrations of the suspension [49,50].
The UV–Vis absorption spectra of the buffered GO suspensions were recorded on an Agilent 8453 single-beam spectrophotometer.
The samples used in the determination of the adsorption isotherms by fluorescence spectroscopy were GO-OX mixtures in Bis-Tris buffer of pH 6.4 and in CAPS buffer of pH 10.2. The samples were prepared by adding OX from a 2 ⋅ 10−4 M stock solution to GO solutions of 2.5 mg/L.
The equilibrium state (constant fluorescence intensity) of the stirred mixtures was reached typically in 30–60 min. The fluorescence spectra were acquired by an Edinburgh Instruments FS5 spectrofluorimeter.
They were excited at 655 nm, at the absorption maximum of OX. The isotherms were measured at 20 and 35 ◦C.
3. Results and discussion
3.1. Characterization of GO in solid state
The X-ray diffractogram of GO is shown in Fig. 2, together with the diffractogram of natural graphite. The sharp peak of graphite at 2Θ = 26.3◦ corresponds to an interlayer distance of 3.45 Å. With GO, how- ever, the broader peak indicates a less regular structure: the position of the peak, 2Θ =11.5◦, yields for the interlayer spacing 7.73 Å. This larger spacing is the consequence of the oxygen substituents on the carbon skeleton.
HRTEM image (Fig. 3) reveals the heterogeneous layer structure of
GO OX
Fig. 1. The Lerf-Klinowski model of graphene oxide (GO) and the chemical structures of Oxazine 1 (OX).
the GO particles, in correlation with the diffractogram. The particles contain amorphous and polycrystalline regions (Fig. S1).
This was also confirmed by Raman spectroscopy (Fig. 4). Beside the iconic G (~ 1580 cm−1, graphitic band, related to the vibrations of the sp2 building blocks) and D (~ 1350 cm−1, defect band, associated to structural disorder) bands the contribution of D’ (~ 1600 cm−1, disor- dered graphitic lattices), D” (~ 1506 cm−1, amorphous phases) and D*
(~ 1220 cm−1, disorder from graphitic lattices and impurities) were recognized in the first order spectrum [51–53]. The second order region was assigned to the 2D (~ 2700 cm−1, structural order), 2D’ combined G*, D +D’ bands, the latter two in the 2300–3100 cm−1 region. These bands, their position and their relative intensities help to identify and characterize the chemical and physical properties of carbon materials [54,55]. In this paper we use the D, G and 2D bands for characterization, the latter being very sensitive to the stacking. The main structural pa- rameters deduced from Raman spectroscopy are shown in Table 1.
It was found that in single-layer graphene the G and 2D bands usually appear at 1585 and 2679 cm−1, and move to lower and higher Raman shift values, respectively, with increasing number of layers. The 2D/G ratio decreases with increasing number of layers (from >1.6 in single layer to 0.8, 0.30 and 0.07 by increasing the layer number to 2, 3 and 4, respectively) [56] and Refs. [66–72] within]. Indeed, in our sample the position of the bands shift in the expected directions. The I2D/IG ratio corresponds to a few layers on average, confirming the XRD and HRTEM observations.
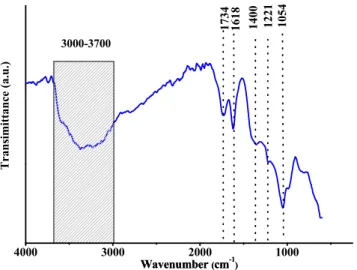
The functional groups in bulk GO were identified by infrared spec- troscopy (Fig. 5). The broad band in the 3000–3700 cm−1 corresponds to the νOH characteristic vibration, while the band at 1734 belongs to the νC––O vibrations of the carbonyl and carboxyl groups, the band at 1618 can be assigned to νarC–C modes (stretching modes of aromatic rings), and that at 1400 cm−1 belongs to the δOH bending modes of phenol and
tertiary alcohol groups. The feature at 1221 cm−1 arises from the νC–O (H) stretching vibrations. The band at 1054 cm−1 may originate from the νasC–O–C stretching modes of epoxide rings [57,58].
The photoelectron spectral regions of the C1s and O1s lines are shown in Fig. 6. The shapes of the lines are complex, indicating the presence of various chemical species on the surface. The C1s and O1s regions can be fitted with five and three components, respectively. The binding energies, the assignations of the components to chemical states and the quantitative compositions are shown in Table 2. This assignment is based on previous works and literature data; for details see Refs.
[59–68] and Table S1.
The surface of GO is highly oxidized (28.5% total O). The proportions of the various oxidized carbon and oxygen species exhibit excellent agreement.
3.2. Characterization of GO in aqueous suspension
In the absorption spectrum of GO (Fig. 7a) the strong band at 230 nm arises from the π → π* transitions of conjugated C––C units, while the Fig. 2. X-ray diffractograms of graphite and GO.
Fig. 3. HRTEM image of GO particles.
1000 1500 2000 2500 3000 3500
2D' 2D D+D' D'
D"
D*
G
G*
Intensity (a.u.)
Raman shift (cm-1)
D
Fig. 4. Deconvoluted Raman spectrum of the dry GO sample.
Table 1
Parameters obtained from the deconvoluted Raman spectrum.
Carbon material Raman shift (cm−1) ID/IG I2D/IG La (nm) G-band D-band 2D-band
GO 1574 1351 2707 1.46 0.19 13.2
shoulder at 300 nm is assigned to the n → π* transitions of C––O groups.
The spectrum was found to obey Beer’s law (inset in Fig. 7a), indicating that GO was fully dispersed into single layered sheets at the low con- centrations employed in this study.
The fluorescence emission spectra (Fig. 7b) consist of distinct bands, with relative intensities depending on the excitation wavelength. On the basis of the excitation spectra (Fig. 7c), the fluorescence emission bands can be assigned to different aromatic structures decorated with C––O and other oxygen containing functional groups, embedded into a framework of sp3 hybridized carbon atoms. Namely, the emission fea- tures around 300, 350 and 390 nm may be assigned to benzoic acid-like (or phenol-like), naphthoic acid-like and salicylic acid-like fluorescence centers, respectively [69].
The acid/base properties of the GO in dilute aqueous suspension were characterized by potentiometric titration in CO2-free conditions.
The pH of immersion was 2.98. The titration data were converted to a
proton excess isotherm (Fig. 8a), revealing that the surface is negatively charged in the whole pH range investigated. The increase in pH of the suspension leads to deprotonation of the various acidic functional groups decorating the graphene sheet. The SAIEUS procedure [70,71]
was used to calculate the pKa distribution and the concentration of the corresponding functional groups (Fig. 8b and Table 3). The good agreement between the XPS and titration results confirms that the ma- jority of the functional groups is probably phenolic OH.
3.3. Spectral data of OX in aqueous solutions
The pKa of OX was determined from the absorption spectra of the dye (Fig. S2 in the electronic supplementary information), measured be- tween pH 9.7 and 14, yielding the value 11.74.
The spectral data of the protonated and neutral forms of OX are collected in Table 4. The adsorption experiments were carried out in buffers of 6.4 and 10.2, in which the protonated state dye was dominant.
Comparing the spectra measured in the buffers to the spectra measured in neat water, the positions of the absorption and fluorescence bands did not change noticeably, whereas the fluorescent quantum yields were a little higher in the buffers. The detection limit of the dye in our fluo- rescence spectroscopic experiments was ~5 ⋅ 10−11 M.
3.4. Adsorption of OX on GO
The dye adsorption isotherms were determined at pH 6.4, where the negative charges of the GO nanosheets arise solely from dissociated carboxyl groups, and at pH 10.2 where all the acidic groups can be considered fully dissociated [9]. As mentioned above, the monocationic form of OX was dominant even at pH 10.2.
The pH 6.4 solutions were made in a Bis-Tris buffer, the pH 10.2 solutions in a CAPS buffer. The GO concentration was 2.5 mg/L in all the samples, and the dye concentration was varied between 0 and 1 ×10⁻⁷ M. Using such low dye concentrations, the absorbance of all the samples was below 0.015 in the range of the visible absorption band of OX. Thus, no correction of the fluorescence intensities for inner filter effects was Fig. 5. ATR-FTIR spectrum of freeze-dried GO.
s 1 O s
1
C
C1C2C3 C4C5
O1O2 O3
Fig. 6. C1s and O1s high resolution XP spectra of GO, decomposed into the bands of different chemical states.
Table 2
Binding energies (eV), assigned chemical states and surface chemical composition (atomic %) of GO calculated from XP spectra.
O1 O2 O3 C1 C2 C3 C4 C5
Binding energy 530.8 532.4 533.5 284.2 285.1 286.6 287.5 288.8
Chemical states C––O
*O––C–OH C–O–C
C–OH O––C–O* sp2 C sp3 C C–OH
C–O–C C––O O––C–O
Composition 2.8 22.8 3.8 17.8 13.3 29.7 6.1 3.7
required. The isotherms were measured at 20 and 35 ◦C.
The fluorescence spectra of the GO-OX mixtures at the two pH values are illustrated in Fig. 9, displaying the spectra obtained at 20 ◦C. The amount of the adsorbed dye, ns, was calculated for each sample from
ns=(c0− ce)V mad
, (2)
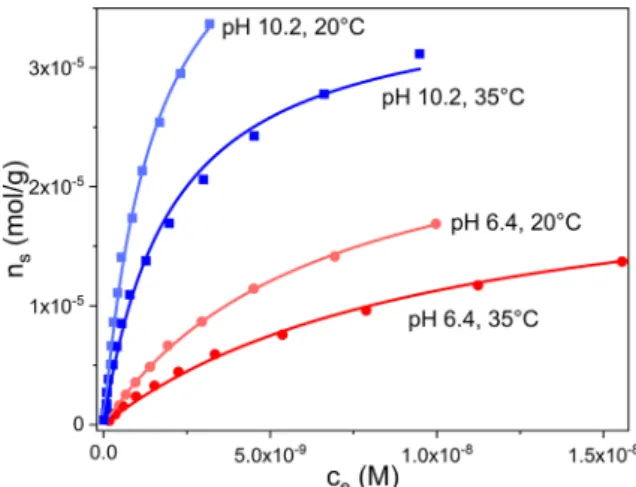
where c0 and ce are the initial and equilibrium concentrations of the dye, calculated from the fluorescence intensities at 670 nm, the band maximum of OX (see insets in Fig. 9); mad is the mass of the dry adsor- bent, V is the volume of the liquid phase. The adsorption isotherms are shown in Fig. 10.
The isotherms at both pH values and temperatures are of L Type [72].
Such isotherms have a well-defined plateau that is associated with the saturation capacity of the system. The isotherms were fitted to the hy- perbolic form of the Langmuir model. The conditions of this model are (i) the binding sites are energetically homogeneous and (ii) the maximum amount of solute can be adsorbed in a monomolecular layer on the adsorbent. These assumptions lead to the isotherm equation with two parameters
ns=nm∙KL∙ce
1+KL∙ce (3)
Although the limits of the model are seldom strictly met, its great advantage is that it is based on a clear and simple physical model and the parameters can therefore be related directly to this physical picture: nm
is the adsorbed amount at full coverage (monolayer capacity) and KL is the equilibrium constant of the adsorption.
The experimental data of all four isotherms conformed closely with the hyperbolic Langmuir equation with parameters KL and nm (for example, see the fitted functions in Fig. 10). The values of the two pa- rameters are listed in Table 5.
On comparing the parameters obtained at pH =6.4 and 10.2 at the same temperatures, the nm adsorption capacities are higher in the more basic solutions, where a higher proportion of the acidic groups of GO are dissociated. Taking the ratios of the nm values at 20 ◦C and the con- centrations of the dissociated acidic groups from potentiometric titra- tion, it can be concluded that the saturation condition corresponds to an occupancy of ~5% of the dissociated acidic groups of GO at pH 6.4, and an occupancy of ~1.5% of the dissociated acidic groups at pH 10.2. The values of the binding constants, KL are also higher in the more basic samples. Furthermore, KL decreases with increasing temperature – this holds both at pH 6.4 and 10.2. The latter trend indicates that the adsorption of the dye on the most active surface sites of GO is an exothermic process.
The Gibbs free energies of adsorption were obtained from the KL
values as ΔG= − RTln
(KL
c0 )
(4) where KL is expressed in units L/mol, c0 ≡1 mol/L [73].
The values lie between − 50 and − 55 kJ/mol, which is higher than reported for similar systems in the case of physisorption (0–20 kJ/mol) but lower than the values characteristic of chemisorption, suggesting strong electrostatic interactions. The heats and entropies of adsorption estimated using the equation
ln (KL
c0 )
= − ΔH RT+ΔS
R (5)
are shown in Table 6. The ΔH values indicate that the adsorption of OX on the most active binding sites of GO is strongly exothermic. The positive adsorption entropies show that the positive ‘solvent entropies’ overcompensate the negative ‘solute entropies’, as frequently occurs in aqueous systems [74,75]. In our case, the solvent entropy arises from the release of water molecules from the surface of GO nanosheets and the solvent shell of the dye molecules into the less ordered bulk water. The
‘solute entropy’ corresponds to the loss of the orientational and conformational freedom of the dye solute at the surface of the GO Fig. 7. (a) Absorption spectrum of GO in 18.8 mg/L aqueous suspension at pH
= 6.4. The inset shows the calibration at λ =230 nm; (b)–(c) fluorescence spectra in 0.57 mg/L aqueous suspension, pH =6.4,(b) fluorescence emission spectra obtained at excitation wavelengths 230, 240 and 250 nm; (c) fluores- cence excitation spectra obtained at emission wavelengths 305, 349 and 388 nm.
adsorbent.
On comparing the present results to the adsorption isotherms re- ported for other cationic dyes [34–36], the Langmuir model also pro- vides a good description in most of the other cases. The low dye concentrations of our samples, sufficient for fluorescence detection,
allows us to gain information on binding to the most active sites on GO.
The adsorption equilibrium constants obtained from these initial sec- tions of the isotherms are significantly (10–100-times) higher than those reported for other cationic dyes, using higher dye concentrations. (For this comparison, the KL values for the other dyes, expressed in L/(mg dye) by other groups, were converted into L/(mol dye) units.) There are examples for exothermic [41] as well as for endothermic [21,34]
cationic dye adsorption on GO, noting again that much higher dye concentrations were used by the other groups.
The adsorption data may also be discussed at the molecular scale. If the adsorbed dye cations were oriented with their planes parallel with the basal planes of the GO nanosheets, the monolayer of OX cations would cover an area defined by
FGO=NA⋅AOX⋅nm (6)
where NA is Avogadro’s number and AOX is the cross sectional area of the dye cation. Taking the dimensions of OX cation from the quantum
3 4 5 6 7 8 9 10
-4 -3 -2 -1 0
net proton consumption, mmol/g pH
0 1 2 3 4 5 6
0 2 4 6 8 10 12
f(pKa), mmol/g
pH
b a
Fig. 8.The potentiometric titration curves of GO and the pKa distribution calculated with SAIEUS program [71,72].
Table 3
Peak positions and quantification of the acidic groups.
pKa interval Total
3–4 4–5 5–6 6–7 7–8 8–9 9–10
Peak maximum – 4.85 – 6.46 7.58 8.50 10.03
Concentration (mol/g) – 2.9∙10−4 – 4.3∙10−4 2.4∙10−4 5.3∙10−4 1.86∙10−3 3.35∙10−3
Table 4
Absorption and fluorescence spectral data of OX in aqueous solutionsa.
Protonation
state Solvent λabsmax [nm]
εmax
[M−1cm−1] λFmax [nm] ΦF Protonated Neat water 655 1.20 ⋅ 105 670 0.047
Bis-tris buffer,
pH 6.4 655 1.25 ⋅ 105 670 0.054
CAPS buffer,
pH 10.2 655 1.26 ⋅ 105 670 0.060
Neutral 1 M NaOH 675 5.52 ⋅ 104 non-fluorescent aΦF is the fluorescence quantum yield.
Fig. 9. Concentration dependence of the fluorescence spectra of OX in aqueous GO suspensions of 2.5 mg/L at pH =6.4 and 10.2 at 20 ◦C. λex =655 nm.
chemical calculations in Ref. [76], namely AOX ~ 13 Å × 6 Å, and substituting the value of 2.8 ⋅ 105 mol/g for nm (the value obtained at pH 6.4 and 20 ◦C), a surface area of FGO =13 m2/g is obtained. This is ~60%
of the surface area of the freeze-dried GO from nitrogen adsorption, 21 m2/g.
The close agreement of these data is, however, misleading for several reasons. The OX and the N2 adsorption characterize GO in different conditions: in very dilute well suspended state and as a freeze dried monolith. They also adsorb by different mechanisms, i.e., at adsorption sites of different type. First of all, the specific surface area of the GO nanosheets in their dilute aqueous suspension is certainly much greater than that of solid GO. Furthermore, it is unlikely that the adsorbed OX cations form a closely packed monolayer aligned with their plane par- allel to the GO nanosheets, partly due to their diethyl substituted N re- gions and also owing to the epoxide oxygens randomly roughening the GO surface. From Raman spectroscopic observations of this GO it was found that the intensity ratio of the graphitic and defect peaks IG/ID is 1.18 ±0.01 [45], which is an indication that the GO surface is severely damaged by the edge sites, the decorating O atoms and the carbon va- cancies within the sheet.
The cross sectional area computed from quantum chemical consid- erations also ignores the water molecules attracted to OX. A further ef- fect that may make the adsorption mechanism of OX more complicated – at least at higher OX concentrations – is that OX cations tend to form dimers at locations of high negative charge densities [77] and the edges of GO nanosheets are such positions.
Methylene blue is a well known and widely used cationic dye of very similar structure and more or less comparable molecular dimensions with a thickness of 4.7 Å. Therefore, the area of the methylene blue dye
molecule with very similar chemical end geometrical structure, might be a good experimental estimate. It is 1.7 times larger than the OX area from quantum chemical calculations [78]. Even though with this concept we come even closer to the nitrogen surface area, any conclu- sion about a compact monolayer would be misleading.
The main molecular interactions might be i) the electrostatic attraction between the deprotonated functional groups of the GO and the positively charged N of the OX, and ii) the π – π interactions between the quasi-aromatic regions of the adsorbent and the adsorbate. In view of the strong interaction it is more probable that they are bound to the negatively charged carboxylate units located at the edge of the GO nanosheets via electrostatic interactions. The geometry of the OX probe molecule and the high population of the deprotonated surface sites preclude a 1:1 correlation of the oppositely charged partners.
4. Conclusions
Our work on the adsorption of OX on GO demonstrates that the high sensitivity of fluorescence detection allows us to study the adsorption in the range of unusually low dye concentrations with only a limited amount of GO, and does not require separation of the “supernatant”. The adsorption isotherms were determined at pH 6.4 and 10.2 at tempera- tures 20 and 35 ◦C. They were all in good agreement with the Langmuir equation. The nm saturation capacities corresponded to a few percent occupancy of the dissociated acidic functions of GO nanosheets by OX cations. The nm values for OX were lower than those reported for the adsorption of other cationic dyes on GO, measured at similar pH values and temperatures, but on samples with higher dye concentrations. The KL adsorption equilibrium constants were one or two orders of magni- tude higher than the respective values for the adsorption of other cationic dyes from more concentrated solutions. This indicates that the adsorption from the dilute solutions is governed by the strong in- teractions at the most active binding sites of GO. The temperature dependence of the KL values indicates that the adsorption of OX is an exothermic process. The results may contribute to the development of GO based optical sensors.
Declaration of Competing Interest
The authors declare that they have no known competing financial interests or personal relationships that could have appeared to influence the work reported in this paper.
Acknowledgement
The authors are grateful to J. Jagiello for kindly providing the SAIEUS program and to C. Ania for her contribution to pKa distribution calculations. We acknowledge the help of J. Madar´asz for the XRD dif- fractogram and extend our warm thanks to G. Bosznai for his invaluable technical assistance.
Funding
This research was supported by the OTKA grants K 128410 and FK 125074 from National Research, Development and Innovation Office (NRDI). The research reported in this paper and carried out at BME has been supported by the NRDI Fund (TKP2020 IES, Grants BME-IE-BIO and BME-IE-NAT) based on the charter of bolster issued by the NRDI Office under the auspices of the Ministry for Innovation and Technology.
A. Paudics thanks the Ministry for Innovation and Technology, Hungary, for the support by UNKP-19-3 New National Excellence Program. S.
Farah is grateful to the Stipendium Hungaricum scholarship program, the Ministry of Higher Education and Research Sudan as well as Uni- versity of Khartoum, Sudan for the financial support.
Fig. 10. Adsorption of OX on GO, measured in solutions of pH 6.4 and 10.2 at 20 ◦C and 35 ◦C. Symbols are the measured data. The solid lines represent the hyperbolic Langmuir fit.
Table 5
Parameters of Langmuir isotherms for the adsorption of OX on GO.
Isotherms nm [mol/g] KL [L/mol] R2
pH 6.4 20 ◦C (2.8 ±0.1)∙10−5 (1.5 ±0.1)∙108 0.999 35 ◦C (2.3 ±0.1)∙10−5 (9.8 ±0.5)∙107 0.998 pH 10.2 20 ◦C (5.0 ±0.2)∙10−5 (6.4 ±0.7)∙108 0.996
35 ◦C (3.6 ±0.1)∙10−5 (4.9 ±0.5)∙108 0.993
Table 6
Thermodynamic data for the adsorption of OX on GO.
ΔH [kJ/mol] ΔS [J/(molK)]
pH 6.4 − 39.6 78.0
pH 10.2 − 15.7 119.3
Appendix A. Supplementary material
Supplementary data to this article can be found online at https://doi.
org/10.1016/j.apsusc.2020.148451.
References
[1] B.C. Brodie, On the atomic weight of graphite, Philos. Trans. Roy. Soc., Lond. 149 (1859) 249–259, https://doi.org/10.1098/rstl.1859.0013.
[2] K.S. Novoselov, A.K. Geim, S.V. Morozov, D. Jiang, Y. Zhang, S.V. Dubonos, I.
V. Grigorieva, A.A. Firsov, Electric field effect in atomically thin carbon films, Science 306 (2004) 666–669, https://doi.org/10.1126/science.1102896.
[3] S. Pei, H.M. Cheng, The reduction of graphene oxide, Carbon 50 (2012) 3210–3228, https://doi.org/10.1016/j.carbon.2011.11.010.
[4] S. Park, R.S. Ruoff, Chemical methods for the production of graphenes, Nat.
Nanotechnol. 4 (2009) 217–224, https://doi.org/10.1038/nnano.2009.58.
[5] M.J. Fern´andez-Merino, L. Guardia, J.I. Paredes, S. Villar-Rodil, P. Solís-Fern´andez, A. Martínez-Alonso, J.M.D. Tasc´on, Vitamin C is an ideal substitute for hydrazine in the reduction of graphene oxide suspensions, J. Phys. Chem. C 6426 (6432) (114 2010,), pp. 10.1021/jp100603h.
[6] G. Eda, M. Chhowalla, Chemically derived graphene oxide: towards large-area thin-film electronics and optoelectronics, Adv. Mater. 22 (2010) 2392–2415, https://doi.org/10.1002/adma.200903689.
[7] D.R. Dreyer, S. Park, C.W. Bielawski, R.S. Ruoff, The chemistry of graphene oxide, Chem. Soc. Rev. 39 (2010) 228–240, https://doi.org/10.1039/B917103G.
[8] C. Hontoria-Lucas, A.J. L´opez-Peinado, J.de D. L´opez-Gonz´alez, M.L. Rojas- Cervantes, R.M. Martín-Aranda, Study of oxygen-containing groups in a series of graphite oxides: physical and chemical characterization, Carbon 33 (1995) 1585–1592, https://doi.org/10.1016/0008-6223(95)00120-3.
[9] B. Konkena, S. Vasudevan, Understanding aqueous dispersibility of graphene oxide and reduced graphene oxide through pKa measurements, J. Phys. Chem. Lett. 3 (2012) 867–872, https://doi.org/10.1021/jz300236w.
[10] L. Bacakova, J. Pajorova, M. Tomkova, R. Matejka, A. Broz, J. Stepanovska, S. Prazak, A. Skogberg, S. Siljander, P. Kallio, Applications of nanocellulose/
nanocarbon composites: focus on biotechnology and medicine, Nanomaterials 10 (2020) 196–227, https://doi.org/10.3390/nano10020196.
[11] P.T. Yin, S. Shah, M. Chhowalla, K.-B. Lee, Design, synthesis, and characterization of graphene−nanoparticle hybrid materials for bioapplications, Chem. Rev. 115 (2015) 2483–2531, https://doi.org/10.1021/cr500537t.
[12] D. Chen, H. Feng, J. Li, Graphene oxide: preparation, functionalization, and electrochemical applications, Chem. Rev. 112 (2012) 6027–6053, https://doi.org/
10.1021/cr300115g.
[13] D. Plach´a, J. Jampilek, Graphenic materials for biomedical applications, Nanomaterials 9 (2019) 1758–1794, https://doi.org/10.3390/nano9121758.
[14] S. Bullo, K. Buskaran, R. Baby, D. Dorniani, S. Fakurazi, M.Z. Hussein, Dual drugs anticancer nanoformulation using graphene oxide-PEG as nanocarrier for protocatechuic acid and chlorogenic acid, Pharm. Res. 36 (2019) 91–101, https://
doi.org/10.1007/s11095-019-2621-8.
[15] O. Akhavan, E. Ghaderi, H. Emamy, Nontoxic concentrations of PEGylated graphene nanoribbons for selective cancer cell imaging and photothermal therapy, J. Mater. Chem. 22 (2012) 20626–20633, https://doi.org/10.1039/c2jm34330d.
[16] S. Li, A.N. Aphale, I.G. Macwan, P.K. Patra, W.G. Gonzalez, J. Miksovska, R.
M. Leblanc, Graphene oxide as a quencher for fluorescent assay of amino acids, peptides, and proteins, ACS Appl. Mater. Interfaces 4 (2012) 7069–7075, https://
doi.org/10.1021/am302704a.
[17] M. Zhang, B.-C. Yin, X.-F. Wang, B.-C. Ye, Interaction of peptides with graphene oxide and its application for real-time monitoring of protease activity, Chem.
Commun. 47 (2011) 2399–2401, https://doi.org/10.1039/C0CC04887A.
[18] H. Tiwari, N. Karki, M. Pal, S. Basak, R.K. Verma, R. Bal, N.D. Kandpal, G. Bisht, N.
G. Sahoo, Functionalized graphene oxide as a nanocarrier for dual drug delivery applications: the synergistic effect of quercetin and gefitinib against ovarian cancer cells, Colloids Surf. B 178 (2019) 452–459, https://doi.org/10.1016/j.
colsurfb.2019.03.037.
[19] Z.M. Wang, K. Shishibori, K. Hoshinoo, H. Kanoh, T. Hirotsu, Examination of synthesis conditions for graphite-derived nanoporous carbon–silica composites, Carbon 44 (2006) 2479–2488, https://doi.org/10.1016/j.carbon.2006.05.018.
[20] O. Akhavan, E. Ghaderi, S.A. Shirazian, Near infrared laser simulation of human neural stem cells into neurons on graphene nanomesh semiconductors, Colloids Surf. B 126 (2015) 313–321, https://doi.org/10.1016/j.colsurfb.2014.12.027.
[21] T. Hartonoa, S. Wanga, Q. Mab, Z. Zhu, Layer structured graphite oxide as a novel adsorbent for humic acid removal from aqueous solution, J Coll. Interf. Sci. 333 (2009) 114–119, https://doi.org/10.1016/j.jcis.2009.02.005.
[22] A. Meidanchi, O. Akhavan, Superparamagnetic zinc ferrite spinel–graphene nanostructures for fast wastewater purification, Carbon 69 (2014) 230–238, https://doi.org/10.1016/j.carbon.2013.12.019.
[23] H. Yan, H. Wu, K. Li, Y. Wang, X. Tao, H. Yang, A. Li, R. Cheng, Influence of the surface structure of graphene oxide on the adsorption of aromatic organic compounds from water, ACS Appl. Mater. Interf. 7 (2015) 6690–6697, https://doi.
org/10.1021/acsami.5b00053.
[24] C. G´omez-Navarro, J.C. Meyer, R.S. Sundaram, A. Chuvilin, S. Kurasch, M. Burghard, K. Kern, U. Kaiser, Atomic structure of reduced graphene oxide, Nano Lett. 10 (2010) 1144–1148, https://doi.org/10.1021/nl9031617.
[25] P. Zheng, N. Wu, Fluorescence and sensing applications of graphene oxide and graphene quantum dots: a review, Chem. Asian J. 12 (2017) 2343–2353, https://
doi.org/10.1002/asia.201700814.
[26] C.I.L. Justino, A.R. Gomes, A.C. Freitas, A.C. Duarte, T.A.P. Rocha-Santos, Graphene based sensors and biosensors, Trends Anal. Chem. 91 (2017) 53–66, https://doi.org/10.1016/j.trac.2017.04.003.
[27] J.-L. Chen, X.-P. Yan, K. Meng, S.-F. Wang, Graphene oxide based photoinduced charge transfer label-free near-infrared fluorescent biosensor for dopamine, Anal.
Chem. 83 (2011) 8787–8793, https://doi.org/10.1021/ac2023537.
[28] A.K. Akhila, N.K. Renuka, Coumarin–graphene turn-on fluorescent probe for femtomolar level detection of copper(II), New J. Chem. 43 (2019) 1001–1008, https://doi.org/10.1039/C8NJ04732D.
[29] E. Morales-Narv´aez, A. Merkoçi, Graphene Oxide as an Optical Biosensing Platform, Adv. Mater. 24 (2012) 3298–3308, https://doi.org/10.1002/
adma.201200373.
[30] X. Deng, H. Tang, J. Jiang, Recent progress in graphene-material-based optical sensors, Anal. Bioanal. Chem. 406 (2014) 6903–6916, https://doi.org/10.1007/
s00216-014-7895-4.
[31] P.M. Neema, A.M. Tomy, J. Cyriac, Chemical sensor platforms based on fluorescence resonance energy transfer (FRET) and 2D materials, Trends Analyt.
Chem. 124 (2020) 115797, https://doi.org/10.1016/j.trac.2019.115797.
[32] A. Pramanik, S.R. Chavva, Z. Fan, S.S. Sinha, B. Priya, V. Nelloreand, P.C. Ray, Extremely high two-photon absorbing graphene oxide for imaging of tumor cells in the second biological window, J. Phys. Chem. Lett. 5 (2014) 2150–2154, https://
doi.org/10.1021/jz5009856.
[33] Z. Fan Pramanik, S.R. Chavva, S.S. Sinha, P.C. Ray, Highly efficient and excitation tunable two-photon luminescence platform for targeted multi-color MDRB imaging using graphene oxide, Sci. Rep. 4 (6090) (2014), https://doi.org/10.1038/
srep06090.
[34] W. Konicki, M. Aleksandrzak, E. Mijowska, Equilibrium, kinetic and thermodynamic studies on adsorption of cationic dyes from aqueous solutions using graphene oxide, Chem. Eng. Res. Des. 123 (2017) 35–49, https://doi.org/
10.1016/j.cherd.2017.03.036.
[35] P. Bradder, S.K. Ling, S. Wang, S. Liu, Dye adsorption on layered graphite oxide, J. Chem. Eng. Data 56 (2011) 138–141, https://doi.org/10.1021/je101049g.
[36] G.K. Ramesha, A.V. Kumara, H.B. Muralidhara, S. Sampath, Graphene and graphene oxide as effective adsorbents toward anionic and cationic dyes, J. Colloid Interf. Sci. 361 (2011) 270–277, https://doi.org/10.1016/j.jcis.2011.05.050.
[37] S.-T. Yang, S. Chen, Y. Chang, A. Cao, Y. Liu, H. Wang, Removal of methylene blue from aqueous solution by graphene oxide, J. Colloid Interf. Sci. 359 (2011) 24–29, https://doi.org/10.1016/j.jcis.2011.02.064.
[38] N. Kundu, A. Roy, D. Banik, J. Kuchlyan, N. Sarkar, Graphene oxide and pluronic copolymer aggregates−possible route to modulate the adsorption of fluorophores and imaging of live cells, J. Phys. Chem. C 119 (2015) 25023–25035, https://doi.
org/10.1021/acs.jpcc.5b05251.
[39] M. Rajabi, O. Moradi, M. Sillanp¨a¨a, K. Zare, A.M. Asiri, S. Agarwal, V.K. Gupta, Removal of toxic chemical ethidiummonoazide bromide using graphene oxide:
thermodynamic and kinetics study, J. Mol. Liq. 293 (2019) 111484–111493, https://doi.org/10.1016/j.molliq.2019.111484.
[40] A.I. Abd-Elhamid, H.F. Aly, H.A.M. Soliman, A.A. El-Shanshory, Graphene oxide:
follow the oxidation mechanism and its application in water treatment, J. Mol. Liq.
265 (2018) 226–237, https://doi.org/10.1016/j.molliq.2018.05.127.
[41] S.-J. Song, Y.-F. Ma, H. Shen, M.-X. Zhang, Z.-J. Zhang, Removal and recycling of ppm levels of methylene blue from an aqueous solution with graphene oxide, RSC Adv. 5 (2015) 27922–27932, https://doi.org/10.1039/C4RA16982D.
[42] H. Kim, S.-O. Kang, S.Y. Park, H.S. Park, Adsorption isotherms and kinetics of cationic and anionic dyes on three-dimensional reduced graphene oxide macrostructure, J. Ind. Eng. Chem. 21 (2015) 1191–1196, https://doi.org/
10.1016/j.jiec.2014.05.033.
[43] J.-Z. Sun, Z.H. Liao, R.-W. Si, G.P. Kingori, F.-X. Chang, L. Gao, Y. Shen, X. Xiao, X.
Y. Wu, Y.-C. Yong, Adsorption and removal of triphenylmethane dyes from water by magnetic reduced graphene oxide, Water Sci. Technol. 70 (2014) 1663–1669, https://doi.org/10.2166/wst.2014.427.
[44] X. Lv, C.M. Gao, T.H. Han, H. Shi, W. Guo, Improving the quantum yields of fluorophores by inhibiting twisted intramolecular charge transfer using electron- withdrawing group-functionalized piperidine auxochromes, Chem. Commun. 56 (2020) 715–718, https://doi.org/10.1039/C9CC09138F.
[45] S. Farah, A. Farkas, J. Madar´asz, K. L´aszl´o, Comparison of thermally and chemically reduced graphene oxides by thermal analysis and Raman spectroscopy, J. Therm. Anal. Calor. (2020), https://doi.org/10.1007/s10973-020-09719-3.
[46] W.S. Hummers, R.E. Offeman, Preparation of graphitic oxide, J. Am. Chem. Soc. 80 (1958), https://doi.org/10.1021/ja01539a017, 1339–1339.
[47] D.C. Marcano, D.V. Kosynkin, J.M. Berlin, A. Sinitskii, Z. Sun, A. Slesarev, L.
B. Alemany, W. Lu, J.M. Tour, Improved synthesis of graphene oxide, ACS Nano 4 (2010) 4806–4814, https://doi.org/10.1021/nn1006368.
[48] L.G. Cancado, K. Takai, T. Enoki, General equation for the determination of the crystallite size La of nanographite by Raman spectroscopy, Appl. Phys. Letters 88 (2006) 163106, https://doi.org/10.1063/1.2196057.
[49] K. L´aszl´o, E. Tomb´acz, K. Josepovits, Effect of activation on the surface chemistry of carbons from polymer precursors, Carbon 39 (2001) 1217–1228, https://doi.
org/10.1016/S0008-6223(00)00245-1.
[50] H.D. Everett, Reporting data on adsorption from solution at the solid/solution interface, Pure Appl. Chem. 58 (1986) 967–984, https://doi.org/10.1351/
pac198658070967.
[51] A. Cuesta, P. Dhamelincourt, J. Laureyns, A. Martínez-Alonso, J.M.D. Tasc´on, Raman microprobe studies on carbon materials, Carbon 32 (1994) 1523–1532, https://doi.org/10.1016/0008-6223(94)90148-1.
[52] S. Claramunt, A. Varea, D. Lopez-Díaz, M.M. Vel´ ´azquez, A. Cornet, A. Cirera, The importance of interbands on the interpretation of the Raman spectrum of graphene oxide, J. Phys. Chem. C 119 (2015) 10123–10129, https://doi.org/10.1021/acs.
jpcc.5b01590.
[53] S. Vollebregt, R. Ishihara, F.D. Tichelaar, Y. Hou, C.I.M. Beenakker, Influence of the growth temperature on the first and second-order Raman band ratios and widths of carbon nanotubes and fibers, Carbon 50 (2012) 3542–3554, https://doi.
org/10.1016/j.carbon.2012.03.026.
[54] X. Díez-Betriu, S. Alvarez-García, C. Botas, P. ´Alvarez, J. S´anchez-Marcos, C. Prieto, R. Men´endez, A. de Andr´es, Raman spectroscopy for the study of reduction mechanisms and optimization of conductivity in graphene oxide thin films, J. Mater. Chem. C 1 (2013) 6905–6912, https://doi.org/10.1039/C3TC31124D.
[55] D. L´opez-Díaz, M. L´opez Holgado, J.L. García-Fierro, M.M. Vel´azquez, Evolution of the Raman spectrum with the chemical composition of graphene oxide, J. Phys.
Chem. C 121 (2017) 20489–20497, https://doi.org/10.1021/acs.jpcc.7b06236.
[56] O. Akhavan, Bacteriorhodopsin as a superior substitutefor hydrazine in chemical reduction of single-layer graphene oxide sheets, Carbon 81 (2015) 158–166, https://doi.org/10.1016/j.carbon.2014.09.044.
[57] D. Yin, N. Lu, Z.-Y. Li, J.-L. Yang, A computational infrared spectroscopic study of graphene oxide, J. Chem. Phys. 139 (2013) 084704, https://doi.org/10.1063/
1.4818539.
[58] X. Jiao, Y. Qiu, L. Zhangab, X. Zhang, Comparison of the characteristic properties of reduced graphene oxides synthesized from natural graphites with different graphitization degrees, RSC Adv. 7 (2017) 52337–52344, https://doi.org/
10.1039/C7RA10809E.
[59] M. Mohai Bert´oti, K. L´aszl´o, Surface modification of graphene and HOPG by nitrogen plasma: quantitative XPS analysis of chemical state alterations, Carbon 84 (2015) 185–196, https://doi.org/10.1016/j.carbon.2014.11.056.
[60] H.K. Jeong, Y.P. Lee, R.J. Lahaye, M.H. Park, K.H. An, I.J. Kim, et al., Evidence of graphitic AB stacking order of graphite oxides, J. Am. Chem. Soc. 130 (2008) 1362–1366, https://doi.org/10.1021/ja076473o.
[61] R. Larciprete, S. Gardonio, L. Petaccia, S. Lizzit, Atomic oxygen functionalization of double walled C nanotubes, Carbon 47 (2009) 2579–2589, https://doi.org/
10.1016/j.carbon.2009.05.008.
[62] I.-S. Byun, W. Kim, D.W. Boukhvalov, I. Hwang, J.W. Son, G. Oh, et al., Electrical control of nanoscale chemical modification in graphene, NPG Asia Mater. 6 (2014) 102–107, https://doi.org/10.1038/am.2014.24.
[63] J.-H. Zhou, Z.-J. Sui, J. Zhu, P. Li, D. Chen, Y.-C. Dai, et al., Characterization of surface oxygen complexes on carbon nanofibers by TPD, XPS and FT-IR, Carbon 45 (2007) 785–796, https://doi.org/10.1016/j.carbon.2006.11.019.
[64] X. Xu, J. Zhu, Graphene− metal particle nanocomposites, J. Phys. Chem. C 112 (2008) 19841–19845, https://doi.org/10.1021/jp807989b.
[65] A. Yang, G. Velamakanni, S. Bozoklu, M. Park, R.D. Stoller, Piner, et al., Chemical analysis of graphene oxide films after heat and chemical treatments by X-ray photoelectron and Micro-Raman spectroscopy, Carbon 47 (2009) 145–152, https://doi.org/10.1016/j.carbon.2008.09.045.
[66] F. Liu, T. Seok Seo, A controllable self-assembly method for large-scale synthesis of graphene sponges and free-standing graphene films, Adv. Funct. Mater. 20 (2010) 1930–1936, https://doi.org/10.1002/adfm.201000287.
[67] O. Akhavan, E. Ghaderi, A. Akhavan, Size-dependent genotoxicity of graphene nanoplatelets in human stem cells, Biomaterials 33 (2012) 8017–8025, https://doi.
org/10.1016/j.biomaterials.2012.07.040.
[68] A. Achour, S. Vizireanu, G. Dinescu, L. Le Brizoual, M.-A. Djouadi, M. Boujtita, Electrochemical anodic oxidation of nitrogen doped carbon nanowall films: X-ray photoelectron and Micro-Raman spectroscopy study, Appl. Surf. Sci. 273 (2013) 49–57, https://doi.org/10.1016/j.apsusc.2013.01.112.
[69] Y. Kozawa, S. Mouri Miyauchi, K. Matsuda, Exploring the origin of blue and ultraviolet fluorescence in graphene oxide, J. Phys. Chem. Lett. 4 (2013) 2035–2040, https://doi.org/10.1021/jz400930f.
[70] J. Jagiello, T.J. Bandosz, J.A. Schwarz, Carbon surface characterization in terms of its acidity constant distribution, Carbon 32 (1994) 1026–1028, https://doi.org/
10.1016/0008-6223(94)90066-3.
[71] J. Jagiello, Stable numerical solution of the adsorption integral equation using splines, Langmuir 10 (1994) 2778–2785, https://doi.org/10.1021/la00020a045.
[72] J. Rouquerol, F. Rouquerol, P. Llewellyn, G. Maurin, K. Sing, Adsorption by Powders and Porous Solids. Principles, Methodology and Applications, second ed., Academic Press, 2013.
[73] Y. Liu, Is the free energy change of adsorption correctly calculated? J. Chem. Eng.
Data 54 (2009) 1981–1985, https://doi.org/10.1021/je800661q.
[74] R.A. Singam, Y.-T. Zhang, G. Magnin, I. Miranda-Carvajal, L. Coates, R. Thakkar, H. Poblete, J. Comer, Thermodynamics of adsorption on graphenic surfaces from aqueous solution, J. Chem. Theory Comput. 15 (2019) 1302–1316, https://doi.
org/10.1021/acs.jctc.8b00830.
[75] M.F. Li, Y.-G. Liu, G.-M. Zeng, S.-B. Liu, X.-J. Hu, D. Shu, L.-H. Jiang, X.-F. Tan, X.- X. Cai, Z.-L. Yan, Tetracycline absorbed onto nitrilotriacetic acid-functionalized magnetic graphene oxide: influencing factors and uptake mechanism, J. Coll.
Interface Sci. 485 (2017) 269–279, https://doi.org/10.1016/j.jcis.2016.09.037.
[76] M. Sayed, M. Sundararajan, J. Mohanty, A.C. Bhasikuttan, H. Pal, Photophysical and quantum chemical studies on the interactions of oxazine-1 dye with cucurbituril macrocycles, J. Phys. Chem. B 119 (2015) 3046–3057, https://doi.
org/10.1021/jp509243j.
[77] M. Kubinyi, T. Vid´oczy, O. Varga, K. Nagy, I. Bitter, Absorption and fluorescence spectroscopic study on complexation of oxazine 1 dye by calix[8]arenesulfonate, Appl. Spectrosc. 59 (2005) 134–139, https://doi.org/10.1366/
0003702052940477.
[78] J.J. Kipling, Adsorption from Solutions of Non-Electrolytes, Academic Press, London, 1965.

![Fig. 8. The potentiometric titration curves of GO and the pK a distribution calculated with SAIEUS program [71,72]](https://thumb-eu.123doks.com/thumbv2/9dokorg/1060092.69755/6.892.79.823.84.365/fig-potentiometric-titration-curves-distribution-calculated-saieus-program.webp)