Research Article
A Simple and Scalable Method for the Preparation of Magnetite/Graphene Oxide Nanocomposites under Mild Conditions
Tam ´as Szab ´o ,
1Lilla N´anai,
1D´aniel Nesztor,
1Bal´azs Barna,
1Ondˇrej Malina,
2and Etelka Tomb´acz
11Department of Physical Chemistry and Materials Science, University of Szeged, Aradi v´ertan´uk tere 1, Szeged 6720, Hungary
2Regional Centre of Advanced Technologies and Materials, Department of Experimental Physics and Physical Chemistry, Faculty of Science, Palack´y University in Olomouc, ˇSlechtitel˚u 27, 783 71 Olomouc, Czech Republic
Correspondence should be addressed to Tam´as Szab´o; sztamas@chem.u-szeged.hu Received 5 September 2017; Accepted 31 October 2017; Published 21 January 2018
Academic Editor: Ilia Ivanov
Copyright © 2018 Tam´as Szab´o et al. This is an open access article distributed under the Creative Commons Attribution License, which permits unrestricted use, distribution, and reproduction in any medium, provided the original work is properly cited.
Nanostructured composite dispersions containing magnetic nanoparticles (MNPs) and graphene oxide (GO) lamellae have been prepared by a simple and easily scalable room temperature procedure. We show that, owing to the enormous surface area and negative surface charge developed in aqueous GO suspensions, large amounts of positively charged MNPs can be electrostatically attached to the layered host. This procedure is superior to many previous synthesis pathways because it exploits the charge- regulated adhesion of naked MNPs to GO resulting in the formation of stable and uniform nanocomposite materials in a wide composition range without any preliminary functionalization steps or harsh conditions that may lead to chemical degradation of the graphene-based nanosheets.
1. Introduction
Functional magnetic nanocomposites have been the focus of recent research due to their envisioned applications in biomedical, pharmaceutical, environmental, or nano- electronic fields [1–5]. The most efficient use of these systems inevitably requires the precise control over their chemical and nanostructure. The elaboration of fast, efficient, and easily scalable methods is then pursued, which enables to obtain tailor-made synthesis solutions for specific applica- tions. With the advent of graphene in emerging technolo- gies, many studies have been published in the recent few years about the preparation and characterization of mag- netically modified graphene-based materials. Graphene oxide (GO) is the most prominent host of magnetic nanoparticle (MNP) composites because its properties make it advantageous for large-scale production. Owing to their polar and ionisable surface sites [6], GO particles and their functionalized derivatives [7, 8] are easily processable in
aqueous media, which favors the interaction of the lamellar host with the simplest, water-soluble iron salts (e.g., FeSO4
or FeCl3) and complexes as precursors [9–12]. Graphene- based composites are then obtained by transformation of GO to reduced graphene oxide (RGO). Extensive literature survey reveals three general synthesis routes for the for- mation of magnetic graphene particles: hydrothermal (more broadly and solvothermal) approaches [13–21], direct py- rolysis [9, 11, 22], and coprecipitation [23–30], all of which rely on in situ crystallization of MNPs on the carbonaceous layers and usually lead to the simultaneous reduction of GO to RGO.
However, some potential applications (e.g., drug delivery [31, 32]) strongly demand that the oxidized form of the carbon counterpart of the magnetic composite remains unaltered after the composite formation. Although the coprecipitation [33, 34] and chemical grafting [35, 36]
methods have been used under relatively mild conditions (∼80°C reaction temperature), the presence of bases at
Volume 2018, Article ID 1390651, 11 pages https://doi.org/10.1155/2018/1390651
elevated temperatures inevitably results in partial de- oxygenation of the GO framework [37, 38]. Another, more viable strategy is the preliminary functionalization of the magnetite nanoparticles [39], sulfonation of graphene oxide [40], or derivatization of both constituents by coupling azide-modified MNPs with alkyne-functionalized GO as reported by Namvari and Namazi [41]. The drawback of such routes is that they often require more tedious and com- plicated operations. Thus, it is still desirable to develop a more facile and efficient method for the preparation of magnetically modified GO materials.
In the present work, we report on a one-pot scalable method for the combination of magnetic nanoparticles with graphene oxide nanosheets exploiting the electrostatic in- teraction between their colloidal particles in aqueous so- lutions as provided by the development of their opposite surface charge. The structural and colloidal characteristics of the single and nanocomposite dispersions are characterized in detail. Up to now, to the best of our knowledge, there have been no other reports on the stable and strong attachment of Fe3O4 to graphene oxide in the absence of any function- alization scheme involved in the synthesis process.
2. Materials and Methods
2.1. Materials. For the synthesis of graphite oxide, we used purified (99.9 wt.% C) graphite flakes of natural origin (codenamed as SGA-20) purchased from Kropfm¨uhl GmbH, Germany. The samples were also fractionated by the manufacturer (d90<50µm, d50�16–21µm). NaNO3, KMnO4, the iron precursor salts, concentrated sulfuric acid, and 30 wt.% hydrogen peroxide solutions were purchased from Molar Chemicals Ltd., Hungary. NaCl, NaOH, and HCl solutions used for maintaining constant background salt concentrations and constant pHs were used in analytical purity (Reanal). Water was deionised by ion exchange only for dialysis, while it was deionised by reverse osmosis and purified from particulate contaminants for all of the syn- theses and light-scattering studies by Zeneer Power (TOC)- RO&UP System.
2.2. Synthesis of Graphite Oxide by Hummers-Offeman Method. A round-bottom flask was filled with 1 g of graphite and 1 g of NaNO3, which have been mixed together before 30 mL of cc. H2SO4was added. The suspension was stirred continuously with a magnetic stirrer, and 3×1 g of KMnO4 was added in three portions hour by hour, upon which the thick slurry turned to green and became more viscous due to the swelling of the graphite structure and the formation of graphite bisulphate. It was then heated to 52± 3°C and kept at this temperature for 6 hours. The oxidation reaction was terminated by the slow addition of 30 mL water close to 0°C, and then H2O2solution (∼2 mL) was gradually added until the suspension turned to golden brown and the effervescence discontinued. The as-obtained acidic slurry was centrifuged for 10 minutes at 3400 rpm 3-4 times with intermittent removal of the supernatant and redispersion of the settled GO particles. During the successive increase of
the pH of the dispersion medium, GO particles became colloidally stable, and centrifugation was incapable to re- move them from the liquid phase. Therefore, the wet sed- iment was transferred to dialysis bags and dialyzed for ca.
10 days with periodic change of deionized water until its conductivity was steadily below 10µS/cm. GO was stored in aqueous suspension form, the concentration of which was determined by evaporating a known mass of dispersion to air-dry state.
2.3. Synthesis of MNPs. Magnetite nanoparticles were syn- thesized by alkaline hydrolysis [42–44] of FeCl2×4 H2O and FeCl3×6 H2O. The concentrated solutions of iron (II) and iron (III) salts were mixed in the molar ratio of 1.1 to 2 and filtered into fresh water using a microfilter of 0.2µm pore size. The calculated amount of freshly prepared NaOH solution was added in 10% excess to the doubly diluted iron salt solution in two portions, the first half slowly and the second half rapidly under rigorous stirring. The formed black suspension was stirred for few minutes and then transferred into a larger amount of water. The suspension was washed with water several times to eliminate the alkaline impurities from synthesis, then acidified with HCl solution down to pH∼2, and washed again with water until disaggre- gation. The next step was the hydrothermal ageing of stable suspension in an ultrasonic bath at 80°C for 30 minutes. Finally, it was dialyzed against 0.001 M HCl. The magnetite concen- tration was determined gravimetrically from a sample dried at 105°C. The stock suspension (5.78 g magnetite in 100 g 0.001 M HCl) was stored in the dark at 4°C.
2.4. Preparation of GO/MNP Nanocomposites. 10 g/L aque- ous suspensions of the magnetic iron oxide and the graphite oxide phases directly diluted from the respective stock dispersions were used for the formation of composite ma- terials. They were sonicated for 30 s before rapidly mixing them in appropriate volumes and, if necessary, adding water so that the total concentration of magnetite was 5 g/L. The concentration of GO was varied so that composite samples within the GO/MNP weight ratio range of 1/50 to 10/1 were obtained and stored in liquid-dispersed state for further studies. The final pH of suspensions were within the pH�4.5–6 range.
2.5. Characterization. X-ray diffraction (XRD) analysis was performed by a Bruker D8 Advance diffractometer equipped with a G¨obel mirror to yield a parallel beam of CuKαra- diation, which passed through a 1.2 mm slit. The X-ray tube was operated with 40 kV acceleration voltage at 30 mA current. The diffraction data were collected with a count time of 1 s per step and sampling width of 0.02°.
FTIR measurements were conducted in attenuated total reflection (ATR) mode using a Bio-Rad Digilab Division FTS-65A/896 instrument equipped with a single reflection ATR accessory made of diamond and a DTGS detector. 128 scans were collected and averaged to obtain the spectra in 2 cm−1 digital resolution.
Raman spectra were collected on a Thermo Scientific DXR Raman microscope equipped with a diode-pumped frequency-doubled Nd-YAG laser. Samples were irradiated at a wavelength of 532.2 nm, with the laser beam focused using a 20×objective lens. 1 mW laser power was used to record the spectra. The instrument had a spectral resolution better than 2 cm−1 and a spatial resolution of a few cubic micrometers as provided by a 50μm slit confocal aperture.
TEM micrographs were taken by a JEOL JEM-1400+
transmission electron microscope operating at an acceler- ating voltage of 80 kV. One droplet of diluted nano- composite dispersion was dried onto a carbon film-coated copper grid.
Dynamic light scattering measurements were taken by a NanoZS apparatus (Malvern) equipped with a 4 mW He-Ne laser source (λ633 nm). The scattered light intensity was measured at an angle of 173°. The same instrument enabled for the measurement of the electrokinetic potential of the composite particles that were determined in the same dis- persions as used for size measurements but using disposable zeta cells (DTS 1070) instead of plastic cuvettes. Composite samples were measured in highly diluted suspension to avoid significant interparticle interactions (hydrodynamic interaction or multiple light scattering).
A superconducting quantum interference device (SQUID) magnetometer (MPMS XL-7 type, Quantum Design, U.S.A.) was employed for the magnetization mea- surement at 300 K. The hysteresis loop of the naked MNP sample was measured in an external magnetic field ranging from −50 to +50 kOe. The magnetization values were cor- rected assuming the response of the sample holder and respective Pascal constants.
Magnetic fluid hyperthermia measurements were carried out by a magneTherm
™
(Nanotherics, UK) system [45, 46].The magnetic material content of each sample (bare MNP and nanocomposites at 1/50 and 1/5 mass ratios) was the same for all samples (5 g/L). After ultrasonication of 1 mL of each sample for 20 s, the heating efficiency was measured at a resonant frequency of 109.4 kHz with magnetic field of B24.67 mT (H19.9 kA/m, 17 turn coil, and 200 nF ca- pacitor) for 300 s. SAR (specific absorption rate) values were not calculated from the initial slope of heating curves be- cause their initial slopes were unusual for the nano- composites and they differ from that of the naked MNP sample probably due to their aggregation.
3. Results and Discussion
3.1. Properties of Graphite Oxide. Figure 1 shows the XRD patterns of graphite before and after its harsh oxidation treatment. Graphite powder shows an outstandingly intense reflection centered at the diffraction angle of 26.6°. The re- spective c-axis repeat distance is 3.35 ˚A, which represents the spacing between graphene layers in well-crystallized graphite grains. This (002) reflection is shifted towards much lower angle values, the position of which was found to vary with ambient humidity conditions. The typical pattern of GO features two bands, one centered at 11°, while for the secondary one appearing with much lower intensity, the diffraction angle
is doubled. The two peaks refer to the same periodic distance of 8.04 ˚A, indicating that the crystal structure of graphite expands to accommodate oxygenated functional groups and water molecules. Noteworthy is the broadening of the GO reflection as compared to graphite, which may be either caused by the nonuniform loading and distribution of water molecules between the graphene oxide sheets or by a decrease in the average flake size of graphite particles in the direction perpendicular to the carbon planes upon oxidation.
Raman spectroscopy is reported as a noninvasive tool to characterize the degree of oxidation and structure of graphene-based materials. The upper side spectrum of Figure 2 shows the Raman spectrum with well-resolved peaks characteristic for the graphite structure. The most intense and the sharpest one is the so-called G-band, which is the primary mode in many carbon materials representing the planar configuration of sp2hybridized bonds that hold together the largest part of the atomic framework of the stacked graphene sheets. It appears at 1582 cm−1, which is identical to the respective wavenumbers of the G-bands for various graphite samples (involving highly oriented pyro- lytic graphite) commonly reported in the literature [47–50].
Another in-plane vibration mode that also appears for the present and, in general, all previously studies of graphite samples is the 2D band at 2722 cm−1, which is a second-order overtone of the D-band centered at 1360 cm−1. The latter, first-order peak is not visible in perfect graphene owing to crystal symmetry considerations detailed in [47], in contrast to the parent graphite of our GO samples. The prerequisite of this band to appear is that defect or zone boundaries are abundant in the samples that enable a secondary elastic scattering of a phonon. Surprisingly, such defects are already
1 2 4 8
5 10 15 20 25 30
Intensity (cps)
Diffraction angle (degrees) Interlayer expansion
GO
Graphite
×10
Figure 1: X-ray diffractograms of graphite and graphite oxide powders. For clarity, patterns are offset along they-axis, and for graphite, it was divided by ten.
present to a relatively high extent in the pristine graphite.
Since the manufacturer does not report any harsh pre- treatment of the present samples, we think that the grains are composed of very polydisperse multilayer stacks and the nanolamellar fraction with edges constructed of sp3carbon atoms are present in relatively large proportion. The spec- trum of graphite oxide (Figure 2(b)) proves that significant changes occurred by the oxidation of the carbon lattice. The most remarkable feature is the enhancement of disorder- related bands. The D-band shows height equal to the pri- mary in-plane vibrational mode, while a scattering peak
(]2954 cm−1) appears at the higher wavenumber side of the 2D band which is ascribed to the combination of D + G modes [51]. The last prominent feature for GO is that the G-band is blue shifted by 21 cm−1 to 1603 cm−1. This is originally present as a high-energy shoulder in graphite (G′), but for highly disordered carbons such as GO, it refers to an abundance of sp3 carbon atoms similar to that obtained upon physical (e.g., electron beam irradiation [52]) or chemical (strong oxidation) impacts. The inserted micro- scopic images in Figure 2 confirm the strong structural transformation: multilayered flakes of graphite are trans- formed into a puckered thin film state where the phase boundaries of individual, wrinkled particles are no longer observable.
Changes in the ATR-FTIR spectra brought by the oxi- dation reaction are indicated in Figure 3. In the most in- formative spectral region, graphite exhibits a featureless spectrum indicating the absence of any functional groups.
On the other hand, several bands are distinguishable in the spectrum of graphite oxide. The first one appears at 1734 cm−1, and it is commonly assigned to the presence of functional groups containing the CO motif. Carbonyl groups have been mostly suggested as part of the COOH moiety, while other assignments include single ketones or quinones [53]. At 1625 cm−1, the bending vibration of physically adsorbed water molecules gives rise to a peak. This is followed by a broad hump with several weak and poorly resolved bands emerging from the baseline. Only two of them can be associated with specific oxygenated function- alities: tertiary alcohol groups around 1400 cm−1 and phe- nolic OH around 1200 cm−1; however, their exact positions cannot be exactly assessed. Finally, the spectrum of GO represents several peaks at the lowest wavenumbers origi- nating from C-C and C-O lattice vibration modes.
0 50 100 150 200
1000 1500
2000 2500
3000
Intensity (cps)
Raman wavenumber shift (cm−1) Graphite
2D
G
D
(a)
0 50 100 150 200 250 300
1000 1500
2000 2500
3000
Intensity (cps)
Raman wavenumber shift (cm−1) GO
2D
G′ D
(b)
Figure2: Raman spectra of graphite flakes (a) and graphite oxide powder (b). The insets show the optical microscopic image (at 50× magnification) of the samples.
0.0 0.4 0.8 1.2 1.6 2.0
400 900
1400 1900
Absorbance (a.u.)
Wavenumber (cm−1) GO/MNP
1/10
GO
Graphite MNP
Figure 3: ATR-FTIR spectra of graphite, graphite oxide, bare MNP, and the GO/MNP nanocomposite at 1/10 mass ratio. The spectra are offset along they-axis for clarity.
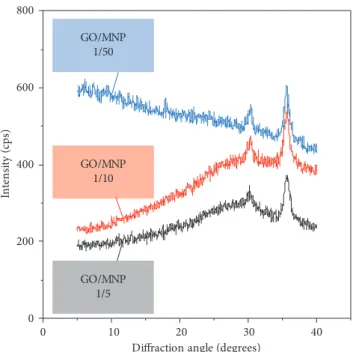
3.2. Structural Properties of GO/MNP Nanocomposites. Figure 4 shows the X-ray diffractograms of the magnetite nano- composites loaded with different amounts of GO. Two re- flections are distinguished in these samples (at 2Θ30.36° and 35.6°) that belong to the (220) and (311) lattice planes of the cubic magnetite crystal structure [54]. Since the dom- inant mass in all samples belongs to the MNP phase, the respective peak intensities do not show much variation with the composition. An average crystallite diameter was cal- culated from the broadening of the (311) reflections, and they were found to be 10 nm and obviously did not change during composite formation. Although the apparent breadth of the (220) reflection is larger for the GO/MNP 1/5 composite, this is solely due to the irregular baseline that originates from the fluorescence of the CuKαradiation on iron centers.
The most interesting feature of the powder X-ray patterns is the complete disappearance of the reflection at low angles that is characteristic for the interplanar distance of graphite oxide particles. This clearly shows that the carbon-based phase is dispersed to the level of individual graphene oxide particles. It is known that high degrees of exfoliation are achieved in aqueous GO suspensions since many atomic force microscopic studies imaged 1 nm high platelets de- posited from the liquid phase [55]. During composite for- mation with the magnetic phase, the liquid-suspended GO nanosheets exhibit an enormously high specific surface area available for the attachment of the MNPs. When the dis- persion medium is dried off from the composite particles, the coated lamellae must be restacked and become rota- tionally disordered but parallelly aligned to the sample holder, capturing iron oxide particles between the layers.
Obviously, the repeat distances in the expanded layer structure are then too large to give any diffraction peak in the studied angle range. However, it might be somewhat
surprising that the GO peak is absent even at the highest GO/MNP ratios of 1/5, for which the number of sheets may exceed the necessary area needed to accommodate the magnetite nanoparticles, and restacked empty areas could still give rise to an interlayer distance similar to that found for bare GO. This phenomenon implies that the composite particles may retain a “house of cards” structure in the dried state with single- or few-layered GO particles present in the matrix of the aggregated mass of the magnetite nanoparticles.
The ATR-FTIR spectrum of the nanocomposite of GO/MNP ratio of 1/10 is compared to that of the bare magnetite phase in Figure 3. The latter shows two peaks, one at 1620 cm−1 and another at 556 cm−1 with two minor shoulders appearing at around 630 and 700 cm−1. The former is due to the bending vibration of adsorbed water, and the others are attributed to different vibration modes of the Fe-O structure [56]. The nanocomposite shows very weak ab- sorption at wavenumbers characteristic for GO, and the iron oxide-related peaks dominate the spectrum. However, the most intense band shows a red shift by 23 cm−1, indicating a slight weakening of the bond strength between Fe and O atoms. This might be caused by the extensive hydrogen bond network between the hydroxylated GO and Fe3O4surfaces, but it is also possible that there is an abundance of positively charged surface sites (≡Fe-OH2+) developed on the iron oxide when it is contacted with GO.
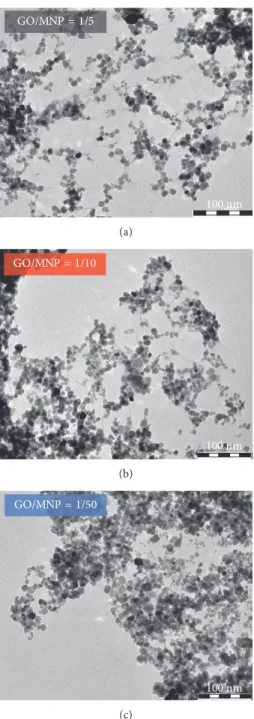
Electron microscopy revealed important differences in the nanostructure of the GO/MNP composites at different compositions (Figure 5). At the lowest MNP loadings (GO/MNP mass ratio of 1/5), the majority of the primary magnetic nanocrystals are well-distinguishable and clus- tering only occurs on a few locations of the GO surface, for example, near the top right corner of the image. With a few exceptions, the diameters of the particles fall into the range of 3–20 nm, which is typical for Fe3O4 nanophases exhib- iting superparamagnetic behavior. The average size was 9.5 nm, showing good agreement with the one determined by XRD line broadening. Graphene oxide is also visualized on the micrographs at relatively high magnifications. In the current image and in others taken at different areas of the sample, they appear as slightly curved lines with approxi- mate length of 50 nm, reminiscent of folded paper-like layers. These features give conclusive proof that the flexi- ble particles are present in a highly delaminated, single-layer state, that otherwise do not give enough contrast for direct observation by TEM. Interestingly, a relatively large fraction of magnetite nanocrystals are attached to the graphene oxide platelets following the shape of these folds or along the platelet edges, suggesting that these surface features exert stronger adhesive forces towards the MNPs. Upon in- creasing the MNP loading to tenfold excess relative to GO (Figure 5(b)), the surface coverage of particles increased proportionally. The planar distribution of particles did not change with loading: sites densely covered by magnetite were loosely interconnected, leaving behind irregularly shaped patches over the uncoated graphene oxide surfaces of several hundreds to thousands of square nanometer surface area.
However, at the highest GO/MNP ratio (1/50), the particles 0
200 400 600 800
0 10 20 30 40
Intensity (cps)
Diffraction angle (degrees) GO/MNP
1/10 GO/MNP
1/50
GO/MNP 1/5
Figure4: XRD patterns of GO/MNP nanocomposites at different mass ratios. For clarity, patterns are offset by 100 cps.
are almost fully covered, and the magnetic nanocrystals undergo significant clustering that is virtually extended to the whole imaged area.
Due to the high MNP contents, significant variations might occur at the microscopic level in the particle-to- particle compositions. Besides, once the available surface area becomes lower than that required for the deposition of the total amount of particles, the sample would lose phase homogeneity and become a mixture of a nanocomposite phase consisting of GO layers fully covered with the MNPs and a pure magnetite phase involving the rest of the MNPs.
To check this possibility, TEM images were taken on the highly loaded samples at low magnifications, which were qualitatively similar to that presented in Figure 6. We
observed that virtually all magnetic iron oxide particles were assembled only on the lamellar surfaces. This is another important finding because it indicates not only that MNPs are only dispersed on GO in the dry state but also that a stable nanocomposite phase was already present in the aqueous suspension. This latter statement is well established since it is highly unlikely that such a large amount of separated single or clustered nanocrystallites would have exclusively assembled on the GO platelet only because of the loss of the solvent.
3.3. Characteristics of Magnetic Nanocomposite Dispersions. The visual appearance of undisturbed aqueous GO/MNP dis- persions of different compositions provides important in- direct evidence on the interparticle interactions and the colloidal stability of the system. As seen from the photograph of Figure 7(a), freshly homogenized suspensions undergo rapid coagulation and start to settle immediately forming large floc-like secondary particles when their GO/MNP ratios range between 1 and 0.1. Aggregation also occurs at different loadings, as indicated by the sharp settling front in GO-rich samples, while the settling rate gradually increases with the magnetite loading (Figure 7(b)). However, when MNPs are in large excess, sedimentation slows down and becomes more diffuse, with a considerable fraction of particles remaining in suspended form after 1 hour ageing.
Nevertheless, within one day, the entire amount of nano- composite particles settles down independent of their composition (Figure 7(c)). This is in sharp contrast with the settling behavior of the respective single-component parti- cles (not shown), which retained their homogeneous spatial distribution in water for extended time periods. This macroscopic-scale observation is in excellent agreement with the one obtained by electron microscopy on the ex- clusive occurrence of MNP particles on the GO host la- mellae: both of them suggest that there is a strong interaction between the Fe3O4 and the GO surfaces. One plausible explanation for the origin of the strong adhesive forces between these dissimilar colloidal particles is an extensive hydrogen bonding between the hydroxyl group containing surfaces of GO and MNP (for the former, they are originally GO/MNP=1/5
100 nm (a)
GO/MNP=1/10
100 nm (b)
GO/MNP=1/50
100 nm (c)
Figure 5: Electron micrographs of magnetic nanocomposites at different GO/MNP mass ratios of (a) 1 to 5, (b)1 to 10, and (c) 1 to 50.
1.0 µm
Figure 6: Electron micrograph of 1/10 mass ratio GO/MNP composite at low magnification. The inset shows the enlarged edge region of the imaged particle. The scale bar refers to 1µm length.
part of the chemical structure, and for the latter, an abundance of Fe-OH surface sites form upon dissociative chemisorption of water molecules [57]). However, it is more likely that strong coulombic attraction forces arise when the two different colloidal particles are mixed together in water.
To check the validity of this possibility, electrokinetic measurements were performed as detailed later.
Turning back to the dispersion characteristics, the largest equilibrium sediment volume appears at the highest GO loadings, which is partly due to the fact that the total solid content in these suspension is larger (the mass concentration of MNP is always 5 g/L in the whole series, and the GO excess mass was specified to this value). However, it is also possible that GO lamellae constitute a “house of cards”
arrangement opening up the nanostructure, and the loose
aggregates form a more voluminous sediment than those which are composed mostly of magnetite.
As a final note here, one would expect black or very dark brown color for all dispersions. However, when the magnetic particles become dominant in the samples, they turn to orange especially at higher dilutions. This is simply because of slow atmospheric oxidation of Fe3O4 to maghemite, but since this polymorph of iron oxide exhibits nearly the same magnetism and chemical properties [42], this trans- formation does not change crucially the characteristics of the GO/MNP composites.
Figure 8 shows the electrokinetic potentials and particle diameters (scattering intensity-based “Z-average”) as the function of the composition. It is important to note that, in contrast to the general GO/MNP representation, it is
(a)
(b)
1/30 1/20
1/10 1/5
1/2 1/1
2/1 10/1
(c)
Figure7: Photographs of settling nanocomposite dispersions immediately after homogenization (a), after one hour (b), and after one day (c). Numerical ratios indicated below (c) refer to different GO/MNP mass ratios.
expressed as the inverse mass ratio (MNP/GO) in order to be more conveniently comparable with the photographs in Figure 7. Thus, nanocomposite dispersion samples rich in the carbonaceous phase are on the left, while magnetite-rich samples are found on the right hand side of the photographs and the electrokinetic potencial-composition functions of Figure 8. The exfoliated graphite oxide particles are dis- persed to the submicrometer level (dave800 nm), and their ζ potential is −30 mV. The latter is the electric potential difference between the dispersion medium and the solvent
layer adhered to the suspended solid particle upon its elec- trophoretic migration [58]. This potential is usually lower than that measured at the particle surface, but its sign and magnitude are a good indication of the surface charge state and kinetic stability of the dispersed material. It is a common observation that electrostatically stabilized colloidal systems aggregate when the ζ potential falls within the range of
±20 mV. Graphene oxide particles showζpotential far lower than this value, indicating that their surfaces are highly charged in water, in agreement with previous observations [59]. On the other hand, +40 mV electrokinetic potential is
−50
−40
−30
−20
−10 0 10 20 30 40 50
0 1 10 100
Zeta potential (mV)
MNP/GO mass ratio (a)
0 500 1000 1500 2000 2500 3000
0 1 10 100
Avg. particle diameter (nm)
MNP/GO mass ratio (b)
Figure8: Electrokinetic potentials (a) and Z-average particle di- ameters (b) of the MNP/GO nanocomposite aqueous dispersions as a function of the MNP/GO mass ratio. Measurements refer to the pH range of 4.5–6.
−80
−60
−40
−20 0 20 40 60 80
−60 −40 −20 0 20 40 60
Magnetization (emu/g)
Induction of magnetic field (kOe) (a)
0 2 4 6 8
0 60 120 180 240 300
ΔT (°C)
Heating time (s) GO/MNP
1/50
MNP GO/MNP
1/5
H2O
(b)
Figure9: Magnetization curve of the MNPs (a) and heating curves (b) of nanocomposite dispersions of 5 g/L MNP content at two different GO/MNP ratios as compared to those of pure water and the bare MNP suspension of the same concentration.
measured for naked magnetite nanoparticle sols at pH values below∼5 [44]. For the binary composites, the charge increases slightly at the highest excesses of GO probably due to slight pH variation, but then it starts to increase gradually with the addition of magnetic nanoparticles. This suggests that MNPs are adsorbed to the surface of graphene oxide lamellae by electrostatic attraction upon which they progressively screen the surface charge and, concomitantly, decrease the magni- tude ofζpotential. The interaction of oppositely charged GO and magnetite nanoparticles results in aggregation. Huge secondary particles form in the lower MNP/GO mass ratio region (Figure 8(b)) probably due to the bridging of GO lamellae via MNPs. This finding is in good harmony with the visual observation of voluminous sediments formed mainly at 2/1 and 1/1 GO/MNP ratios after 1 day standstill (Figure 7 (c)), typical for house-of-cards arrangement of aggregates formed from anisometric, two-dimensional particles. How- ever, as the MNP/GO mass ratio further increases, the average hydrodynamic diameters of dispersed particles successively decrease reaching the submicron scale. This implies, in good agreement with the magnitude of the particle dimensions of the single composite particle shown in Figure 6, that the degree of aggregation decreases with MNP loading. Even- tually, primary GO sheets densely coated by MNPs dominate in the dispersed phase.
3.4. Performance of MNP/GO Composites in Magnetic Hyperthermia. The potential use of the magnetic nano- composites is demonstrated by their heating efficiency for a potential future use in hyperthermic cancer therapy [60].
Hyperthermia treatment relies on the temperature rise in a medium induced by the N´eel and Brownian relaxation of superparamagnetic nanoparticles [61, 62]. The magnetiza- tion curve of the MNPs (Figure 9(a)) clearly proves that the iron oxide nanoparticles used in this study are in the superparamagnetic state exhibiting a saturation magneti- zation of 67.6 emu/g. In Figure 9(b), the heating curves of GO/MNP composites at two different compositions are compared to the heating curve obtained for a magnetite suspension of the same solid content in the absence of carbonaceous lamellae. It was found that both nano- composites generated larger heat effects than the suspension containing the magnetic nanoparticles as indicated by the relatively large difference in the temperature measured between the suspensions after 5 minutes of AC magnetic field exposure (7.29°C for GO/MNP�1/5, 5.27°C for pristine magnetite). This enhancement in the heating efficiency is even more remarkable (>75% for the 1/50 composite) if one takes into account that pure water also produces heat under the same experimental conditions, caused by eddy currents [61]. We attribute this additional heat production to a re- sistance heating effect caused by Joule-losses of the graphene oxide particles. To our surprise, the hyperthermic effect was found to be larger at low GO loadings. Clearly, it is worth conducting further investigations, for example, on the composition dependence of the heating efficiency for these nanocomposite materials to tune their functionalities for specific applications.
4. Conclusions
The present study demonstrates that uniform GO/MNP nanocomposites can be easily formulated in a wide com- position range utilizing the strong electrostatic interaction between their particles. Graphene oxide particles were able to accommodate MNPs that represent masses up to 50 times larger than the lamellar carbonaceous host. This develop- ment is significant especially because strong binding can be maintained between naked MNPs and GO particles without chemical coupling, which would require preliminary efforts for functionalization of both MNPs and GO [15, 36, 63, 64].
Moreover, the present synthesis does not require harsh chemical treatments or elevated temperatures, thereby keeping the chemical structure of graphene oxide intact. This is a definite benefit compared to recent studies [65, 66]
reporting on the preparation of MNP/GO composites by hydrothermal methods in which the temperature was maintained at 190°C, where GO is expected to undergo significant thermal decomposition [67]. Finally, we showed that the method is versatile, enabling a large variation in the compositions affording highly different nanostructures ranging from “house of cards” arrangement of MNP- decorated exfoliated graphite oxide particles to GO nano- sheets matrixed into bulk amounts of magnetite.
Conflicts of Interest
The authors declare that they have no conflicts of interest regarding the publication of this paper.
Acknowledgments
This work was financially supported by the Hungarian National Research, Development and Innovation Office via the Grant FK-124851.
References
[1] S. Behrens, “Preparation of functional magnetic nano- composites and hybrid materials: recent progress and future directions,”Nanoscale, vol. 3, no. 3, pp. 877–892, 2011.
[2] N. D. Q. Chau, C. M´enard-Moyon, K. Kostarelos, and A. Bianco, “Multifunctional carbon nanomaterial hybrids for magnetic manipulation and targeting,” Biochemical and Biophysical Research Communications, vol. 468, no. 3, pp. 454–462, 2015.
[3] A. B. Bourlinos, M. A. Karakassides, A. Simopoulos, and D. Petridis, “Synthesis and characterization of magnetically modified clay composites,”Chemistry of Materials, vol. 12, no. 9, pp. 2640–2645, 2000.
[4] V. Tzitzios, G. Basina, A. Bakandritsos et al., “Immobili- zation of magnetic iron oxide nanoparticles on laponite discs—an easy way to biocompatible ferrofluids and ferro- gels,” Journal of Materials Chemistry, vol. 20, no. 26, pp. 5418–5428, 2010.
[5] T. Szab´o, A. Bakandritsos, V. Tzitzios et al., “Magnetic iron oxide/clay composites: effect of the layer silicate support on the microstructure and phase formation of magnetic
nanoparticles,”Nanotechnology, vol. 18, no. 28, Article ID 285602, 2007.
[6] T. Szab´o, E. Tomb´acz, E. Ill´es et al., “Enhanced acidity and pH-dependent surface charge characterization of successively oxidized graphite oxides,”Carbon, vol. 44, no. 3, pp. 537–545, 2006.
[7] V. Georgakilas, M. Otyepka, A. B. Bourlinos et al., “Func- tionalization of graphene: covalent and non-covalent ap- proaches, derivatives and applications,” Chemical Reviews, vol. 112, no. 11, pp. 6156–6214, 2012.
[8] A. Bakandritsos, M. Pykal, P. Bło´nski et al., “Cyanographene and graphene acid: emerging derivatives enabling high-yield and selective functionalization of graphene,” ACS Nano, vol. 11, no. 3, pp. 2982–2991, 2017.
[9] T. Szabó, A. Bakandritsos, V. Tzitzios et al., “Magnetically modified single and turbostratic stacked graphenes from tris (2, 2′-bipyridyl) iron (II) ion-exchanged graphite oxide,”
Journal of Physical Chemistry B, vol. 112, no. 46, pp. 14461–
14469, 2008.
[10] S. Bashkova and T. J. Bandosz, “Adsorption/reduction of NO2on graphite oxide/iron composites,”Industrial & En- gineering Chemistry Research, vol. 48, no. 24, pp. 10884–
10891, 2009.
[11] J. Shen, Y. Hu, M. Shi, N. Li, H. Ma, and M. Ye, “One step synthesis of graphene oxide–magnetic nanoparticle composite,”
Journal of Physical Chemistry C, vol. 114, no. 3, pp. 1498–1503, 2010.
[12] J. A. Arcibar-Orozco, D. A. Giannakoudakis, and T. J. Bandosz, “Effect of Ag containing (nano)particles on reactive adsorption of mustard gas surrogate on iron oxyhydroxide/graphite oxide composites under visible light irradiation,” Chemical Engineering Journal, vol. 303, pp. 123–136, 2016.
[13] H.-P. Cong, J.-J. He, Y. Lu, and S.-H. Yu, “Water-soluble magnetic-functionalized reduced graphene oxide sheets: in situ synthesis and magnetic resonance imaging applications,”
Small, vol. 6, no. 2, pp. 169–173, 2010.
[14] K. Zhou, Y. Zhu, X. Yang, and C. Li, “One-pot preparation of graphene/Fe3O4 composites by a solvothermal reaction,”
New Journal of Chemistry, vol. 34, no. 12, pp. 2950–2955, 2010.
[15] Y. Li, J. Chu, J. Qi, and X. Li, “An easy and novel approach for the decoration of graphene oxide by Fe3O4nanoparticles,”
Applied Surface Science, vol. 257, no. 14, pp. 6059–6062, 2011.
[16] L. Ai, C. Zhang, and Z. Chen, “Removal of methylene blue from aqueous solution by a solvothermal-synthesized graphene/magnetite composite,” Journal of Hazardous Ma- terials, vol. 192, no. 3, pp. 1515–1524, 2011.
[17] J. Shen, M. Shi, H. Ma, B. Yan, N. Li, and M. Ye, “Hydro- thermal synthesis of magnetic reduced graphene oxide sheets,” Materials Research Bulletin, vol. 46, no. 11, pp. 2077–2083, 2011.
[18] Y.-W. Liu, M.-X. Guan, L. Feng et al., “Facile and straight- forward synthesis of superparamagnetic reduced graphene oxide–Fe3O4hybrid composite by a solvothermal reaction,”
Nanotechnology, vol. 24, no. 2, Article ID 025604, 2013.
[19] Y. Wang, Q. He, H. Qu et al., “Magnetic graphene oxide nanocomposites: nanoparticles growth mechanism and property analysis,”Journal of Materials Chemistry C, vol. 2, no. 44, pp. 9478–9488, 2014.
[20] J. Qian, X. Yang, L. Jiang, C. Zhu, H. Mao, and K. Wang,
“Facile preparation of Fe3O4 nanospheres/reduced gra- phene oxide nanocomposites with high peroxidase-like activity for sensitive and selective colorimetric detection
of acetylcholine,” Sensors and Actuators B, vol. 201, pp. 160–166, 2014.
[21] K. Luo, Y. Mu, P. Wang, and X. Liu, “Effect of oxidation degree on the synthesis and adsorption property of magnetite/graphene nanocomposites,” Applied Surface Sci- ence, vol. 359, pp. 188–195, 2015.
[22] J. Zhou, H. Song, L. Ma, and X. Chen, “Magnetite/graphene nanosheet composites: interfacial interaction and its impact on the durable high-rate performance in lithium-ion bat- teries,”RSC Advances, vol. 1, no. 5, pp. 782–791, 2011.
[23] Y.-X. Ma, Y.-F. Li, G.-H. Zhao et al., “Preparation and characterization of graphite nanosheets decorated with Fe3O4 nanoparticles used in the immobilization of glucoamylase,”
Carbon, vol. 50, no. 8, pp. 2976–2986, 2012.
[24] G. He, W. Liu, X. Sun, Q. Chen, X. Wang, and H. Chen,
“Fe3O4@graphene oxide composite: a magnetically separable and efficient catalyst for the reduction of nitroarenes,”Ma- terials Research Bulletin, vol. 48, pp. 1885–1890, 2013.
[25] Y. Zhao, J. Li, S. Zhang, H. Chen, and D. Shao, “Efficient enrichment of uranium(VI) on amidoximated magnetite/graphene oxide composites,”RSC Advances, vol. 3, no. 41, pp. 18952–18959, 2013.
[26] M. Zong, Y. Huang, Y. Zhao et al., “Facile preparation, high microwave absorption and microwave absorbing mechanism of RGO–Fe3O4 composites,”RSC Advances, vol. 3, no. 45, pp. 23638–23648, 2013.
[27] X. Hu, Y. Liu, H. Wang et al., “Removal of Cu(II) ions from aqueous solution using sulfonated magnetic graphene oxide composite,”Separation and Purification Technology, vol. 108, pp. 189–195, 2013.
[28] V. Chandra, J. Park, Y. Chun, J. W. Lee, I.-C. Hwang, and K. S. Kim, “Water-dispersible magnetite-reduced graphene oxide composites for arsenic removal,” ACS Nano, vol. 4, no. 7, pp. 3979–3986, 2010.
[29] M. Liu, C. Chen, J. Hu, X. Wu, and X. Wang, “Synthesis of magnetite/graphene oxide composite and application for cobalt(II) Removal,”Journal of Physical Chemistry C, vol. 115, pp. 25234–25240, 2011.
[30] N. S. Chaudhari, A. P. Pandey, P. O. Patil, A. R. Tekade, S. B. Bari, and P. K. Deshmukh, “Graphene oxide based magnetic nanocomposites for efficient treatment of breast cancer,” Materials Science and Engineering C, vol. 37, pp. 278–285, 2014.
[31] X. Yang, Y. Wang, X. Huang et al., “Multi-functionalized graphene oxide based anticancer drug-carrier with dual- targeting function and pH-sensitivity,”Journal of Materials Chemistry, vol. 21, pp. 3448–3454, 2011.
[32] A. R. K. Sasikala, R. G. Thomas, A. R. Unnithan et al.,
“Multifunctional nanocarpets for cancer theranostics: re- motely controlled graphene nanoheaters for thermo- chemosensitisation and magnetic resonance imaging,” Sci- entific Reports, vol. 6, no. 1, Article ID 20543, 2016.
[33] J. Li, S. Zhang, C. Chen et al., “Removal of Cu(II) and fulvic acid by graphene oxide nanosheets decorated with Fe3O4 nanoparticles,” ACS Applied Materials & Interfaces, vol. 4, no. 9, pp. 4991–5000, 2012.
[34] X. Yang, X. Zhang, Y. Ma et al., “Superparamagnetic graphene oxide–Fe3O4 nanoparticles hybrid for controlled targeted drug carriers,” Journal of Materials Chemistry, vol. 19, pp. 2710–2714, 2009.
[35] F. He, J. Fan, D. Ma, L. Zhang, C. Leung, and H. L. Chan, “The attachment of Fe3O4 nanoparticles to graphene oxide by covalent bonding,” Carbon, vol. 48, no. 11, pp. 3139–3144, 2010.
[36] Y. Zhang, B. Chen, L. Zhang et al., “Controlled assembly of Fe3O4magnetic nanoparticles on graphene oxide,”Nanoscale, vol. 3, pp. 1446–1450, 2011.
[37] X. Fan, W. Peng, Y. Li et al., “Deoxygenation of exfoliated graphite oxide under alkaline conditions: a green route to graphene preparation,”Advanced Materials, vol. 20, no. 23, pp. 4490–4493, 2008.
[38] T. Szabo, Z. Peter, E. Illes, L. Janov´ak, and A. Talyzin, “Sta- bility and dye inclusion of graphene oxide/polyelectrolyte layer-by-layer self-assembled films in saline, acidic and basic aqueous solutions,” Carbon, vol. 111, pp. 350–357, 2017.
[39] T. Yoon, J. Kim, J. Kim, J. Kim, and J. Lee, “Electrostatic self- assembly of Fe3O4nanoparticles on graphene oxides for high capacity lithium-ion battery anodes,”Energies, vol. 6, no. 9, pp. 4830–4840, 2013.
[40] T. Jiao, Y. Liu, Y. Wu et al., “Facile and scalable preparation of graphene oxide-based magnetic hybrids for fast and highly efficient removal of organic dyes,”Scientific Reports, vol. 5, no. 1, Article ID 12451, 2015.
[41] M. Namvari and H. Namazi, “Clicking graphene oxide and Fe3O4 nanoparticles together: an efficient adsorbent to remove dyes from aqueous solutions,”International Journal of Environmental Science and Technology, vol. 11, no. 6, pp. 1527–1536, 2014.
[42] A. R. M. Cornell and U. Schwertmann, The Iron Oxides, p. 573, Weinheim, Germany, VCH, 1996.
[43] E. Ill´es, E. Tomb´acz, M. Szekeres, I. Y. T´oth, ´A. Szab´o, and B. Iv´an, “Novel carboxylated PEG-coating on magnetite nanoparticles designed for biomedical applications,”Journal of Magnetism and Magnetic Materials, vol. 380, pp. 132–139, 2015.
[44] E. Tomb´acz, E. Ill´es, A. Majzik, A. Hajd´u, N. Rideg, and M. Szekeres, “Ageing in the inorganic nanoworld: example of magnetite nanoparticles in aqueous medium,” Croatica Chemica Acta, vol. 80, pp. 503–515, 2007.
[45] D. Nesztor, K. Bali, I. Y. T´oth, M. Szekeres, and E. Tomb´acz,
“Controlled clustering of carboxylated SPIONs through polyethylenimine,” Journal of Magnetism and Magnetic Materials, vol. 380, pp. 144–149, 2015.
[46] I. Y. T´oth, D. Nesztor, L. Nov´ak et al., “Clustering of car- boxylated magnetite nanoparticles through polyethylenimine:
covalent versus electrostatic approach,”Journal of Mag- netism and Magnetic Materials, vol. 427, pp. 280–288, 2017.
[47] F. Tuinstra and J. L. Koenig, “Raman Spectrum of Graphite,”
Journal of Chemical Physics, vol. 53, no. 3, pp. 1126–1130, 1970.
[48] A. Gupta, G. Chen, P. Joshi, S. Tadigadapa, and P. C. Eklund,
“Raman scattering from high-frequency phonons in sup- ported n-graphene layer films,” Nano Letters, vol. 6, pp. 2667–2673, 2006.
[49] R. P. Vidano, D. B. Fischbach, L. J. Willis, and T. M. Loehr,
“Observation of Raman band shifting with excitation wave- length for carbons and graphites,”Solid State Communica- tions, vol. 39, no. 2, pp. 341–344, 1981.
[50] A. C. Ferrari, “Raman spectroscopy of graphene and graphite:
disorder, electron–phonon coupling, doping and non- adiabatic effects,”Solid State Communications, vol. 143, no. 1-2, pp. 47–57, 2007.
[51] R. Saito, M. Hofmann, G. Dresselhaus, A. Jorio, and M. S. Dresselhaus, “Raman spectroscopy of graphene and carbon nanotubes,” Advances in Physics, vol. 30, no. 3, pp. 413–550, 2011.
[52] S. Reich and C. Thomsen, “Raman spectroscopy of graphite,”
Philosophical Transactions of the Royal Society A, vol. 362, no. 1824, pp. 2271–2288, 2004.
[53] T. Szab´o, O. Berkesi, P. Forg´o et al., “Evolution of surface functional groups in a series of progressively oxidized graphite oxides,”Chemistry of Materials, vol. 18, pp. 2740–
2749, 2006.
[54] A.B. Bourlinos, A. Bakandritsos, V. Georgakilas, V. Tzitzios, and D. Petridis, “Facile synthesis of capped γ-Fe2O3 and Fe3O4nanoparticles,” Journal of Materials Science, vol. 41, no. 16, pp. 5250–5256, 2006.
[55] T. Szab´o, V. Hornok, R. A. Schoonheydt, and I. D´ek´any,
“Hybrid Langmuir–Blodgett monolayers of graphite oxide nanosheets,”Carbon, vol. 48, no. 5, pp. 1676–1680, 2010.
[56] Y.-H. Lien and T.-M. Wu, “Preparation and characterization of thermosensitive polymers grafted onto silica-coated iron oxide nanoparticles,”Journal of Colloid and Interface Science, vol. 326, no. 2, pp. 517–521, 2008.
[57] E. Tombacz, A. Hajdu, E. Illes, K. László, G. Garberoglio, and P. Jedlovszky, “Water in contact with magnetite nanoparticles, as seen from experiments and computer simulations,”
Langmuir, vol. 25, pp. 13007–13014, 2009.
[58] R. J. Hunter, R. H. Ottewill, and R. L. Rowell,Zeta Potential in Colloid Science, Principle and Application, p. 219, London, UK, Academic Press, 1981.
[59] R. L. D. Whitby, V. M. Gun’ko, A. Korobeinyk et al., “Driving forces of conformational changes in single-layer graphene oxide,”ACS Nano, vol. 6, no. 5, pp. 3967–3973, 2012.
[60] L.-Z. Bai, D.-L. Zhao, Y. Xu et al., “Inductive heating property of graphene oxide–Fe3O4 nanoparticles hybrid in an AC magnetic field for localized hyperthermia,”Materials Letters, vol. 68, pp. 399–401, 2012.
[61] D. Ortega and Q. A. Pankhurst, “Magnetic hyperthermia,”
Nanoscience, Royal Society of Chemistry, vol. 1, pp. 60–88, Royal Society of Chemistry, London, UK, 2013.
[62] M. Molcan, H. Gojzewski, A. Skumiel et al., “Energy losses in mechanically modified bacterial magnetosomes,”Journal of Physics D: Applied Physics, vol. 49, Article ID 365002, 2016.
[63] G. Xie, P. Xi, H. Liu et al., “A facile chemical method to produce superparamagnetic graphene oxide-Fe3O4 hybrid composite and its application in the removal of dyes from aqueous solution,” Journal of Materials Chemistry, vol. 22, no. 3, pp. 1033–1039, 2012.
[64] N. A. Travlou, G. Z. Kyzas, N. K. Lazaridis, and E. A. Deliyanni, “Functionalization of graphite oxide with magnetic chitosan for the preparation of a nanocomposite dye adsorbent,” Langmuir, vol. 29, no. 5, pp. 1657–1668, 2013.
[65] Y. Dong, H. Zhang, Z. U. Rahman et al., “Graphene oxide–Fe3O4magnetic nanocomposites with peroxidase-like activity for colorimetric detection of glucose,” Nanoscale, vol. 4, no. 13, pp. 3969–3976, 2012.
[66] Y. Fu, J. Wang, Q. Liu, and H. Zeng, “Water-dispersible magnetic nanoparticle–graphene oxide composites for sele- nium removal,”Carbon, vol. 77, pp. 710–721, 2014.
[67] L. Zhou, H. Deng, J. Wan, J. Shi, and T. Su, “A solvothermal method to produce RGO-Fe3O4 hybrid composite for fast chromium removal from aqueous solution,”Applied Surface Science, vol. 283, pp. 1024–1031, 2013.
Submit your manuscripts at https://www.hindawi.com
Scientifica
Hindawi Publishing Corporation
http://www.hindawi.com Volume 2014
Hindawi Publishing Corporation
http://www.hindawi.com Volume 2014
Ceramics
Journal ofNanoparticles
Journal ofHindawi Publishing Corporation
http://www.hindawi.com Volume 2014
Hindawi Publishing Corporation
http://www.hindawi.com Volume 2014
International Journal of
Biomaterials
Hindawi Publishing Corporation
http://www.hindawi.com Volume 2014
Nanoscience
Journal ofTextiles
Hindawi Publishing Corporation
http://www.hindawi.com Volume 2014
Journal of
Crystallography
Journal ofHindawi Publishing Corporation
http://www.hindawi.com Volume 2014
The Scientific World Journal
Hindawi Publishing Corporation
http://www.hindawi.com Volume 2014
Hindawi Publishing Corporation
http://www.hindawi.com Volume 2014
Coatings
Journal ofAdvances in
Materials Science and Engineering
Hindawi Publishing Corporation
http://www.hindawi.com Volume 2014
Hindawi Publishing Corporation
http://www.hindawi.com Volume 2014
Metallurgy
Journal ofHindawi Publishing Corporation
http://www.hindawi.com Volume 2014
BioMed
Research International
Materials
Journal ofHindawi Publishing Corporation
http://www.hindawi.com Volume 2014
1 D QR PD WH ULD OV
+LQGDZL3XEOLVKLQJ&RUSRUDWLRQ
KWWSZZZKLQGDZLFRP 9ROXPH
-RXUQDORI