IV. 4. FLUOROMETRIC ANALYSIS OF COENZYME BINDING AND THIOL INTERACTIONS ON GLYCERALDEHYDE-3-
PHOSPHATE AND LACTIC DEHYDROGENASES * Sidney F. Velick
Department of Biological Chemistry, Washington University, School of Medicine, St. Louis, Missouri
I. Introduction 267
II. Principle of the Fluorometric Analysis 268
III. Enzyme-Coenzyme Interactions 269
IV. Dissociation Constants of Enzyme-Coenzyme Complexes 271
V. Displacement of Coenzymes with PCMB 273
I. Introduction
During the past several months I have been going over old ground with some new methods. The old ground is the pyridine nucleotide com- plexes of glyceraldehyde-3-phosphate dehydrogenase ( G A D H ) , and the new methods are fluorescence spectroscopy and fluorescence polarization.
We had established previously that G A D H combined strongly with three mole equivalents of diphosphopyridine nucleotide ( D P N ) , and that the bound coenzyme was released when the complex was titrated with the thiol group reagent, p-chloromercuribenzoate (PCMB) (IS). However, the methods of ultracentrifugation and absorption spectrophotometry were too slow and insensitive to cope with the very small dissociation constants and the instability of the enzyme complexes with the reduced nucleotide ( D P N H ) . These difficulties have largely been overcome by the fluorometric approach and some new properties of the complexes have been found. Parallel experiments on G A D H and on lactic dehydrogenase (LDH) will be described. The two enzymes present some extreme con- trasts. I shall summarize the pertinent vital statistics of the two enzymes and define the terms of the fluorometric analysis before proceeding with the results of the experiments.
G A D H and L D H both catalyze reversible transhydrogenations be-
* This work was supported in part by a grant from the National Heart Institute, National Institutes of Health.
267
268 SIDNEY F. VELICK
tween diphosphopyridine nucleotide and substrate but each enzyme acti- vates a different hydrogen atom on the number 4 pyridine carbon of D P N H (4). G A D H catalyzes the oxidative phosphorylation of an alde- hyde while L D H catalyzes the oxidation of an a carbinol:
Ο
RCHO + GADH + DPN+ . — > RC—GADH + D P N H + H+ (la) RC—GADH + HPO4-- τ—> R C — O P 0Ο Ο 3- - + GADH (lb)
Τ "Π TT Ο
RCH(OH)COO- + D P N+ RCCOO" + D P N H + H+ ( 2 ) The two steps in the G A D H reaction, in which the enzyme is a stoichio-
metric participant, may be separated by the omission of orthophosphate ion ( 5 ) . A thiol group on the enzyme is believed to be the intermediate acyl group acceptor but much work remains to be done on this point. All of the non-methionine sulfur of G A D H appears to be in the thiol form
(6, 7) and at least four of the thiol groups are extremely reactive. The thiol groups of L D H react more sluggishly. From its relatively high sta- bility it is likely that L D H also contains some disulfide linkages. The molecular weights of both enzymes fall in the range 130,000 to 140,000 and the apparent axial ratios are close to 2.
II. Principle of the Fluorometric Analysis
The physical basis of the fluorometric analysis may be summarized briefly as follows. The energy of an absorbed photon may be dissipated either thermally or in a chemical reaction and under certain conditions the excited electron may fall to the ground state with the emission of fluorescent light. The fractional number of absorbed quanta emitted as fluorescence depends upon the relative efficiencies of the competing proc- esses of light emission and radiationless energy loss. Since the relative rates of the radiationless mechanisms are influenced by the environment, the fluorescence intensity is a sensitive indicator of chemical interactions.
As a first approximation the fluorescence emission spectrum is the mirror image of the absorption spectrum displaced toward longer wave lengths.
Complex formation may or may not shift the emission spectrum and may either enhance or diminish the fluorescence intensity.
The decay of fluorescence follows a first order rate law and the recipro- cal of the rate constant is designated by the symbol τ, the average lifetime of the excited state. When large molecules in an ordinary solvent or small molecules in a viscous solvent are excited by plane polarized light there is little rotatory Brownian motion during the interval, τ, and the fluo- rescence is polarized with the electric vector parallel to that of the activa-
ting beam. On the other hand an excited small molecule in a solvent of low viscosity assumes a nearly random orientation during the interval, τ, and the fluorescence is largely depolarized. The polarization, P, is defined as:
where F is the fluorescence intensity and the subscripts || and ± refer to the polarizing prisms in the activation and emission beams with their electric vectors respectively parallel and crossed. The relation of Ρ to the molecular parameters is given in an expression derived by Perrin (8)
( ? - a ) - ( s - ï ) (
, +S )
where P0 is the polarization that would be obtained in a rigid solvent and pn is the harmonic mean of the relaxation times of the fluorescent molecule under the physical conditions of the experiment. Weber has applied this equation to fluorescent dyes chemically conjugated with proteins (9).
III. Enzyme-Coenzyme Interactions
With the above principles in mind we may now consider the enzyme- coenzyme interactions. In these systems D P N does not fluoresce, but the proteins and D P N H have characteristic emission bands. D P N H fluores- cence is excited by absorption in both its 260 and 340 τημ absorption bands and the emission maximum is near 465 τημ. Activation and emission bands of free and bound D P N H are illustrated in Fig. 1. In the G A D H complex the effect of the protein is to diminish the intensity of the nucleotide fluorescence with no significant wave length shift. In the L D H complex, as first shown by Schwert (10), the emission is greatly enhanced and shifted toward shorter wave lengths. The fluorescence shift with L D H is correlated with a shift of the absorption maximum from 340 to 335 τημ and this is reflected by a small shift in the activation band.
The proteins fluoresce by virtue of their content of aromatic amino acids, chiefly tryptophan. Activation occurs in the region of the 280 τημ absorption band and the emission maximum is near 350 τημ. The fluo- rescence of both enzymes is partially quenched by complex formation with either D P N or D P N H . In Fig. 2 are the emission bands of L D H and L D H - ( D P N H )3 activated at 290 τημ. It is to be noted that the quenching at 350 τημ is accompanied by an increased emission at longer wave lengths. The difference spectrum establishes the enhancement beyond 400 τημ as arising from the bound D P N H . Similar curves are obtained with G A D H and the G A D H ( D P N H ) 3 complex. When D P N is the ligand the quenching of the
270 S I D N E Y F . V E L I C K
70
-
60 / C \
/
c' \
5 0
/ \
of DPNH
4 0
/ 1 ' \ ·
orescence
30 1
20
A \ A' \
10 • / B \ \
1 1
\ l ^ ^ ^ ^ ^
• 1 1 1
320 360 Excitation
400 4 4 0 480 520 Emission (m/i)
FIG. 1. Excitation and emission bands of free and bound D P N H . The fluorescence corresponding to the excitation bands was measured at the wave lengths of the emission peaks. The emission bands were activated at the wave lengths of the excita- tion peaks. Curves A and A' are free D P N H ; curves Β and B', the GADH ( D P N H ) s complex; curves C and C , the L D H ( D P N H )8 complex. The D P N H concentration was 5 Χ ΙΟ"6 M for all curves. The fluorescence intensity in these curves and in the curves of subsequent figures is in arbitrary units for each figure.
350 m/A fluorescence is of the same approximate magnitude but there is no enhancement beyond 400 ταμ. Of great interest in these spectra is the acti- vation of bound D P N H at 290 m/*. Bound nucleotide shows a strong acti- vation peak at this wave length where D P N H absorption is minimal and protein absorption is very high. The effect is stronger with L D H than with
Emission (m/Λ)
Fia. 2. Emission spectra of LDH, curve B, and of the LDH(DPNH)* complex, curve A, excited at 290 ταμ, pH 7.1, 25°. The LDH concentration is the same for both curves. Curve C represents the difference spectrum.
G A D H and arises by energy transfer from the excited tryptophan residues of the protein to the bound nucleotide. Free D P N H is activated very weakly at the same wave length.
IV. Dissociation Constants of Enzyme-Coenzyme Complexes
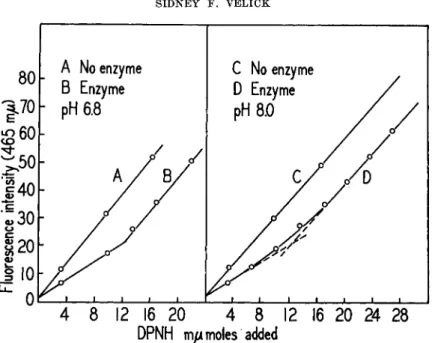
Changes both in nucleotide and protein fluorescence during complex formation may be followed quantitatively in titrations at micromolar concentration levels. The resulting curves yield information both on stoichiometry and dissociation constants. When G A D H is titrated with D P N H and activated at 340 m/Λ, the initial slope, nucleotide fluorescence versus [ D P N H ] , is depressed (Fig. 3 ) . When L D H is titrated in the same manner the initial slope is enhanced. In both cases the equivalence points are well defined. Beyond the equivalence points the slopes approach that given by free D P N H . Similar titrations may be followed by observ- ing the decrease in protein fluorescence at 350 m/x. If the protein concen- tration is decreased to 1 0 ~7A f the titration curves are hyperbolic and dissociation constants may be computed. G A D H has three coenzyme bind- ing sites per molecule and L D H has 3 to 4. The intrinsic dissociation con-
272 SIDNEY F. VELICK
80
4 8 12 16 20
/
4 8 12 16 20 24 28 DPNH ηψ moles added
FIG. 3 . D P N H fluorescence excited at 3 4 0 τημ as a function of D P N H concentra- tion. In curves A and C the D P N H is in pure buffer solution. In curves Β and D the buffer contains 0.565 mg. of GADH. The equivalent combining weight is 45,100 gm. of GADH per mole of D P N H .
stants of the D P N H complexes are 2 . 5 X 1 0 ~7 and 3 . 5 Χ Ι Ο- 7 M respec- tively in 0 . 1 M tris(hydroxymethyl)methylamine acetate, pH 7 . 1 .
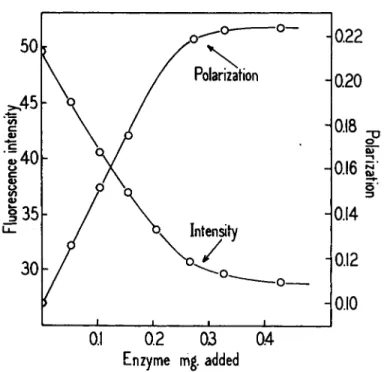
Changes in fluorescence intensity which result from the formation or dissociation of a complex are accompanied by changes in fluorescence polarization. The polarization effects are large if the complex is between a small fluorescent molecule and a protein. Fig. 4 illustrates the changes which occur when a sample of D P N H is titrated with GADH. The in- tensity drops to a minimum as an increasing mole fraction of the D P N H is bound, and at the same time the relaxation time and polarization of the nucleotide increases. If there were any doubt that the intensity change was the result of complex formation, this would be dispelled by the in- creased polarization. When the G A D H ( D P N H ) 3 complex is titrated with D P N the above polarization and intensity changes are reversed. In this case the bound D P N H is released by the D P N which is bound competi- tively at the same sites on the protein. From such curves one may calculate the ratio of dissociation constants, -KDPN/KDPNH. The results are in agree- ment with the ratio computed from K's determined independently. The
ratio is 0 . 2 5 for G A D H and of the order of 1 0 0 0 for L D H .
I 1 ι . ι I 0.1 0.2 03 0.4
Enzyme mg. added
FIG. 4 . Titration of 6 m^moles of D P N H with G A D H , showing the changes in the polarization of the D P N H fluorescence activated at 3 4 0 τημ, and the changes in intensity of the depolarized component of the emission. The absolute values of the polarization are somewhat low because of convergence in the activation beam.
V. Displacement of Coenzymes with PCMB
We are now ready to consider the role of thiol groups in the nucleotide protein complexes. When the G A D H ( D P N H ) 3 complex is titrated with P C M B (Fig. 5), each increment of reagent produces an increase in fluo- rescence intensity and a decrease in the polarization of the nucleotide fluorescence. The curves are nearly linear and the end point occurs at about four mole equivalents of reagent per mole of protein. At this point the fluorescence intensity and polarization of the nucleotide correspond to those of free D P N H . Additional equivalents of P C M B may be bound to the protein beyond the point of complete nucleotide release but this method provides no indicator for them. In a similar fashion the release of bound D P N by P C M B may be followed by observing changes in the protein fluorescence at 350 ηΐμ (Fig. 6). Release of the bound D P N re- stores the protein fluorescence to full intensity but as would be expected in this case there is no appreciable effect on the polarization. Prompt addi- tion of an excess of cysteine removes the P C M B from the protein com-
274 SIDNEY F. VELICK
3 5 1 3 5 7
DPN (M)/GADH(M) PCMB(M)/GADH(DPN)3 CM)
FIG. 6. Formation of the GADH(DPN)» complex and its dissociation by PCMB.
Fluorescence, activated at 3 0 0 ιçì, was measured at 3 5 0 τημ. On the left is shown the decrease in protein fluorescence during formation of the D P N complex. On the right is the increase in protein fluorescence that occurs when the complex is titrated with PCMB.
FIG. 5 . Changes in the intensity and polarization of the D P N H fluorescence during the titration of the G A D H ( D P N H )a complex with PCMB. The total enzyme titrated was 0.26 mg.
petitively and allows the free D P N to re-enter the complex. If there is too long a time delay before addition of cysteine the protein mercaptide spontaneously denatures with irreversible loss of binding capacity and enzyme activity.
Other enzymes besides G A D H are denatured by P C M B and this process is of some significance. The explanation can only be that the mercuribenzoate group hanging on the thiol of a cysteine side chain per- turbs the native globular configuration of the protein. The resulting strain makes the protein more susceptible to thermal denaturation. Such an effect would be expected to be most pronounced in proteins like G A D H which have a relatively high molecular weight and few if any stabilizing disulfide cross-linkages. Some insight into this effect is gained by examin-
PCMB m/xmoles
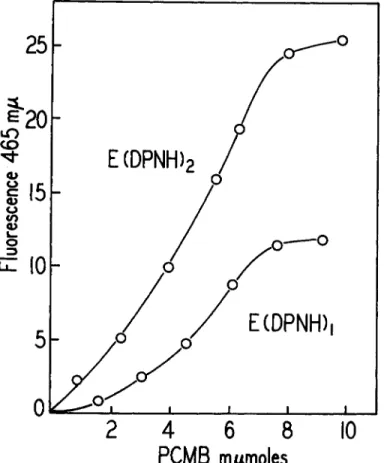
FIG. 7. Titration of the G A D H ( D P N H ) ι and G A D H ( D P N H )a complexes with PCMB.
276 SIDNEY Γ. VELICK
ing the PCMB titration curves of the G A D H ( D P N H ) ι and G A D H - ( D P N H )2 complexes (Fig. 7). The same amount of PCMB, 4 equivalents per mole of protein, is necessary to dissociate the complexes containing 1, 2, and 3 mole equivalents of D P N H . &F0, the standard free energy of dissociation of the complex is of the order of +10,000 cal. per mole of D P N H . If coenzyme release were the result of direct competition between the nucleotide and mercury for the thiol groups then we would expect the first increments of reagent to go exclusively to the unoccupied binding sites with no release of D P N H . However, this does not happen. Release begins immediately as we would expect if mercaptide formation at any site af- fected the structural alignment of the whole protein. Energically this is quite possible because the free energy change in mercaptide formation is very much greater than that in coenzyme binding.
Throughout this talk I have pointed out instances of the contrasting behavior of G A D H and L D H but have said little about the thiol groups of L D H . As shown by Neilands (11) and by Takenaka and Schwert (12) L D H combines with P C M B and becomes inhibited. I have presented no fluorometric data on this reaction because a fiftyfold molar excess of PCMB neither prevents the binding of D P N H nor promotes the release of D P N H that is already bound. Since L D H is a relatively stable protein compared to GADH, I would suggest that mercaptide formation of L D H does not immediately produce a protein conformation change sufficiently extensive to affect the binding of coenzyme.
The experiments that I have described are taken from a more ex- tensive study now in process of publication (13). The thiol interaction with the bound coenzyme is one aspect of a more general problem, albeit an important one, and as you can see it has been touched only lightly.
Fluorescence is a tool for quantitative analysis and is also a tool for study- ing certain aspects of structure and molecular interactions. In the present case the fluorescence of the protein and of the bound D P N H was used as an indicator for mercaptide formation on the thiol groups of the protein.
The complexed nucleotide could be used as an indicator because the nu- cleotide fluorescence was changed in the enzyme complex and because mercaptide formation on the protein reversed this change by causing the complex to dissociate. It was also necessary to take advantage of the complex when protein fluorescence was used as the indicator. The change in protein fluorescence which gave us a measure of mercaptide formation was again only the reversal of an effect on the protein produced by the bound nucleotide. The fluorescence of the free protein is unaffected by mercaptide formation. However, if the thiol reagent were itself fluorescent, substitution on the thiol of the protein could be followed by observing the
increase in fluorescence polarization of the reagent. We are making efforts to devise a reagent of this type.
REFERENCES
1. S. F. Velick, J. E . Hayes, Jr., and J. Harting, / . Biol. Chem. 203, 5 2 7 ( 1 9 5 3 ) . 2. S. F. Velick, / . Biol Chem. 203, 5 6 3 ( 1 9 5 3 ) .
3. S. F. Velick, in "The Mechanism of Enzyme Action" (W. D . McElroy and B.
Glass, eds.), p. 4 9 1 . Johns Hopkins Press, Baltimore, Maryland, 1954.
4. F. A. Loewus, H. R. Levy, and B. Vennesland, J. Biol Chem. 223, 5 8 9 ( 1 9 5 6 ) . 6. S. F. Velick and J. E . Hayes, Jr., J. Biol. Chem. 203, 5 4 5 ( 1 9 5 3 ) .
6. 0 . J. Koeppe, P. D . Boyer, and N . P. Stulberg, / . Biol. Chem. 219, 5 6 9 ( 1 9 5 6 ) . 7. R. E . Benesch, H. A. Lardy, and R. Benesch, J. Biol. Chem. 216, 2 6 3 ( 1 9 5 5 ) . 8. F. Perrin, J. phys. radium 7, 3 9 0 ( 1 9 2 6 ) .
9. G. Weber, Biochem. J. 51,155 ( 1 9 5 2 ) .
10. G. W. Schwert, J. Am. Chem. Soc. 79, 6 7 5 ( 1 9 5 7 ) . 11. J. B. Neilands, J. Biol Chem. 208, 2 2 5 ( 1 9 5 4 ) .
12. Y. Takenaka and G. W. Schwert, / . Biol Chem. 223, 157 ( 1 9 5 6 ) . 13. S. F. Velick, / . Biol. Chem. 233, 1455 ( 1 9 5 8 ) .
Discussion
WALLENFELS: Could you say something about the quantum yield for the absorp- tion at 2 6 0 and 2 8 0 τημ because 2 6 0 τημ is the maximum of absorption of the coenzyme and there should be a good quantum yield there also.
VELICK: G. Weber (Nature 180, 1409, 1958) has found that the quantum yield of D P N H fluorescence is the same at 260, 2 8 0 , and 3 4 0 ταμ. This is a point of considerable interest because it is the reduced nicotinamide group that fluoresces and at 2 6 0 τημ more than 9 0 % of the light is absorbed by the adenine. An efficient energy transfer must therefore occur between the adenine and the reduced pyridine rings. Since the 260 τημ activation is very weak with the mixture of the two constituent mononucleo- tides and in certain organic solvents Weber believes that the energy transfer is facili- tated by an inner complex between the two nitrogen ring systems and that the free coenzyme in water therefore occurs in a folded or hairpin configuration.
The persistence or disappearance of the 2 6 0 τημ activation band of D P N H in the enzyme complexes might, in terms of the above analysis, provide information as to whether the coenzyme were bound in a folded or extended configuration. The present evidence suggests that the coenzyme has a folded configuration in the GADH complex but not in the LDH complex. However the resolution from the intense 2 8 0 τημ "transfer" bands of the proteins is not yet good enough to give us a satisfactory answer.
EDSALL: I had one question of Dr. Velick. Is the duration of the activated state the same for the free coenzyme as for the coenzyme complexes, or is that known?
VELICK: The average lifetime, r, of the excited state is related to the quantum efficiency of the fluorescence. In a given system, if there is no radiationless energy loss, both r and the quantum efficiency are maximal for that system. Any quenching process will decrease the quantum efficiency and also decrease r by providing radia- tionless pathways of deactivation. In the GADH complex the D P N H fluorescence in-
278 SIDNEY F. VELICK
tensity at constant intensity of 340 τημ activating light is less than for free D P N H but the absorption coefficient at 340 τημ is also decreased. Both τ and the quantum efficiency are practically unchanged. In the LDH complex there is a three fold in- crease in fluorescence intensity and no increase in the absorption coefficient. The lifetime of the excited state is presumably increased in this case.
GERGELY: I would like to ask Dr. Velick if he thinks that these experiments, in which resonance energy transfer is suggested, have any possible application to another type of transfer, namely the movement of free electrons in proteins that we have tried to work out theoretically? Is there any way from the fluorescence yield to discriminate between these two mechanisms?
VELICK: Excitation energy from a photoexcited molecule may be transferred to other molecules to activate oxidation and reduction reactions. This is now a well known process in several photosynthetic systems and would lead to a decreased fluorescence yield of the donor molecule. However I see no direct application to the problem of electron movement in a protein continuum. As far as I know there is still a reasonable doubt that such a process actually occurs.
SWAN: Would this fluorescence method enable one to follow the titration of functional groups in proteins using some suitably reactive fluorescent substance as titrant? I take it that you would be able to distinguish between a fluorescent molecule free in solution and one bound to the protein.
VELICK: Fluorescence polarization may be utilized to follow a reaction whenever a small fluorescent molecule combines with another molecule that is large enough to make a significant change in the rotational diffusion constant. If there is a change in the fluorescence spectrum the reaction can of course be followed by intensity measurements irrespective of the size of the reactants and without the use of polariza- tion methods. If the only effect in a titration is a partial quenching of fluorescence there may be some doubt as to whether the quenching arises from complex formation or by collisional mechanisms. Polarization changes, when they are measurable, may distinguish between these alternatives.