Accepted Manuscript
Title: Solvatochromic isocyanonaphthalene dyes as ligands for Silver(I) complexes, their applicability in silver(I) detection and background reduction in biolabelling
Authors: Mikl´os Nagy, D´avid R´acz, Zsolt L´aszl´o Nagy, P´eter P´al Feh´er, J´ozsef Kalm´ar, Istv´an F´abi´an, Alexandra Kiss, Mikl´os Zsuga, S´andor K´eki
PII: S0925-4005(17)31726-4
DOI: http://dx.doi.org/10.1016/j.snb.2017.09.061
Reference: SNB 23152
To appear in: Sensors and Actuators B Received date: 12-5-2017
Revised date: 6-9-2017 Accepted date: 9-9-2017
Please cite this article as: Mikl´os Nagy, D´avid R´acz, Zsolt L´aszl´o Nagy, P´eter P´al Feh´er, J´ozsef Kalm´ar, Istv´an F´abi´an, Alexandra Kiss, Mikl´os Zsuga, S´andor K´eki, Solvatochromic isocyanonaphthalene dyes as ligands for Silver(I) complexes, their applicability in silver(I) detection and background reduction in biolabelling, Sensors and Actuators B: Chemicalhttp://dx.doi.org/10.1016/j.snb.2017.09.061
This is a PDF file of an unedited manuscript that has been accepted for publication.
As a service to our customers we are providing this early version of the manuscript.
The manuscript will undergo copyediting, typesetting, and review of the resulting proof before it is published in itsfinal form. Please note that during the production process errors may be discovered which could affect the content, and all legal disclaimers that apply to the journal pertain.
1
Solvatochromic isocyanonaphthalene dyes as ligands for Silver(I) complexes, their applicability in silver(I) detection and background reduction in
biolabelling
Miklós Nagy1, Dávid Rácz1, Zsolt László Nagy1, Péter Pál Fehér2, József Kalmár3, István Fábián3, Alexandra Kiss4, Miklós Zsuga1, Sándor Kéki1*
1Department of Applied Chemistry, 2Department of Physical Chemistry, 3Department of
Inorganic and Analytical Chemistry, 4Department of Biotechnology and Microbiology, University of Debrecen, H-4032 Debrecen, Hungary
* Corresponding author: keki.sandor@science.unideb.hu, fax: +36 52 518662; H-4032 Debrecen, HUNGARY
Graphical Abstract
.
The exclusive presence of highly stable, fluorescent 1:1 AgL complex was detected and supported by DFT calculations upon the complexation of solvatochromic, reactive and nonreactive N-substituted ICANs with Ag(I) ions. 30-59 nm batochromic shift of λem,max was observed, accompanied by a ligand dependent switch-off or switch-on effect, which was used for quantification of Ag(I) ions and contrast enhancement during the staining of HaCat cells.
Miklós Nagy, Dávid Rácz, Zsolt László Nagy, Péter Pál Fehér, József Kalmár, István Fábián, Alexandra Kiss, Miklós Zsuga, Sándor Kéki*
Solvatochromic isocyanonaphthalene dyes as ligands for Silver(I) complexes, their applicability in silver(I) detection and background reduction in biolabelling
Highlights
Silver-isocyanide complexes with solvatochromic fluorescent dyes as ligand were prepared.
The complexation of the dyes can be used for the quantification of silver(I) ions.
The PL switch-off in the case of MICAN yields a significant contrast enhancement in biolabeling.
Cell staining applications of the complex(es) is shown on fixated HaCat cells.
2 Abstract
The complexation behavior of reactive and nonreactive N-substituted 1-amino-5-
isocyanonaphthalene (ICAN) derivatives was studied in the presence of Ag(I) ions by UV-vis, steady-state and time resolved fluorescence measurements. The effect of ligand, solvent and counterion is covered. The equilibrium constants were found to be KAgL~106 M-1 in dioxane and water. Complex formation results a significant, solvent dependent (30-59 nm) batochromic shift of the emission maximum.This shift is accompanied by a switch-off effect in the case of the unreactive ligands, while in the case of the acrylated derivative (ACAIN) significant intensity enhancement was detected. Based on spectroscopic results only 1:1 AgL complex could be detected in solution at low concentrations cAgL<10-4 M, while at higher concentrations pure 1:2 AgL2 formed which was characterized by ESI-MS, IR and NMR methods. The structure and optical behavior of the complexes are discussed based on high-level quantum chemical
calculations. It is shown that the complexation of ACAIN can be used for the selective detection and quantification of silver(I) ions from aqueous media. In addition, the fluorescene switch-off in the case of MICAN yields a significant contrast enhancement in biolabeling applications as is shown on fixated HaCat cells.
Keywords: Fluorescence, silver(I), solvatochromic effect, complex, isonitrile
Introduction
Isonitriles are excellent ligands in organometallic chemistry because of their polar and easily variable π-accepting character. Although the first isonitrile complex Ag(NCR)(CN) was prepared as early as 1869 by Gautierin, metal-isonitrile complexes have always been overshaded by other alternatives. The chemistry of isonitriles has undiscovered resources, the reactive C-N bond can serve as a versatile base for many organic reactions, such as the Ugi reaction,[1] heterocyclic ring formation and other insertion reactions which are particularly useful in drug synthesis,[2] as well as different multicomponent reactions.[3] Isonitriles easily form complexes with transition metal ions and are stronger σ-donors compared to their isoelectronic CO counterparts.[2] While gold(I)- isonitrile complexes are well studied, having a number of applications (e.g. deposition of gold
3
films, preparation of liquid crystalline phases),[4-5] the related isonitrile complexes of silver(I) are much less studied, in spite of interesting properties such as liquid crystalline behaviour,[6-7] or luminescence both in liquid and solid phase.[8]
The structure of the silver(I)-isonitrile complexes is an interesting issue. They are more flexible than the rigid rod-like gold(I) complexes with strictly two-coordinate metal centers, which serve a good basis for the construction of supramolecular frameworks and mesogenic phases. The silver(I) centers can become three- or four-coordinate by interactions with the ligands or the counterions.[9] Most of them has a composition of 1:2, 1:3 or 1:4 Ag:Ligand ratio with ligands, such as p-tolyl isonitrile,[10-11] 2,4-di-t-butyl-6-methylphenyl, 2,4,6-tri-t-butylphenyl, 2,6- dimethylphenyl and t-butyl isocyanides,[12] methyl and cyclohexy1 isocyanide.[13] Only a few examples can be found in the literature for the 1:1 complexes, and most of them are dimers. In most of the above mentioned cases the Ag:Ligand ratio of the complex depends on the ratio of the reagents used for the synthesis, and it can also show dependence on the counterion.
Therefore, 1:1 Ag:Ligand complexes can also form from p-tolyl and cyclohexyl isonitrile using chloride counterion instead of perchlorate or nitrate.[14] Usually these complexes are more stable than the silver(I)-containing parent compounds, however the solubility of the 1:1 complexes are significantly worse than the 1:2 ones. In most cases the latter are practically insoluble.
A unique advantage of these complexes in addition to their high thermal stability is that if a luminescent ligand is used, the organic-inorganic coordination between the metal ion and the ligand can affect the luminescent properties of the ligand, therefore allows a novel versatile route to construct various types of light-emitting materials, which can be used as LEDs.[15] In the literature dicyanide[16] and diisocyanide[17] based polymeric materials can be found above all of such type of luminescent materials. The spectral changes caused by the complexation can be explained by metal-ligand charge transfer (MLCT) in most cases.[18] In addition, the application of luminescent ligands (probes) opens the way for the detection of ions and biomacromolecules and for cellular and in vivo imaging or even for the detection of viruses such as influenza. [19-21]
However, there are several examples for silver(I)-isonitrile complexes, even with luminescent ligands in the literature, to our best knowledge, no one has ever used solvatochromic isonitrile ligands in combination with silver(I). For ligands in this study we used our recently developed 1- amino-5-isocyanonaphthalene (ICAN) derivatives (Scheme 1) to investigate the optical changes
4
accompanied their complexation with Ag(I). The ligands were selected in a way that mono and dialkylated derivatives with reactive and unreactive substituents are also included.
Scheme 1. The structure and name of the ligands used in this study. The full names are given in the experimental section.
Since these ligands are solvatochromic dyes, their luminescent properties will no longer be dependent upon solvent polarity only, but metal-ligand interactions will also have to be taken into consideration. These new interactions are supposed to favorably alter the fluorescent properties and practical applicability of the dyes. Based on our ongoing in vitro biological experiments a few of our ICAN derivatives can be used as vital cell stains. Since these dyes are well tolarated by living cells, their silver(I) complexes may also be suitable for enhanced biolabeling.
Results and Discussion
The formation of Ag-isonitrile complexes were investigated by UV-vis and steady-state
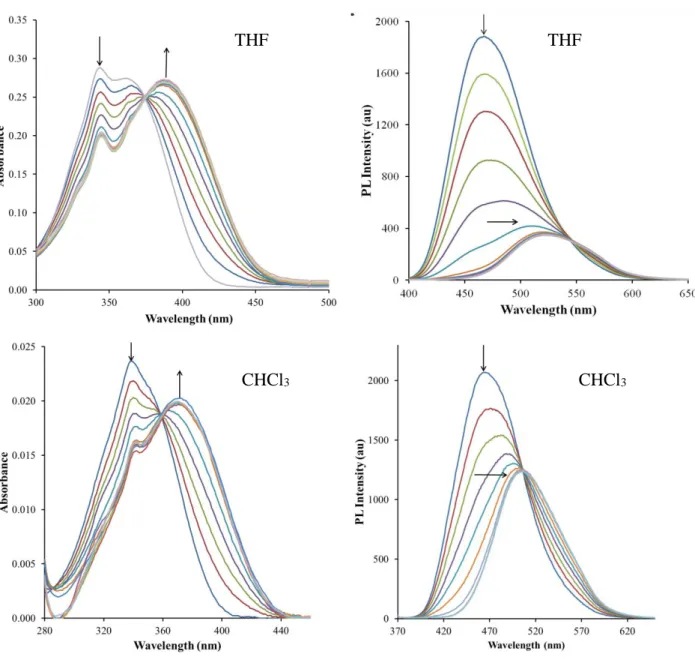
fluorescence methods in different solvents by adding portions of AgTFA solutions (in the range of 0.1-2 molar eq.) to ICAN (c~10-5 M – 10-6 M) dissolved in the proper solvent. In chloroform, dichloromethane, dioxane, methanol, tetrahydrofuran and acetonitrile a batochromic shift in both the absorption and emission spectra is clearly visible as is presented for THF and CHCl3 in Figure 1. The spectra recorded in other solvents are presented in the Supporting Information, (SI) in FigureS2-S18. In addition to the redshifts, isosbestic points characteristic for complex
formation or in a few cases even isoemissive points could be identified (Fig.1, FigS4, S6,S8,S11,S13-S18). The fluorescence intensity decreased in all cases after the addition of
5
AgTFA. Besides trifluoroacetate, BF4- and ClO4- were used as counterions and were investigated in THF because it is a good solvent for silver salts. The experiments were also carried out using the reactive ligand, ACAIN. The spectral changes accompanying complex formation in different solvents in the presence of various anions are summarized in Table 1.
6
Figure 1. The absorption and emission spectra of ICAN recorded in THF and CHCl3. The highest intensity peak indicated with the downward arrow always belongs to pure ICAN (cICAN = 5×10⁻⁵ M). Each additional line represents the addition of 34.4 nanomole of AgTFA.
THF
CHCl3
THF
CHCl3
7
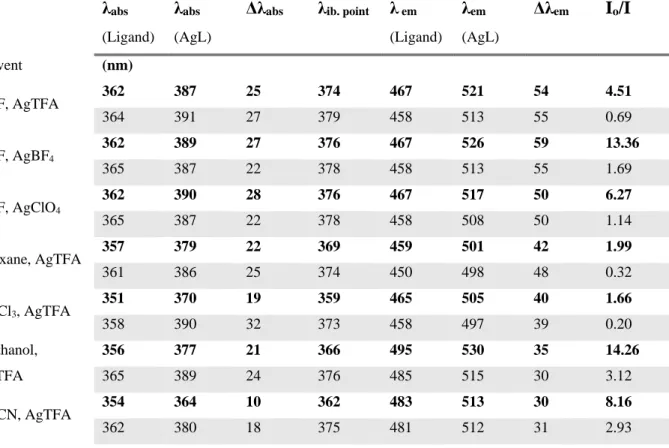
Table 1. The absorption and emission maximum (λabs), and (λem) along with their differences (Δλabs) and (Δλem) for the ligands: ICAN (bold) and ACAIN and their Ag-complexes (AgL), the location of the isosbestic point (λib. point) in the absorption spectrum and the fluorescence intensity ratio of the ligand (Io) and the complex (I).
λabs
(Ligand)
λabs
(AgL)
Δλabs λib. point λ em
(Ligand)
λem
(AgL)
Δλem Io/I
Solvent (nm)
THF, AgTFA 362 387 25 374 467 521 54 4.51
364 391 27 379 458 513 55 0.69
THF, AgBF4
362 389 27 376 467 526 59 13.36
365 387 22 378 458 513 55 1.69
THF, AgClO4
362 390 28 376 467 517 50 6.27
365 387 22 378 458 508 50 1.14
Dioxane, AgTFA 357 379 22 369 459 501 42 1.99
361 386 25 374 450 498 48 0.32
CHCl3, AgTFA 351 370 19 359 465 505 40 1.66
358 390 32 373 458 497 39 0.20
Methanol, AgTFA
356 377 21 366 495 530 35 14.26
365 389 24 376 485 515 30 3.12
MeCN, AgTFA 354 364 10 362 483 513 30 8.16
362 380 18 375 481 512 31 2.93
Based on the data of Table 1. it can be concluded that except for the intensity change the optical properties of ICAN and ACAIN are very similar. The position of the isosbestic points in the UV- vis titration experiments (Fig. 1, S11) are favorably close to 365 nm, which is the excitation wavelength used for fluorescence measurements. Ag-complex formation is accompanied in all cases by a batochromic shift which is roughly twice as high in the emission than in absorption spectra. For example in the case of THF and AgTFA (Fig. 1) Δλmax,abs=25 nm and Δλmax,em=54 nm were observed. Surprisingly the shifts show only slight solvent dependence and fall between 19-25 nm for absorption and 35-54 nm for emission.
For ICAN the addition of AgTFA was followed by considerable fluorescence quenching, while in the case of ACAIN in THF, dioxane and CHCl3 the complex proved to be more fluorescent than
8
the pure ligand. The quenching effect was found to be counter-ion dependent, BF4- yielded the largest Io/I values (13.36). We found earlier that fluoride ions are effective quenchers for ICAN and it may be valid for tetrafluoroborate ions as well. The effect of ClO4- ions are almost identical to that of trifluoroacetate ions. The switch-on effect in the case of Ag-ACAIN complex can be accounted for the termination of an inner quenching pathway present in the free ligand by the saturation of the acryl group[22] or by altering the energy levels of the molecule through interaction of Ag(I) with the isocyano group.
For further measurements dioxane as solvent and AgTFA as the silver salt were chosen.
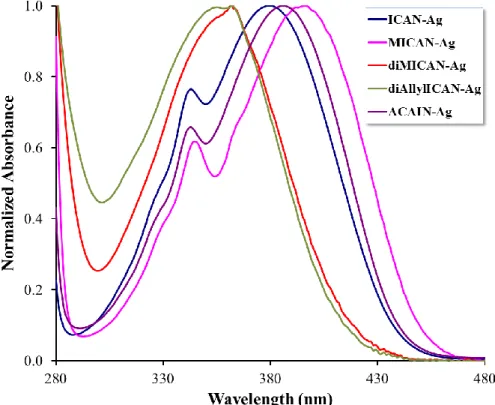
Additional complexation experiments were carried out with MICAN, diMICAN and diAllyl- ICAN as well, in order to investigate the effect of the N-substituent on the optical properties of the complexes. The results are summarized in Table 2. and are shown in Figure 2. The
absorbance spectra of the starting ligands are presented in the SI as FigS19.
Figure 2. Zoomed parts of the normalized absorbance spectra of the Ag complexes of all the ligands under investigation. (Dioxane, T=20 ºC, CAgL=5x10⁻⁵ M)
9
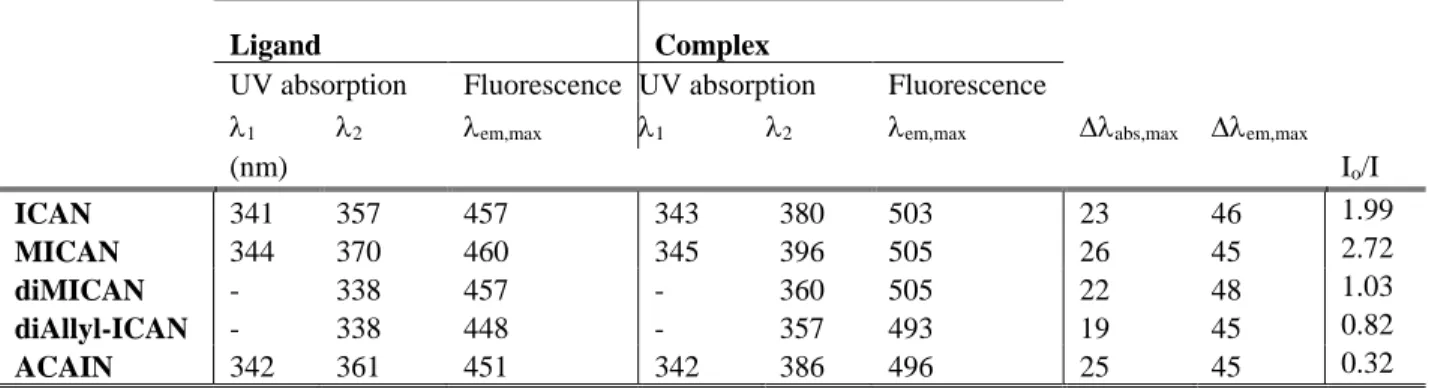
Table 2. The spectral properties of ICAN derivatives as free and complexated ligands in dioxane.
Ligand Complex
UV absorption Fluorescence UV absorption Fluorescence
1 2 em,max 1 2 em,max abs,max em,max
(nm) Io/I
ICAN 341 357 457 343 380 503 23 46 1.99
MICAN 344 370 460 345 396 505 26 45 2.72
diMICAN - 338 457 - 360 505 22 48 1.03
diAllyl-ICAN - 338 448 - 357 493 19 45 0.82
ACAIN 342 361 451 342 386 496 25 45 0.32
As seen in Figure 2 the region above 300 nm differ significantly in the case of the complexes and the free ligands. In the case of the dialkylated derivatives (diMICAN, diAllylICAN) only one absorption band near 340 nm is found in the free form which then shifts to ca. 360 nm upon complexation, while the specrum of both the non- and monoalkylated ligands contain two absorption bands. The one with the higher energy is also located near 340 nm and remains unchanged by the addition of Ag(I), while the broad lower energy band shifts from ca. 360-370 nm to ca. 380-400 nm. This double band structure is also reported by K.A. Zachariasse et al.[23]
and A. Fakhari M. et al.[24] for aminocyanonaphthalenes. Based on Ref 23 the high energy narrow band may belong to a locally excited (LE) state of the naphthalene ring which is only slightly effected by the Ag+ ion, whereas the broad low energy band belongs to the charge trasfer (CT) between the amino and the isocyano group which is more affected by the coordination of Ag+ to the NC moiety. As it is evident from the data of Table 2 the batochromic shifts of the emission peaks of the complexes are approximately the same, ca. 45-48 nm for all ligands. This is also valid for the shifts in the absorption bands (Δλabs) which is in the range of 19-26 nm. The position of the λabs,max follows the trend of dialkylated<nonalkylated <monoalkylated order. The highest value of λabs, max = 396 nm is in the case of MICAN (FigS16).
The stoichiometry and the stability of the Ag(I) complexes.
Careful investigation of both the UV-vis and the steady-state fluorescence titration experiments revealed a steep linear increase of absorbance and PL intensity (above the isosbestic or
isoemissive point) with increasing silver(I) concentration that turn into saturation close to 1:1
10
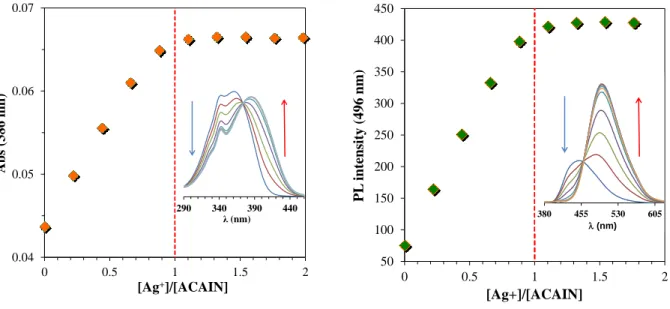
Ligand/Ag(I) ratio as seen in Figure 3 for ACAIN. The experiments gave similar results for the other 4 ligands as well.
0.04 0.05 0.06 0.07
0 0.5 1 1.5 2
Abs (386 nm)
[Ag+]/[ACAIN]
290 340 390 440
λ (nm)
50 100 150 200 250 300 350 400 450
0 0.5 1 1.5 2
PL intensity (496 nm)
[Ag+]/[ACAIN]
380 455 530 605
(nm)
Figure 3. The change of absorbance and fluorescence as a function of metal (Ag+) and Ligand (ACAIN) concentration ratio. The insets show the raw spectral changes during the titration experiments. (T=20 ◦C, [ACAIN]=1.04x10⁻⁵ M)
The equilibrium constants of complexation for all ligands were determined by spectrofluorometry at low concentrations of Ag(I) and ligand, because the changes in absorption were too low for reliable quantification. Our efforts for using NMR spectroscopy failed due to the precipitation of a yellow solid when the concentration of the complex was increased above ca. 10–4 M.
The shape of the graph in Figure 3. indicates the formation of a 1:1 complex, thus the equilibrium constant of complexation (K) is assigned to the following process:
𝐴𝑔 + 𝐿 ⇌ 𝐴𝑔𝐿 (1)
The K values were determined using non-linear regression analysis based on equation S6. and S7.
and are summarized in Table 3 for all ligands.
11
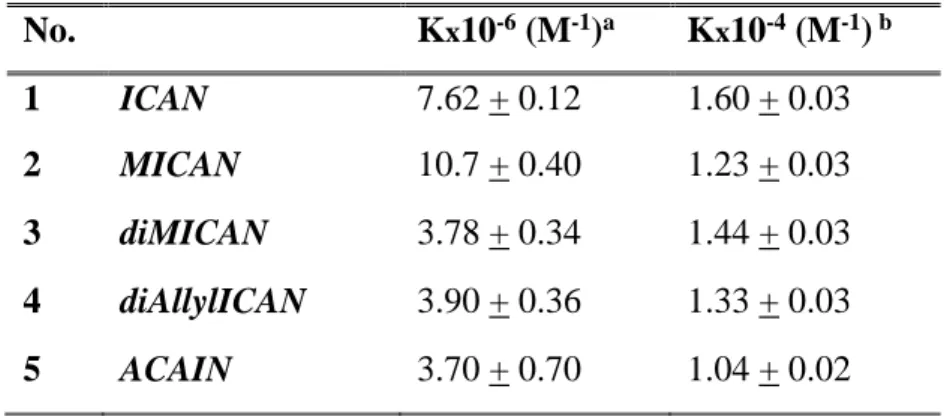
Table 3. The Equilibrium constants of complex formation for ligands 1-5.
No. Kx10-6 (M-1)a Kx10-4 (M-1) b 1 ICAN 7.62 + 0.12 1.60 + 0.03 2 MICAN 10.7 + 0.40 1.23 + 0.03 3 diMICAN 3.78 + 0.34 1.44 + 0.03 4 diAllylICAN 3.90 + 0.36 1.33 + 0.03 5 ACAIN 3.70 + 0.70 1.04 + 0.02
adioxane, fluorometry
bacetonitrile, UV
The K values determined in dioxane are practically in the same order of magnitude between K
=106 M–1 and 107 M–1. This indicates the high binding affinity of silver(I) towards the ligands in the form of 1:1 complexes. The largest K value was obtained for MICAN which is in line with the optical changes listed in Table 2. The change of the K values follows that of the redshifts measured in the absorption spectra: KMICAN>KICAN>KdiMICAN~KdiAllylICAN~KACAIN, while their redshifts in absorption are Δλabs,max=26 nm, 23 nm, 22 nm 19 nm, 25 nm respectively. The exceptional behavior of ACAIN (low K value in contrast to high Δλabs,max) can be explained by the steric effect of its bulky acrylpropionyl substituent, which destabilizes the complex, and lowers the K value. It is further supported by the fact that the two ligands (ACAIN and diAllylICAN) with the largest substituents have almost the same equilibrium constant values 3.7×10⁶ M–1 versus 3.9×10⁶ M–1.
Interestingly, in MeCN the spectral changes following the addition of the same amounts of Ag(I) were considerably smaller than in other solvents. Acetonitrile contains a cyano group which is also capable of forming a complex with the dissolved Ag(I) ions. Since the amount of solvent is several magnitudes higher than that of the ligands all the dissolved Ag(I) is complexed by the solvent and the complex formation with the ICAN derivatives can be regarded as a ligand exchange reaction (CAg,0=CAgMeCN). The modified version of Eq. S7. was used to calculate the K values in MeCN. Here the fluorescence (IF) was exchanged to absorbance (Abs). The K values determined in MeCN are two orders of magnitude lower than those obtained in dioxane.
12
However, these values (K ≈ 104 M–1) still represent high Ag(I) binding affinities and similarly to the case of dioxane the complete formation of 1:1 AgL complexes for every ligand.
Characterization of the Ag(I) complexes
The preparation of the 1:1 AgL complex with ICAN in a solid form failed every time. No matter which solvent and stoichiometric ratio (1:1 or 1:2 Ag/L) were used, always the same pale yellow powdery precipitate formed. After weighing, the calculated composition gave the formula of [AgL2]TFA which was further supported by elemental analysis. The calculated composition for the 1:2 complex is [Ag(C11H8N2)2]CF3COO C(51.73%), H(2.89%) N(10.05%). The measured values are C(50.12±0.11%), H(2.84±0.04%) N(9.70±0.01%). (For the 1:1 complex
[Ag(C11H8N2)]CF3COO these calculated values are C(40.13%), H(2.07%) and N(7.20%),
respectively.) It should be noted that the C content of the complex exhibits a nearly 1.5 % deficit, but such large deviations are not uncommon in the elemental analysis of metal complexes with perfluorated ligands.[25] The 1:2 complex had very limited solubility in the applied solvents except for DMSO where even 10 mg/ml solutions can be prepared. The 1H NMR spectrum of the precipitate (FigureS1_bottom) revealed only one set of signals characteristic for a single particle.
In comparison to the spectrum of ICAN (FigureS1_top) the 1:2 complex does not contain the signals of the free ligand, therefore the simultaneous presence of 1:1 and 1:2 complexes can be excluded in DMSO after redissolving the 1:2 complex. It is also evident from the 1H NMR spectrum that all the proton signals suffer an upfield shift. The closer the ring protons are to the isocyano moiety the larger the shift, indicating the interaction of silver(I) with the NC group. The ESI-MS measurements of both the methanolic solution of the yellow powder and that of a freshly prepared complex at 1:1 Ag/L ratio gave only the m/z ratio corresponding to the 1:2 complex (m/z measured 443.042 for [Ag(C11H8N2)]+, calculated 443.042, FigS20/b). This is in line with our previous observations that during the evaporation of the carrier solvent under ESI conditions the 1:2 complex forms and appears exclusively in the mass spectrum. The 1:1 complex could only be identified when the molar ratio of Ag(I) was increased to 50-100× to that of the ICAN ligand (FigS20/a). The IR spectrum (FigS21) of the bis-isocyanide silver complex shows, as expected, the ν(C≡N) absorption for the isocyanide group at higher wavenumbers (ca. 52 cm−1) than for the corresponding free isocyanide ICAN. In addition, its ν(N−H) bands broaden
considerably. The presence of the TFA ion can be detected based on the newly appearing bands
13
at ca. 3178 cm-1 ν(C−F) stretching, at ca. 1679 cm−1 intense ν(C=O) and at ca. 1199 cm-1 strong ν(C-O) in the fingerprint region.
Time resolved fluorescence measurements
After proving the exclusive presence of 1:1 AgL complexes in the 10-7- 10-5 M concentration range, their time-resolved fluorescence behavior in dioxane was studied using laser light flash photometry. For comparison, the same experiments were carried out using the free ligands. The spectra recorded at different delay times yield information on the decay rate of fluorescence (kF):
kF = krad + knr (2)
which is the sum of the radiative decay rate (krad) resulting in the fluorescence of the sample and the nonradiative decay rate (knr), which represents all processes where the molecule returns from excited state to ground state without light emission. Similarly, the radiative decay rate (krad) can also be determined from time-resolved measurements as the product of the quantum yield ΦF and the decay rate of fluorescence (kF) according to eq. 3:
F F
rad k
k
(3)
The F values of the ligands and complexes were determined relative to quinine sulfate and are listed in Table S1. The radiative decay rate (krad,SB) can also be calculated from steady-state fluorescence spectra using the Strickler-Berg equation (eq. 4.)
)d ( d ) F(
)d F(
n 10 88 . 2 ) s (
k -3
2 9 1
- SB
rad, (4)
where n is the refractive index of the solvent, () is the molar absorption coefficient and F() is the steady-state fluorescence intensity at wavenumber .
The measured (kF) and calculated (kF,SB) decay rates, as well as, the measured and calculated radiative decay rates based on eq. 3 and 4. are summarized in Table 4.
14
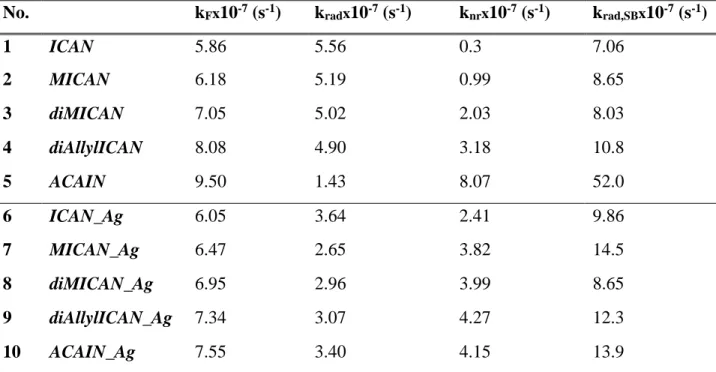
Table 4. The measured decay (kF) and radiative decay rate (krad) along with the calculated decay rate (krad,SB) and the nonradiative decay rate (knr) for the free and complexated ligands in dioxane.
krad,SB and krad were calculated using the Strickler-Berg equation (eq. 4.) and eq. 3. respectively.
No. kFx10-7 (s-1) kradx10-7 (s-1) knrx10-7 (s-1) krad,SBx10-7 (s-1)
1 ICAN 5.86 5.56 0.3 7.06
2 MICAN 6.18 5.19 0.99 8.65
3 diMICAN 7.05 5.02 2.03 8.03
4 diAllylICAN 8.08 4.90 3.18 10.8
5 ACAIN 9.50 1.43 8.07 52.0
6 ICAN_Ag 6.05 3.64 2.41 9.86
7 MICAN_Ag 6.47 2.65 3.82 14.5
8 diMICAN_Ag 6.95 2.96 3.99 8.65
9 diAllylICAN_Ag 7.34 3.07 4.27 12.3
10 ACAIN_Ag 7.55 3.40 4.15 13.9
* The F values listed in TableS1 were used for the calculation of krad from kF. The errors of kF
were less than 5%.
As seen from the data of Table 4. the measured decay rates (kF) are almost the same in the case of the free ligands and those of the 1:1 complexes. The measured (krad) and calculated (krad,SB) radiative decay rates are in a good agreement except for ACAIN, which contains a long flexible N-substituent and can change its conformation during excitation. The low krad value of ACAIN is due to an inner quenching process[22] which is terminated in the AgL complex of ACAIN upon the coordination of silver to the isocyanide moiety. While the kF values of ligands 1-4 are almost the same, the contribution of the nonradiative part is increased in the case of complexes 6-9, which is in good agreement with the PL intensity decrease (switch-off) observed in the steady- state PL spectra of 6-9. In contrast, knr decreases upon the complexation of ACAIN, where a switch-on effect was found in the steady-state PL spectra.
15
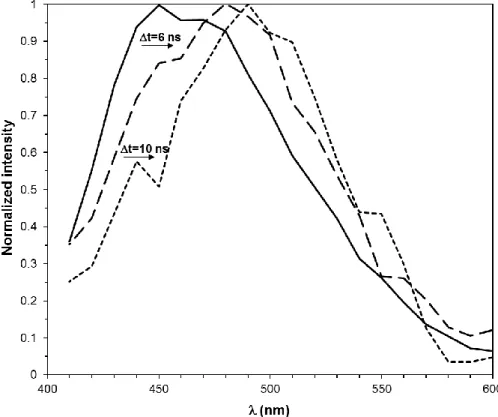
Since the fluorescence lifetime, τ=1/krad, is larger for Ag-ACAIN than for its free form, the increase of delay time (Δt) will result in a bathochromic shift of the emission maximum as is presented in Figure 4. and Figure S22.
Figure 4. The time resolved fluorescence spectra of Ag-ACAIN 1:1 complex recorded at different delay times. ([Ag(ACAIN)]TFA=1.04x10⁻⁶ M, in dioxane, T=20 ºC)
Fluorescence detection of Ag+ ions from aqueous medium
The coordination of ACAIN to Ag(I) ions in dioxane is accompanied by a significant batochromic shift of the emission maximum and a simultaneous increase in fluorescence- intensity. Based on these phenomena an analytical method was developed for the detection and quantitation of Ag(I) by adding the aqueous analyte to the dioxane solution of ACAIN. The water content in the mixture must be limited to 10 % (v/v) since larger amounts of water quench the fluorescence of ICAN derivatives and consequently shift their emission maximum
batochromically as is presented in FigS23. Upon the addition of 10 % water the emission maximum shifted from λem,max=456 nm in dioxane to λem,max=472 nm changing the bright blue
16
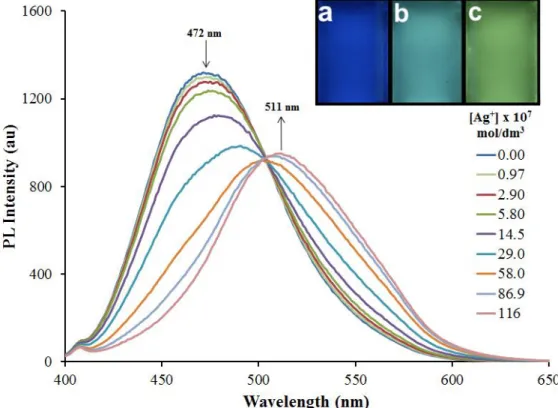
color of the original solution to turquoise (Figure 5 inset). The addition of aqueous AgNO3
solutions followed in the concentration range of [Ag+] = 2.9x10⁻⁷-1.16x10⁻⁵ M (0.02-2.5 eq.), while the water content was kept at a constant 10% in each sample. The spectral changes are summarized in Figure 5. Upon the addition of small amounts of Ag+ (0.02-0.1 eq.) only a slight decrease in PL-intensity could be observed. By increasing the amount of Ag+ the maximum of the emission peak starts to shift to higher wavelengths and above 2 eq. of silver(I) no further shift or intensity change can be detected the emission maximum stabilizes at approx. 511 nm. In short, the sensing of Ag(I) ions is carried out through simultaneous PL switch-off and batochromic shift processes.
Figure 5. Spectral changes upon the addition of different amounts of AgNO3 to the solution of ACAIN in dioxane:water 9:1 (v/v). The inset picture shows ACAIN in pure dioxane (a), in dioxane:water 9:1 (v/v) (b) and after the addition of 2 molar equivalent Ag+ to solution b (c). ([ACAIN]=4.69x10⁻⁶ M, T=20 ◦C, λex=365 nm)
For the analytical applicability of the method it is important to investigate the fluorescence behavior of ACAIN in the presence of various metal ions, namely Ag(I), Al(III), Bi(III), Ca(II), Ce(III), Co(II), Cu(II), Dy(III), Eu(III), Fe(III), Ga(II), Gd(III), Lu(III), Mn(II), Nd(III), Ni(II),
17
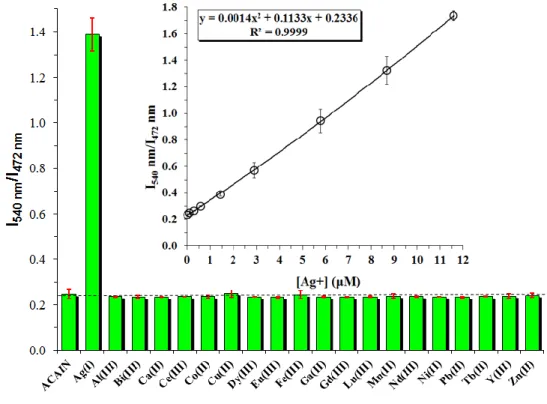
Pb(II), Tb(II), Y(III) and Zn(II) (cmetal=1.16x10⁻⁵ M, ca. 2.5 eq.) After the addition of various metal ions (other than Ag+) negligible effects on fluorescence were observed as is presented in Figure 6.
Figure 6. Selectivity of ligand ACAIN towards various metal ions. The red vertical bars
represent the errors of 3 consecutive measurements. ([ACAIN]=4.69x10⁻⁶ M, [Metal]= 1.16x10⁻⁵ M, ~2.5 eq., T=20 ◦C, λex=365 nm)
The sensitivity of ACAIN towards Ag(I) was investigated by the dual-wavelength ratiometric fluorescence method. The two wavelegths were chosen on the basis of the greatest PL-intensity changes on the ligand and on the complex side, respectively. This way, the PL-intensity of the complex at 540 nm (I540) was divided by that of the pure ligand at 472 nm (I472) and the values were plotted versus the Ag(I) concentration as is shown in Figure 6. inset. The ligand displays a highly selective second order response (R2=0.9999), and an applicability in a relatively large concentration range, i.e. more than one magnitude for Ag(I). The detection limit is ca. 0.5 μM.
This detection limit is slightly larger than the 0.13 μM reported for a Rhodamine B derivative[26]
but significantly lower than the 6 μM for a 2,6-diphenylpyridine-based chemosensor.[27] The
18
detection range of 0.5-10 μM is similar to those reported for BODIPY-porphyrin dyad[28], 2,6- diphenylpyridine-based chemosensor[26] and Rhodamine B Selenolactone[29]. The selectivity of our method is similar to those reported in Refs.[26, 30]
The titrations were repeated using 20%, 30% and 50% water content. As can be seen in FigS24- 26 the isoemissive point completely disappears from the fluorescence titration spectra, the distance between the emission maximum of ACAIN and that of its Ag(I)-complex decreases, the spectral overlap increases significantly lowering the sensitivity of the method.
For practical applicability the stability of the method also plays an important role and needs to be investigated. Solutions corresponding to the starting, end and an intermediate point of the
calibration curve were selected and PL spectra were recorded at every 30 minutes up to 6 hours.
The PL intensity changes were calculated at 472 and 540 nm respectively and are summarized in Table 5. The raw spectra are presented as FigS27-29.
Table 5. Fluorescence intensity changes at 472 nm (bold) and 540 nm (italic) versus time at different Ag+ concentrations. The intensity at t=0 h was taken as 100% in dioxane:water 9:1 (v/v), T=20 ºC, [ACAIN]=4.69x10⁻⁶ M.
Intensity Change (%)
[Ag+] 1 h 2 h 3 h 4 h 5 h 6 h
0.00 μM -0.2 4.6
-2.1 2.1
-2.6 2.3
-2.9 2.7
-3.0 2.9
-3.4 2.0
2.90 μM 1.6 -2.5
1.4 -3.5
2.8 -5.0
2.8 -5.5
3.3 -6.6
2.9 -7.4
11.6 μM 1.0 -2.1
0.2 -3.1
0.9 -3.6
1.0 -3.6
1.1 -4.3
0.9 -4.6
As can be seen from the data of Table 5 and FigS23-25 the fluorescence intensity remained stable for over 6 h the intensity changes did not exceed 10% at both wavelengts, therefore this method exhibits good stability. In addition it should be noted that the reagent ACAIN can be stored as a stock solution in dioxane in the dark for more than 6 months as we found during our previous studies.[22]
19 DFT calculations
To further elucidate the experimental findings DFT calculations were also carried out. Since ACAIN and ICAN display similar chemical characteristics we only dealt with the simpler
molecule, ICAN. First the 1:1 complex was considered and it was found that in the lowest energy isomer the silver(I) ion coordinates to the isocyano moiety giving a linear orientation. Three typical coordination modes (to the amino nitrogen, to a double bond of the naphthalene ring and the isocyano binding) are shown together with relative energies in Fig. S30 During excited state optimizations the N-C-Ag started to bend reaching geometries and spectra that seemed unrealistic from a chemical point of view. To keep the linearity we optimized the first excited state using an explicit counterion, thus TFA was modeled as acetate ion. In order to check whether this
approach is appropriate we changed the M06 functional to CAM-B3LYP and saw that this method did not require the modeling of the counterion. Even though both the absorption and emission spectra are strongly blue shifted which is a common characteristic of CAM-B3LYP the calculated wavelength shifts (Fig. S31) match the M06 calculated and experimental values. The obtained spectra for THF solvent is shown in Figure 7, for dichloromethane and dioxane see Fig.
S36.
0 2000 4000 6000 8000 10000 12000 14000
200 250 300 350 400 450 500 550 600 650 700
Intensity
λ (nm)
ICAN_THF_GS AgICAN_THF_GS ICAN_THF_S1 AgICAN_THF_S1
Figure 7. Calculated absorption and emission spectra of ICAN and the Ag complex (including an acetate anion at the silver atom) in THF. The maxima of the main low energy bands are located at 365, 395, 453 and 496 nm. (experimental values: 362, 387, 467, 521 nm)
20
These spectra, however, do not give an answer to the observed fluorescence decrease upon the addition of AgTFA. The molecular orbital treatment shown in Fig. 8 would suggest a dark S1 state as the overlap between the HOMO and LUMO is minimal. This is, however, not reflected in either the calculated absorption or emission spectra. In systems containing extended aromatic rings it is possible for a π-stacked dimer to form in an anti-periplanar orientation where a charge transfer between the rings quenches the emission.[31] In the case of ICAN these dimers (not only π-stacked, but hydrogen bonded dimers as well) are not stable having typical enthalpies of formation around +26.5 and +32.3 kJ/mol shown in Fig. S32. For the complex these values are nearly zero (Fig. S33, Fig. S34 shows an acetate stabilized dimer) indicating the possible role of such dimers in fluorescence quenching. The calculated spectrum of the stacked complex indeed contains a low energy dark state (zero oscillator strength) at 616 nm and a bright state at 496 nm.
It should be noted however, that these excited state optimizations on such weakly bonded systems calculations have very bad convergence behavior and we were unable to get fully converged (under Gaussian09’s default convergence criteria) states.
Ag:ICAN 1:2 or 2:2 type complexes were also investigated. The built 2:2 complexes shown in Fig. S35 can be disregarded even without calculating their spectra as either they broke into two 1:1 fragments or gave high energies during optimization. The only structure that is energetically close to the separated fragments is the π-stacked isomer mentioned above. The 1:2 type complex shown in Figure 9. has two possible excited states depending on the planarization of the two amino groups. The lower energy isomer has one planar (the 1:1 complex has planar ─NH2) and one trigonal amino group and has two emission peaks (429 and 522 nm in Figure S37) due to that (experimentally only the lower energy band can be observed due to Kasha’s rule). Interestingly the calculated absorption maximum of 421 nm is much higher than the corresponding
experimental value (387 nm) but the lower energy emission band gives an exact match (522 nm calc vs. 521 nm expt). However if we consider the shift between the emission of ICAN and its Ag(I) complex the calculations give a Δλem = 43 nm for the 1:1 complex which is closer to the experimental 54 nm than the Δλem of 69 nm for the 1:2 complex. This together with the errors in the absorption maxima further strengthens the experimental finding of the presence of the 1:1 complex.
21
H−1 H−1
HOMO HOMO LUMO LUMO
L+1 L+1
L+1
LUMO
HOMO
H−1 L+1
LUMO
HOMO
H−1
diMICAN ICAN
Figure 8. Molecular orbitals of diMICAN, ICAN and their Ag complexes which have important contributions to the low energy region of the absorption spectrum. In the case of twisted
diMICAN structure the π orbital of the amino nitrogen does not play any role in the excitation process. AgICAN has one calculated absorption at 409 nm corresponding to HOMO → LUMO transition and another at 359 nm with HOMO → L+1 character. This latter has near zero oscillator strength.
22
0 10000 20000 30000 40000 50000 60000
250 300 350 400 450 500 550 600 650
Intensity
λ (nm)
Figure 9. Calculated absorption spectra of ICAN and its different Ag complexes in THF.
Silver-ICAN complexes in aqueous medium and their possible application for biolabeling In our previous work we demonstrated that both nonreactive and reactive ICAN derivatives are possible candidates for biolabeling,[22] where low background fluorescence is essential. The addition of Ag(I) to aqueous ICAN solution did not result any considerable (5-10 nm) shift in the emission maximum, however the PL intensity dropped significantly even after the addition of 0.15 eq Ag(I) as is presented in Figure 10 and at ~2 eq. Ag(I) it stabilized at a minimum level of I/Io=0.11. It means that complex formation is accompanied by a switch-off effect that reduces the fluorescence of the 1:1 complex to almost 1/10th of the original ICAN ligand. The equilibrium constant for the 1:1 complex was determined by fitting the calculated [Ag(ICAN)]+
concentrations on the experimental values based on Equation S7. KAgL,aq=7.0±2.6x10⁶ M-1 was obtained, almost the same value as determined for ICAN in dioxane (7.6x10⁶ M-1).
23
Figure 10. Spectral changes during the addition of AgTFA to ICAN (c=3.80x10⁻⁶ M, V=3.00 mL) solution in water. Each line represent the addition of 1.72 nmol of AgTFA. The inset diagram shows the fitting of the experimental (♦) data and the calculated values (line) based on Eq. S7.
To exploit the advantage of the reduced fluorescence of the complex, labeling experiments with Bovine serum albumin (BSA) were carried out. 8 molar equivalent of BSA was added to the aqueous solution of ICAN (c=2.4x10⁻⁶ M) and the PL spectra of ICAN and that of the ICAN- BSA complex were recorded. The experiment was repeated after the addition of 2 eq. of Ag(I) to the ICAN solution to coordinate all the ICAN ligand with Ag(I). In comparison the 1:2 complex [Ag(ICAN)2]TFA from DMSO stock solution was also diluted to the same concentration as the free ICAN. In each case the addition of BSA followed and the spectra were recorded again. The results are presented in Figure 11.
24
Figure 11. Spectral changes following the addition of BSA to ICAN (dashed) to its 1:1 complex with Ag(I) (solid line) and to its 1:2 complex [Ag(ICAN)2]TFA (dotted line). (co, ICAN=2.4x10⁻⁶ M, co, BSA=2.0x10⁻⁵ M, V=3.00 mL, T=20 ºC, λex=365 nm). The inset picture shows the 1:1 complex in water before (a) and after the addition of BSA (b).
As it is evident from Figure 11 the addition of BSA to both the pure ligand and to complexated forms (AgL and AgL2 complex) results in a significant increase in PL intensity and a nearly 20 nm hypsocromic shift. The same emission maximum and the ~40% intensity difference of the peak intensities (BSA complexes) indicate that approximately the same amount of free ICAN binds to BSA. It may be attributed to the disintegration of the Ag-ICAN complexes because of the higher binding affinity of Ag(I) to the protein. This phenomenon may be useful for
transporting Ag(I) ions to living cells. The other more important result of this experiment is contrast enhancement. The I/Io value for ICAN-BSA complex is ~4 in this concentration range while owing to the negligible fluorescence of the AgICAN complex the I/Io value increases to
~25 when mixing the complex with BSA. In the case of the 1:2 complex I/Io ~7. In short, using either the 1:1 or the 1:2 Ag-ICAN complexes instead of the free ligand ICAN the same BSA-
a b
25
ICAN complex with the same spectral properties can be prepared, however the contrast of the image can be enhanced by 6 and 2 fold respectively.
Based on our ongoing research, MICAN can be used as a vital and nonvital cell stain as well.
In quantitative fluorescence microscopy, we want to measure the signal coming from the
fluorophores used to label the object of interest in our specimen. Background adds to the signal of interest, such that the intensity values in the digital image are equal to the signal plus the
background. To accurately and precisely measure the signal of interest, background should be reduced as much as possible.[32] In our case background arises as the fluorescence of non-bonded dye molecules outside the cells.
MICAN:Ag 1:1 complex was prepared in situ in water and was used for staining fixated HaCaT cells. The fluorescence microscopic images of the stained cells are presented in Figure 12.
HaCaT+MICAN HaCaT+MICAN_Ag
26
Figure 12. Fixated HaCaT cells stained with aqueous MICAN and MICAN:Ag 1:1 complex. The bottom plot shows the intensity-distance distribution for two HaCaT cells selected from the original of the upper images. The inset picture shows the starting aqueous stains under UV irradiation (λex=365 nm,
[MICAN]=22.0 μM).
As can be seen in Fig.12 (bottom, inset) the fluorescene of MICAN is almost completely quenched in water upon the addition of 2 eq. AgTFA. This is also apparent by looking at the images of the stained cells. When using pure MICAN the cells are surrounded by a bright halo, which disappears completely in the case of the 1:1 complex, resulting a significant contrast enhancement. In addition, there is no observable difference between the stainig ability of the free MICAN and its Ag complex. The details and brightness of the stained cells are the same. To quantify the background reduction effect of the complex, intensity-distance plots were
constructed using the ImageJ software. Two stained cells (stained with MICAN and its 1:1 Ag complex respectively) of approximately the same luminosity and diameter were chosen. The same selection mask was applied on them (FigS38) and the intensity of the green channel as a function of distance was recorded and is presented in Figure 12 (bottom). It can be well seen that
27
both cells are approximately the same diameter and the edge of the cell is easily determined due to the sharp decrease of the intensity when using the Ag complex. Outside the cell the intensity drops to virtually 0. In contrast, when using pure MICAN as the stain, a clear halo is visible on both the left and right sides of the cell covering an approximately 50 pixel wide area, which is almost one-third of the cell diameter. In this region the intensity decreases slowly making difficult to determine the edges and eventually reaches minimum values of ~2.5-7 % of the maximum value in the selected region.
As we mentioned earlier the ligands discussed in this study may also be used as vital cell stains, therefore their cytotoxicity was studied using the MTT bio assay technique. The results are detailed in the Supporting Information as a separate chapter. The LD50 values were determined to be 10 μg/ml for ICAN, 18 μg/ml for MICAN, 13 μg/ml for diMICAN, 7 μg/ml for diAllylICAN, 8 μg/ml for ACAIN and less than 1.25 μg/ml for the MICAN:Ag 1:1 complex. It can be
concluded that the toxicity order is Ag-complex>reactive ICAN derivatives>ICAN>alkylated ICAN derivatives. For in vivo applications MICAN and diMICAN seem to be the most suitable, however the enhanced toxicity of the Ag-complex may find its use in medical applications where the selective destruction of cells is the priority.
Conclusions
The complex formation of novel, solvatochromic 1-amino-5-isocyanonaphthalene (ICAN) derivatives was studied in the presence of Ag(I) ions. UV-vis and steady-state fluorescence spectroscopic results revealed the exclusive presence of 1:1 complexes in solutions in
concentrations below 10 mM. By increasing the concentration, independently of the ratio of the Ag(I) and ligand the formation of a solid yellow precipitate was observed, which was identified as the 1:2 AgL2 complex. The 1:2 complex can be redissolved in DMSO, where based on 1H NMR it is the only species in solution. The 1:1 complex, however, cannot be prepared in a solid form and the 1:2 complex was not detected in other solvents.
The formation of the 1:1 complex in organic solvents is accompanied by a significant
batochromic shift in both the absorption and the emission spectra (Δλabs=19-32 nm Δλem=30-59 nm). The redshifts were found to be largely solvent dependent: in water they were negligible, whereas the largest Δλem values were measured in moderately polar solvents such as chloroform and dioxane. In contrast, Δλem did not show a significant variation with different counterions
28
(TFA, BF4-, and ClO4-) and the N-substituent of the ligand. For most of the ICAN ligands the quantum yield of the complex was lower than that of the free ligand, and the opposite is valid in the case of ACAIN. These fluorescence switch-off and –on phenomena can be favorably used in practical applications. The equilibrium constants were found to be K=106 – 107 M-1 in dioxane and ~104 M-1 in acetonitrile, where competitive complexation of Ag(I) with the solvent is present.
Time resolved fluorescene measurements showed that the fluorescence decay rates of the complexes were nearly equal (k~7x10⁷ s-1) but also revealed the increased rate of nonradiative decay processes in 1:1 complexes compared to the free ligands. However, the radiative decay rate increased after the complexation of ACAIN with Ag(I), which was caused by the termination of an internal quenching pathway in the uncomplexed ligand. The structure and optical properties of the complexes were explained by high-level quantum chemical calculations. DFT calculations revealed a linear orientation of the 1:1 complex, where in the lowest energy isomer the silver(I) ion coordinates to the isocyano moiety. Based on the M06 functional the calculated wavelength shifts match the experimental values. Fluorescence quenching in the case of ICAN may be accounted for by the possible formation of π-stacked dimers in an anti-periplanar orientation, where it is possible that a charge transfer between the rings quenches the emission. 2:2 type complexes were also investigated and their presence were excluded in solution since either they broke into two 1:1 fragments or gave high energies during optimization. The practical
applications of the 1:1 complexes were demonstrated by two examples. ACAIN in dioxane:water 9:1 mixture proved to be a highly selective analytical reagent for the quantitative determination of aqueous Ag(I)-ions. The fluorescene swhitch-off in the 1:1 AgL complexes of ICAN can be advantageously applied in biolabeling processes due to the reduced background flluorescene. It was found that the complex disintegrates after binding to proteins, while it is higly stable in aqueous solution. In addition, MICAN:Ag 1:1 complex was shown to enhance the contrast during the staining of HACaT cells while no observable difference between the stainig ability of the free MICAN and its Ag complex could be observed. The details and brightness of the stained cells are the same.
Experimental
29 Materials
Acetonitrile (MeCN), tetrahydrofuran (THF), methanol (MeOH), dimethyl-sulfoxide (DMSO), chloroform, ethyl-acetate (EtOAc), 1,4-dioxane (reagent grade, Reanal, Hungary), silver-
trifluoroacetate (AgTFA, Sigma-Aldrich), silver-tetrafluoroborate (AgBF4) and silver-perchlorate (AgClO4) (Alfa Aesar GmbH) were used without further purification.
TbCl3, MnCl2, ZnCl2, Pb(NO3)2, NiCl2, NdCl3, GdCl3, MgCl2, CuCl2, AlCl3, CoCl2, CeCl3, DyCl3, CaCl2, LuCl3, EuCl3, YCl3, Ga(NO3)2, Bi(ClO4)3, Fe(NO3)3 aqueous stock solutions were provided by the Inorganic and Analitical Chemistry Department of University of Debrecen.
Synthesis
The synthesis of the ligands: 1-amino-5-isocyanonaphthalene (ICAN), 1-N-methylamino-5- isocyanonaphthalene (MICAN) 1-N,N-dimethylamino-5-isocyanonaphthalene (diMICAN) 1- N,N-diallylamino-5-isocyanonaphthalene (diAllylICAN) and 1-(2-acryloyloxy-3-chloro-prop-1- yl)-amino-5-isocyanonaphthalene (ACAIN) are given in Refs[22,33-34]
Methods NMR
1H spectra were recorded in DMSO-d6 at 25 ºC on a Bruker AM 360 spectrometer at 360 MHz with tetramethylsilane as the internal standard.
Electrospray Quadrupole Time-of-Flight MS/MS (ESI-Q-TOF)
The ESI-MS measurements were carried out by a MicroTOF-Q type Qq-TOF MS instrument (Bruker Daltonik, Bremen, Germany). The spray voltage was 4 kV and N2 was used as nebulizer and drying gas (temperature: 200 °C, flow rate: 4.0 L/min). The samples were solved in methanol in the concentration of 0.01 mg/mL and injected directly to the mass spectrometer with a syringe pump (Cole-Parmer Ins. Co., Vernon Hills, IL, USA) at the flow rate of 3 L/min. The mass spectra were recorded by means of a digitizer at a sampling rate of 2 GHz. The mass spectra were calibrated externally using the exact masses of cluster ions of sodium trifluoracetate
30
[(NaTFA)n+Na]+ generated under electrospray condition. The spectra were evaluated with the DataAnalysis 3.4 software from Bruker.
UV-vis
The UV-vis spectra were recorded on an Agilent Cary 60 spectrophotometer (Agilent, Santa Clara, CA, USA) in a quartz cuvette of 1.00 cm optical length. 3.00 cm3 solution was prepared from the sample.
Fluorescence measurements
Steady-state fluorescence measurements were carried out using a Jasco FP-8200 fluorescence spectrophotometer equipped with a Xe lamp light source. The excitation and emission spectra were recorded at 20 °C, using 2.5 nm excitation, 5.0 nm emission bandwith, and 200 nm/min scanning speed. Fluorescence quantum yields were calculated by using quinine-sulfate in 0.1 mol/L sulfuric acid as the reference absolute quantum efficiency (Φn = 55%).
UV-vis spectrophotometric and fluorescence titration
1.306 mM stock solutions of the ligands were prepared in the solvent of interest and were diluted to V0=3.00 mL with the same solvent to give 4.69x10⁻⁵ M for UV-vis and 4.69x10⁻⁶ M solution for fluorescence measurements. 10 μL portions of [Ag+]=3.44 mM stock solutions were added and allowed to equilibrate for 2 minutes. The raw spectra were corrected by dilution and the background was substracted as well.
Analytical determination of Ag+ ions
100 mL of [ACAIN]=4.69x10⁻⁶ M solution was prepared in dioxane. 2.70 mL of this solution was transferred to a quartz cuvette with 1.00 cm optical length. Different portions of a
[Ag+]=3.44 mM aqueous stock solution and deionized water were added so that their sum was always 300 μL making the final volume of the mixture 3.00 mL in each case. For the selectivity determination experiments 300 μL aqueous portions of the metal ions in a concentration of 1.16x10⁻⁵ M (~2.5 equivalent) were added to the 2.70 mL ACAIN solution in dioxane. Every measurement was carried out three times and errors were calculated. The spectra were processed using Spekwin32 software.[35]
31 Laser flash photolysis
The experiments have been carried out in an Applied Photophysics LKS.60 nanosecond transient absorption spectrometer, equipped with a Quantel Brilliant Nd:YAG laser (1064 nm) along with its second, third and fourth harmonic generator. Third harmonic was used, which emits at 355 nm. For parameter fitting to the experimental data, a home-made computer program written in Turbo Pascal using the Gauss-Newton-Marquardt procedure was employed.[36]
Cell staining with MICAN and its 1:1 Ag complex
For the staining Human keratinocyte cell line (HaCaT) was used which was derived from human skin. The cells were cultured on microscopy slides and fixed with 4 % polyformaldehyde for 10 minutes, and washed for 30 minutes in PBS, then dehydrated at 200°C (in a hot air sterilizer) for 15 minutes. From MICAN 50 ml stock solution was prepared at a concentration of 0.200 mg/ml (1.10 mM) in DMSO. It was diluted in water to a concentration of 4.00 μg/ml (22.0 μM) which was used for cell staining. The Ag-MICAN 1:1 complex for staining was prepared in situ by mixing the appropriate volumes of diluted MICAN and aqueous AgTFA stock solution with a concentration of 0.762 mg/ml (3.45 mM) to obtain a final Ag+ concentration of 9.72 μg/ml (44.0 μM). For a more detailed description see the Supporting Information.
Density Functional Theory (DFT) calculations
All calculations were performed using the Gaussian09 E.01 software package.[37] We employed DFT and TDDFT for geometry optimizations at the ground and excited states respectively. The chosen functional was the M06[38] with the TZVP basis set[39] because it is able to describe some amount of the dispersion forces in contrast to B3LYP[40] and CAM-B3LYP[41] which was found to be necessary to properly optimize π-stacked structures[33]. On the silver atom we used the CRENBL ECP/basis[42]. The calculations were done using the IEF-PCM solvent model.[43-46]
Acknowledgment
This work was financially supported by the grants K-116465 and GINOP-2.3.2-15-2016-00041 given by NFKI (National Research, Development and Innovation Office, Hungary). Furthermore,
32
this paper was also supported by the János Bolyai Research Scholarship of the Hungarian Academy of Sciences (Miklós Nagy). The research was supported through the NEW
NATIONAL EXCELLENCE PROGRAM of the Ministry of Human Capacities of Hungary (J.
Kalmár).
Supporting Information
Copies of NMR, MS and optical spectra, computational details and derivation of equations.
References
[1] S. S. van Berkel, B. G. M. Bögels, M. A. Wijdeven, B. Westermann, F. P. J. T. Rutjes, Eur.
J. Org. Chem. 2012, 19, 3543–3559.
[2] S. Chakrabarty, S. Choudhary, A. Doshi, F. Q. Liu, R. Mohan, M. P. Ravindra, D. Shah, X.
Yang, F. F. Fleming, Adv. Synth. Catal. 2014, 356, 2135–2196.
[3] A. Dömling, Chem. Rev. 2006, 106, 17–89.
[4] P. R. Norton, P. A. Young, Q. Cheng, N. Dryden, R. J. Puddephatt, Surf. Sci. 1994, 307, 172- 176.
[5] R. E. Bachman, M. S. Fioritto, S. K. Fetics, T. M. Cocker, J. Am. Chem. Soc. 2001, 123, 5376-5377.
[6] M. Benouazzane, S. Coco, P. Espinet, J. M. Martín-Alvarez, J. Barberá, J. Mater. Chem.
2002, 12, 691-696.
[7] M. J. Baena, S. Coco, P. Espinet, Cryst. Growth Des. 2015, 15, 1611–1618.
[8] D. Piché, P. D. Harvey, Can. J. Chem. 1994, 72, 705-713.
[9] B. Djordjevic, O. Schuster, H. Schmidbaur, Z. Naturforsch. 2006, 61b, 6–10.
[10] F. Klages, K. Moenkmeyer, Chem. Ber. 1952, 85, 109-122.
[11] A. Cotton, F. Zingales, J. Am. Chem. Soc. 1961, 83, 351-355.
[12] Y. Yamamoto, K. Aoki, H. Yamazaki, Inorg. Chim. Acta, 1982, 68, 15-18.
[13] A. Bell, D. A. Edwards, J. Chem. Soc., Dalton Trans. 1984, 1317-1321.
33
[14] G. Minghetti, F. Bonati, M. Massobrio, Inorg. Chem. 1975, 14, 1974-1977.
[15] U. H. F. Bunz, Chem. Rev. 2000, 100, 1605–1644.
[16] Y. B. Dong, G. X. Jin, M. D. Smith, R. Q. Huang, B. Tang, H. C. zur Loye, Inorg. Chem.
2002, 41, 4909−4914.
[17] D. Fortin, M. Drouin, M. Turcotte, P. D. Harvey, J. Am. Chem. Soc. 1997, 119, 531-541.
[18] V. W. W. Yam, K. M. C. Wong, Chem. Commun. 2011, 47, 11579–11592.
[19] K. B. Li, W. P. Jia, D. M. Han, D. X. Liang, X. P. He, G. R. Chen, Sensor. Actuat. B- Chem. 2017, 246, 197–201
[20] X. He, Y. Zang, T. D. James, J. Li, G. Chen, J. Xie, Chem. Commun. 2016, 53, 82-90.
[21] X. P. He, Y. L. Zeng, X. Y. Tang, N. Li, D. M. Zhou, G. R. Chen, H. Tian, Angew. Chem.
Int. Ed. 2016, 55, 1–6.
[22] M. Nagy, D. Rácz, Z. L. Nagy, T. Nagy, P. P. Fehér, M. Purgel, M. Zsuga, S. Kéki, Dyes Pigm. 2016, 133, 445-457.
[23] K. A. Zachariasse, M. Grobys, Th. von der Haar, A. Hebecker, Yu. V. Il'ichev, Y.-B.
Jiang, O. Morawski, W. Kühnle, J. Photoch. Photobio. A, 1996, 102, 59-70.
[24] A. Fakhari M., S. E. Rokita, Chem. Commun. 2011,47, 4222-4224.
[25] V. P. Fadeeva, V. D. Tikhova, O. N. Nikulicheva, Zh. Anal. Khim., 2008, 63, 1094–1106.
[26] A. Chatterjee, M. Santra, N. Won, S. Kim, J. K. Kim, S. B. Kim, K. H. Ahn, J. Am. Chem.
Soc. 2009, 131, 2040–2041.
[27] Y. Zhang, D. Wang, C. Sun, H. Feng, D. Zhao, Y. Bi, Dyes Pigm. 2017, 141, 202-208.
[28] M. Zhu, Y. Zhou, L. Yang, L. Li, D. Qi, M. Bai, Y. Chen, H. Du, Y. Bian, Inorg. Chem., 2014, 53, 12186–12190.
[29] W. Shi, S. Sun, X. Li, H. Ma, Inorg. Chem. 2010, 49, 1206–1210.
[30] Z. Xu, S. Zheng, J. Yoon, D. R. Spring, Analyst 2010, 135, 2554–2559.
[31] J. Liang, Q. L. Nguyen, S. Matsika, Photochem. Photobiol. Sci. 2013, 12, 1387–1400.
[32] J. C. Waters, J. Cell Biol. 2009 185, 1135-1148.
[33] M. Nagy, D. Rácz, L. Lázár, M. Purgel, T. Ditrói, M. Zsuga, S. Kéki, ChemPhysChem 2014, 15, 3614–3625.
[34] D. Rácz, M. Nagy, A. Mándi, M. Zsuga, S. Kéki, J. Photoch. Photobio. A 2013, 270, 19–
27.