International Journal of
Molecular Sciences
Article
Altered Cell Surface N-Glycosylation of Resting and Activated T Cells in Systemic Lupus Erythematosus
Enik ˝o Szabó1,Ákos Hornung2,Éva Monostori1, Márta Bocskai2,Ágnes Czibula1,* and LászlóKovács2,*
1 Institute of Genetics, Biological Research Centre of the Hungarian Academy of Sciences 6726 Szeged, Hungary
2 Department of Rheumatology and Immunology, Faculty of Medicine, University of Szeged, 6725 Szeged, Hungary
* Correspondence: czibula.agnes@brc.hu (Á.C.); kovacs.laszlo@med.u-szeged.hu (L.K.)
Received: 13 August 2019; Accepted: 5 September 2019; Published: 10 September 2019
Abstract: Altered cell surface glycosylation in congenital and acquired diseases has been shown to affect cell differentiation and cellular responses to external signals. Hence, it may have an important role in immune regulation; however, T cell surface glycosylation has not been studied in systemic lupus erythematosus (SLE), a prototype of autoimmune diseases. Analysis of the glycosylation of T cells from patients suffering from SLE was performed by lectin-binding assay, flow cytometry, and quantitative real-time PCR. The results showed that resting SLE T cells presented an activated-like phenotype in terms of their glycosylation pattern. Additionally, activated SLE T cells bound significantly less galectin-1 (Gal-1), an important immunoregulatory lectin, while other lectins bound similarly to the controls. Differential lectin binding, specifically Gal-1, to SLE T cells was explained by the increased gene expression ratio of sialyltransferases and neuraminidase 1 (NEU1), particularly by elevated ST6 beta-galactosamide alpha-2,6-sialyltranferase 1 (ST6GAL1)/NEU1and ST3 beta-galactoside alpha-2,3-sialyltransferase 6 (ST3GAL6)/NEU1ratios. These findings indicated an increased terminal sialylation. Indeed, neuraminidase treatment of cells resulted in the increase of Gal-1 binding. Altered T cell surface glycosylation may predispose the cells to resistance to the immunoregulatory effects of Gal-1, and may thus contribute to the pathomechanism of SLE.
Keywords: systemic lupus erythematosus; T cells; glycosylation; sialylation; lectin binding;
glycosylation enzymes; galectin 1
1. Introduction
Numerous congenital and acquired diseases show altered cell surface glycosylation, including several types of cancer and autoimmune syndromes [1,2]. Altered oligosaccharide structures have been identified in tumors and have proven to be diagnostic markers of malignant phenotypes [1,3,4].
Protein glycosylation has become an integral part of research in autoimmunity, as defective glycan structures have been described on serum immunoglobulins [5] and the different glycans at certain residues on IgG subclasses affected the effector function of autoantibodies [6,7]. Surface glycosylation of immune cells has also been studied, and glycoconjugates have been proven to play a role in many fields of cellular physiology, such as migration and signal transduction [8]. T cell functions can also be modulated by interaction between cell surface glycoproteins and endogenous lectins, including galectins [9].
Glycoconjugates are created in the endoplasmic reticulum, the Golgi apparatus, and on the cell surface by enzymes, including mannosidases, glycosyltransferases, sialyltransferases, and neuraminidases (NEU) [10]. The concerted action of these enzymes produces the specific sugar
Int. J. Mol. Sci.2019,20, 4455; doi:10.3390/ijms20184455 www.mdpi.com/journal/ijms
Int. J. Mol. Sci.2019,20, 4455 2 of 14
‘code’ presented on the cell surface, which then regulates further signaling and adhesion properties of a particular cell type. The expression of enzymes participating in glycosylation can determine the sensitivity of the cells to numerous extracellular signals.
Galectin 1 (Gal-1) is a member of theβ-galactoside binding mammalian lectin family with specific affinity to terminal N-acetyllactosamine motifs on multi-antennary cell surface glycans [11]. One of the major effects of Gal-1 in immunoregulation is the induction of apoptosis of the activated T cell subpopulations Th1 and Th17, whereas Th2 and Treg cell functions are promoted by Gal-1 [12,13].
This selectivity is caused by the differences in surface glycosylation of various T cell subtypes [9].
Gal-1-triggered cell death has been extensively studied in vitro, and its mechanism has been described [14–18]. Lactosamine sequences, required for Gal-1 binding, are synthesized by specific glycosyltransferases, such as beta-N-acetylglucosaminyltransferases and beta-galactosyltransferases.
The expression of such enzymes controls T cell susceptibility to Gal-1-driven apoptosis [19].
We have recently demonstrated that activated T cells from patients with active systemic lupus erythematosus (SLE) are resistant to the apoptotic effect of Gal-1 [20], and we suggested that this finding is relevant to the immunoregulatory dysfunction observed in SLE. As a potential cause of this resistance may be an impaired binding of Gal-1 to the T cell surface, we set out to examine cell surface glycosylation and the expression of glycosylation enzymes in SLE T cells in comparison with healthy control T cells. The glycosylation pattern of resting SLE T cells resembled the activated phenotype of T cells. Activated SLE T cells bound significantly less galectin 1 (Gal-1) than the controls, while other lectins bound similarly. To understand the distinct lectin binding, specifically Gal-1, to SLE T cells, we found that the terminal sialylation increased in the autoimmune cells, and accordingly, neuraminidase treatment resulted in a remarkable increase in Gal-1 binding.
2. Results
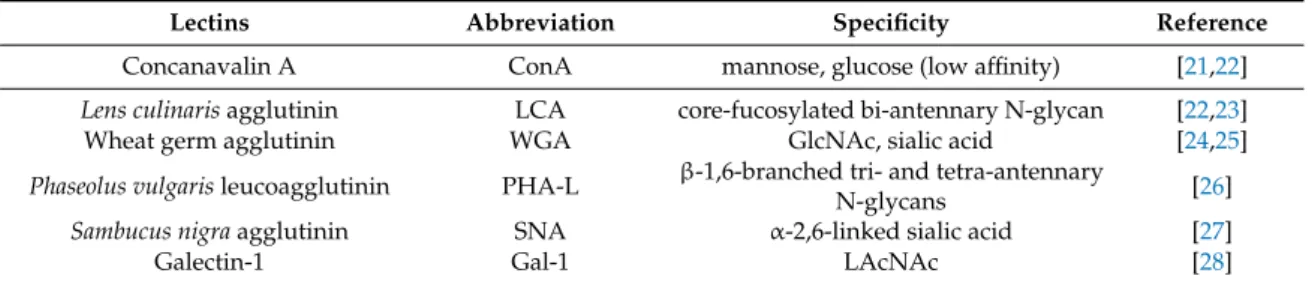
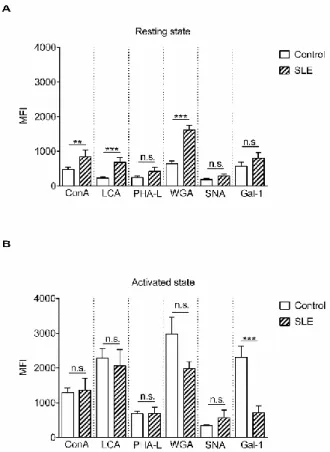
The N-glycome diversity of T cell surface glycans was analyzed by the binding of lectins derived from plants (concanavalin-A (ConA),Lens culinarisagglutinin (LCA), wheat germ agglutinin (WGA), Phaseolus vulgarisleukoagglutinin (PHA-L), andSambucus nigraagglutinin (SNA)) or of a human lectin, Gal-1, with known sugar binding specificity (Figure S1 and Table1). Lectin binding to resting and phytohaemagglutinin (PHA)-activated T cells obtained from SLE patients and healthy controls was measured. Analysis of resting T cells from SLE patients and control individuals revealed that resting SLE T cells bound significantly more ConA, LCA, and WGA than healthy T cells (Figure1A).
ConA couples with mannoses present in early high-mannose glycans and mannoses in complex sugars [21,22], while LCA has high affinity to fucosylated core mannoses present in bi-antennary complex N-glycans and does not bind to tri- and tetra-antennary N-glycans [23]. WGA binds to N-acetyl glucosamines present in hybrid-type sugar chains (early and complex sugars) or to sialic acid, which can be terminally attached to complex multi-antennary glycans, and its affinity to the sialylated version of tri- or tetra-antennary glycan-containing glycoproteins was shown to be higher than to the desialylated form [24,25].
Table 1.Names, abbreviations, and binding specificities of lectins.
Lectins Abbreviation Specificity Reference
Concanavalin A ConA mannose, glucose (low affinity) [21,22]
Lens culinarisagglutinin LCA core-fucosylated bi-antennary N-glycan [22,23]
Wheat germ agglutinin WGA GlcNAc, sialic acid [24,25]
Phaseolus vulgarisleucoagglutinin PHA-L β-1,6-branched tri- and tetra-antennary
N-glycans [26]
Sambucus nigraagglutinin SNA α-2,6-linked sialic acid [27]
Galectin-1 Gal-1 LAcNAc [28]
Abbreviation: GlcNAc: N-acetylgucosamine; LacNAc: N-acetyllactoseamine.
Int. J. Mol. Sci.2019,20, 4455 3 of 14
Int. J. Mol. Sci. 2019, 20, x FOR PEER REVIEW 4 of 15
Figure 1. Lectin binding properties of resting and activated T cells from healthy donors and from systemic lupus erythematosus (SLE) patients. Peripheral blood T cells were obtained from healthy controls and SLE patients. The cells were left unstimulated (resting state, A) or were activated with 1 µ g/mL phytohaemagglutinin L (PHA L) for 72 h (activated state, B). Cells were stained with viability dye, fixed then labeled with anti-CD3-PE-Cy5 antibody, followed by fluorescein isothiocyanate (FITC)-conjugated lectin. The samples were evaluated with flow cytometry. Binding of FITC- conjugated lectins is shown as mean (±SEM) of the median fluorescence intensity (MFI) values of flow cytometry histograms of resting (A) or activated (B) CD3-positive live T cells. Lectin names are listed in Table 1. MFI: mean fluorescence intensity, ConA: concanavalin-A, LCA: Lens culinaris agglutinin, WGA: wheat germ agglutinin, PHA-L: Phaseolus vulgaris leukoagglutinin, SNA: Sambucus nigra agglutinin, Gal-1: galectin 1. Statistical analysis was performed using an unpaired Student t-test. ** p
< 0.01; *** p < 0.001; n. s.: not significant. SLE: n = 18, and healthy controls: n = 19.
Comparing healthy and autoimmune-activated T cells, we found that activated SLE T cells bound lectins in levels similar to control cells with the exception of Gal-1. SLE cells bound significantly less Gal-1 than control cells, indicating that terminal N-acetyllactosamine side chains, the Gal-1 ligands, were less accessible on these cells (Figure 1B). The changes in the pattern of lectin bindings did not occur preferentially on either CD4+ or CD4- (CD8+) cells, as these were similar in the control as well as in SLE activated T cells (Figure S2).
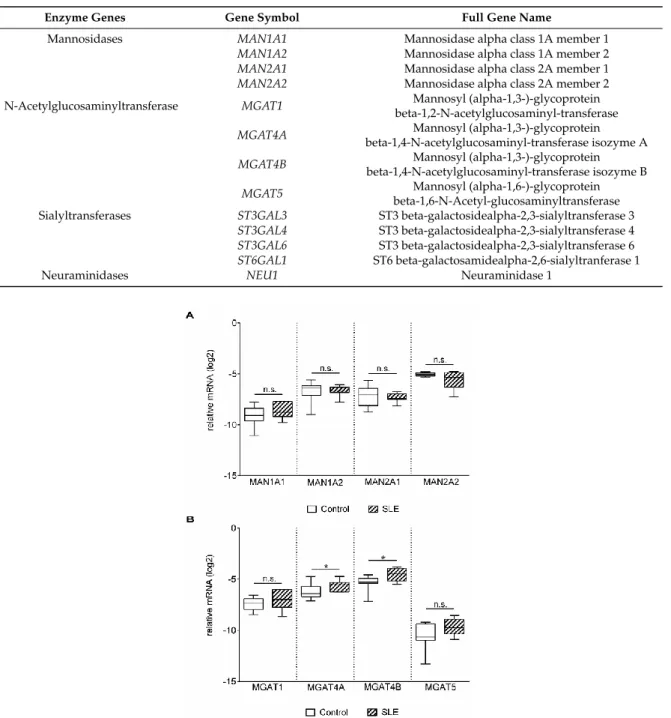
Glycosylation of proteins is regulated by multiple factors in the Golgi apparatus, such as sub- Golgi localization of glycosylation enzymes, transporters, pH, endoplasmic reticulum stress, or substrate availability (reviewed in [29]). However, a major element is the expression and function of glycosylation enzymes [30,31]. Therefore, expression levels of the genes involved in N-linked glycosylation (Figure S1 and Table 2) were examined by qPCR analysis of activated T cells. Gene expression of alpha mannosidases (MAN1A1, MAN1A2, MAN2A1 and MAN2A2) in activated SLE T cells did not differ from the controls (Figure 2A). Analysis of beta-N-acetylglucosaminyltransferases (MGAT1–5) presented a slight but significant difference in the cases of MGAT4A and MGAT4B (Figure 2B).
Figure 1. Lectin binding properties of resting and activated T cells from healthy donors and from systemic lupus erythematosus (SLE) patients. Peripheral blood T cells were obtained from healthy controls and SLE patients. The cells were left unstimulated (resting state, A) or were activated with 1µg/mL phytohaemagglutinin L (PHA L) for 72 h (activated state,B). Cells were stained with viability dye, fixed then labeled with anti-CD3-PE-Cy5 antibody, followed by fluorescein isothiocyanate (FITC)-conjugated lectin. The samples were evaluated with flow cytometry. Binding of FITC-conjugated lectins is shown as mean (±SEM) of the median fluorescence intensity (MFI) values of flow cytometry histograms of resting (A) or activated (B) CD3-positive live T cells. Lectin names are listed in Table1.
MFI: mean fluorescence intensity, ConA: concanavalin-A, LCA:Lens culinarisagglutinin, WGA: wheat germ agglutinin, PHA-L:Phaseolus vulgarisleukoagglutinin, SNA:Sambucus nigraagglutinin, Gal-1:
galectin 1. Statistical analysis was performed using an unpaired Studentt-test. **p<0.01; ***p<0.001;
n. s.: not significant. SLE:n=18, and healthy controls:n=19.
Comparing healthy and autoimmune-activated T cells, we found that activated SLE T cells bound lectins in levels similar to control cells with the exception of Gal-1. SLE cells bound significantly less Gal-1 than control cells, indicating that terminal N-acetyllactosamine side chains, the Gal-1 ligands, were less accessible on these cells (Figure1B). The changes in the pattern of lectin bindings did not occur preferentially on either CD4+or CD4- (CD8+) cells, as these were similar in the control as well as in SLE activated T cells (Figure S2).
Glycosylation of proteins is regulated by multiple factors in the Golgi apparatus, such as sub-Golgi localization of glycosylation enzymes, transporters, pH, endoplasmic reticulum stress, or substrate availability (reviewed in [29]). However, a major element is the expression and function of glycosylation enzymes [30,31]. Therefore, expression levels of the genes involved in N-linked glycosylation (Figure S1 and Table2) were examined by qPCR analysis of activated T cells. Gene expression of alpha mannosidases (MAN1A1,MAN1A2,MAN2A1andMAN2A2) in activated SLE T cells did not differ from the controls (Figure2A). Analysis of beta-N-acetylglucosaminyltransferases (MGAT1–5) presented a slight but significant difference in the cases of MGAT4A and MGAT4B (Figure2B).
Int. J. Mol. Sci.2019,20, 4455 4 of 14
Table 2.Symbols and full names of glycosylation enzyme genes.
Enzyme Genes Gene Symbol Full Gene Name
Mannosidases MAN1A1 Mannosidase alpha class 1A member 1
MAN1A2 Mannosidase alpha class 1A member 2 MAN2A1 Mannosidase alpha class 2A member 1 MAN2A2 Mannosidase alpha class 2A member 2 N-Acetylglucosaminyltransferase MGAT1 Mannosyl (alpha-1,3-)-glycoprotein
beta-1,2-N-acetylglucosaminyl-transferase MGAT4A Mannosyl (alpha-1,3-)-glycoprotein
beta-1,4-N-acetylglucosaminyl-transferase isozyme A MGAT4B Mannosyl (alpha-1,3-)-glycoprotein
beta-1,4-N-acetylglucosaminyl-transferase isozyme B MGAT5 Mannosyl (alpha-1,6-)-glycoprotein
beta-1,6-N-Acetyl-glucosaminyltransferase Sialyltransferases ST3GAL3 ST3 beta-galactosidealpha-2,3-sialyltransferase 3
ST3GAL4 ST3 beta-galactosidealpha-2,3-sialyltransferase 4 ST3GAL6 ST3 beta-galactosidealpha-2,3-sialyltransferase 6 ST6GAL1 ST6 beta-galactosamidealpha-2,6-sialyltranferase 1
Neuraminidases NEU1 Neuraminidase 1
Int. J. Mol. Sci. 2019, 20, x FOR PEER REVIEW 5 of 15
Figure 2. Gene expression of mannosidases (MANs) (A) and N-acetyl glucosaminyltransferases (MGATs) (B) in activated T cells. Total RNA was extracted from activated T cells and mRNA expression levels were analyzed by qPCR. Results of the relative expression were normalized to the expression levels of the RPL27 housekeeping gene (log2 transformation, ΔCt). Gene names and primer sequences are listed in Table 2 and 4, respectively. Upper and lower quartiles and whiskers of boxes extend to the minimum and maximum values, and the band inside the box is the median. Statistical analysis was performed using an unpaired Student’s t-test, where * p < 0.05; SLE: n = 18, and healthy controls: n = 19.
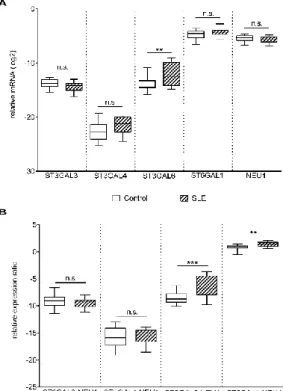
Poly-N-acetyllactosamine chains on N glycans can be capped with the attachment of α-2,6 sialic acid by ST6 beta-galactosamidealpha-2,6-sialyltranferase 1 (ST6GAL1) and α-2,3 sialic acid by ST3GAL3, ST3GAL4, and ST3GAL6 [32],and cleaved by neuraminidases. In the control and patient groups, ST6GAL1, ST3GAL3, ST3GAL4, and neuraminidase 1 (NEU1) gene expression levels were similar, whereas the mRNA level of ST3GAL6 was significantly elevated in SLE T cells (Figure 3A).
During T cell activation, the gene expression of NEU1 is strongly upregulated, while NEU3 expression remains constant [33]; hence, only NEU1 was analyzed.
Figure 2. Gene expression of mannosidases (MANs) (A) and N-acetyl glucosaminyltransferases (MGATs) (B) in activated T cells. Total RNA was extracted from activated T cells and mRNA expression levels were analyzed by qPCR. Results of the relative expression were normalized to the expression levels of theRPL27housekeeping gene (log2transformation,∆Ct). Gene names and primer sequences are listed in Table2and Table 4, respectively. Upper and lower quartiles and whiskers of boxes extend to the minimum and maximum values, and the band inside the box is the median. Statistical analysis was performed using an unpaired Student’st-test, where *p<0.05; SLE:n=18, and healthy controls:
n=19.
Poly-N-acetyllactosamine chains on N glycans can be capped with the attachment ofα-2,6 sialic acid by ST6 beta-galactosamidealpha-2,6-sialyltranferase 1 (ST6GAL1) andα-2,3 sialic acid by ST3GAL3,ST3GAL4, andST3GAL6[32],and cleaved by neuraminidases. In the control and patient groups,ST6GAL1,ST3GAL3,ST3GAL4, and neuraminidase 1 (NEU1) gene expression levels were similar, whereas the mRNA level ofST3GAL6was significantly elevated in SLE T cells (Figure3A).
Int. J. Mol. Sci.2019,20, 4455 5 of 14
During T cell activation, the gene expression ofNEU1is strongly upregulated, whileNEU3expression remains constant [33]; hence, onlyNEU1was analyzed.
Int. J. Mol. Sci. 2019, 20, x FOR PEER REVIEW 6 of 15
Figure 3. Gene expression of sialyltransferases (ST) and neuraminidase-1 (NEU1) in activated T cells.
Total RNA was extracted from activated T cells and mRNA expression levels were analyzed by qPCR.
(A) Results of the relative expression were normalized to the expression levels of RPL27 housekeeping gene (log2 transformation, ΔCt). Gene names and primer sequences are listed in Table 2 and 4, respectively. (B) ST/NEU1 mRNA expression ratios. The sialyltransferase-neuraminidase mRNA expression ratios of individual persons were calculated as follows: ΔCt ST/ΔCtNEU1. Upper and lower quartiles and whiskers of boxes extend to the minimum and maximum values, and the band inside the box is the median. Statistical analysis was performed using an unpaired Student t-test, where ** p< 0.01; *** p< 0.001. SLE: n = 18, and healthy controls: n = 19.
Concerted action of sialyltransferases and neuraminidases determine the sialylation pattern. The large variations between the Gal-1 binding of the control and SLE T cells (Figure 1B) indicated an alteration in the sialylation of SLE surface glycans. As this is determined by the net effect of enzymes that sialylate (sialyltransferase) and desialylate (neuraminidase) the glycans, gene expression ratios of the opposing acting enzymes were calculated. A significantly higher ST3GAL6/NEU1 and ST6GAL1/NEU1 mRNA ratio was observed in SLE compared to control T cells (Figure 3B), indicating higher sialylation of SLE T cells. Other sialyltransferase/neuraminidase mRNA ratios, such as ST3GAL3/NEU1 andST3GAL4/NEU1, remained similar in the control and SLE groups (Figure 3B).
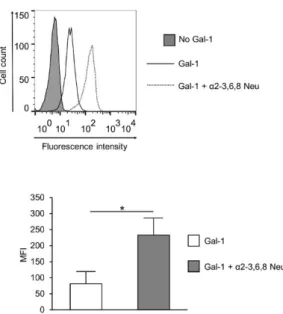
These results indicated that reduced Gal-1 binding to SLE T cells may be a result of a more densely sialylated glycan profile. Indeed, cleaving sialic acid from the surface of SLE activated T cells by α2- 3,6,8 Neu (specific to α2-3,6,8 linked sialic acid) resulting in the elevation of Gal-1 binding (Figure 4).
The increase of Gal-1 binding to SLE cells was similar to that of control T cells (data not shown).
Figure 3.Gene expression of sialyltransferases (ST) and neuraminidase-1 (NEU1) in activated T cells.
Total RNA was extracted from activated T cells and mRNA expression levels were analyzed by qPCR.
(A) Results of the relative expression were normalized to the expression levels ofRPL27housekeeping gene (log2transformation,∆Ct). Gene names and primer sequences are listed in Table2and Table 4, respectively. (B) ST/NEU1mRNA expression ratios. The sialyltransferase-neuraminidase mRNA expression ratios of individual persons were calculated as follows:∆CtST/∆CtNEU1. Upper and lower quartiles and whiskers of boxes extend to the minimum and maximum values, and the band inside the box is the median. Statistical analysis was performed using an unpaired Studentt-test, where
**p<0.01; ***p<0.001. SLE:n=18, and healthy controls:n=19.
Concerted action of sialyltransferases and neuraminidases determine the sialylation pattern.
The large variations between the Gal-1 binding of the control and SLE T cells (Figure1B) indicated an alteration in the sialylation of SLE surface glycans. As this is determined by the net effect of enzymes that sialylate (sialyltransferase) and desialylate (neuraminidase) the glycans, gene expression ratios of the opposing acting enzymes were calculated. A significantly higher ST3GAL6/NEU1 andST6GAL1/NEU1 mRNA ratio was observed in SLE compared to control T cells (Figure3B), indicating higher sialylation of SLE T cells. Other sialyltransferase/neuraminidase mRNA ratios, such asST3GAL3/NEU1andST3GAL4/NEU1, remained similar in the control and SLE groups (Figure3B).
These results indicated that reduced Gal-1 binding to SLE T cells may be a result of a more densely sialylated glycan profile. Indeed, cleaving sialic acid from the surface of SLE activated T cells by α2-3,6,8 Neu (specific toα2-3,6,8 linked sialic acid) resulting in the elevation of Gal-1 binding (Figure4).
The increase of Gal-1 binding to SLE cells was similar to that of control T cells (data not shown).
Int. J. Mol. Sci.2019,20, 4455 6 of 14
Int. J. Mol. Sci. 2019, 20, x FOR PEER REVIEW 7 of 15
Figure 4. Effect of neuraminidase treatment on Gal-1 binding of SLE T cells. Activated SLE T cells were treated with α2-3,6,8 neuraminidase (Gal-1 + α2-3,6,8 Neu; dotted line) or left untreated (Gal-1; empty, continuous line), and then Gal-1 binding was investigated by cytofluorimetry, as described in the materials and methods section. The grey shadowed histogram shows the negative control: no Gal-1, +streptavidin—FITC. The upper image shows a representative profile of Gal-1 binding, the lower graph shows means (±SEM) of the mean fluorescence intensity (MFI) values of activated SLE T cells. Statistical analysis was performed using a two-tailed paired t-test. * p < 0.05, n = 3.
3. Discussion
Selected steps of mammalian N linked glycosylation and lectin binding to specific sugar side chains are summarized in Figure S1. It must be noted that binding of the used lectins was more degenerated than what is shown in the simplified Figure S1; however, it may help in a better apprehension of this work.
Remarkable differences were detected in ConA, LCA, and WGA binding between resting SLE and control T cells, since SLE T cells bound significantly higher amounts of these lectins. As LCA and WGA recognize matured sugar side chains and ConA couples both unmatured (early) and matured (complex) glycans, these results indicated that resting SLE T cells present a glycan structure similar to their activated phenotype. Detection of other activation markers, such as heightened CD40L expression [34], CD44 expression [35–37], exhibition of constant membrane raft polarization and increased GM1 content [38], measured by others, also suggest similarity to an activated state. On the other hand, this activated phenotype did not manifest in terms of CD25 expression on resting SLE T cells, as CD25 levels were similar on resting and activated T cells, suggesting that the activated phenotype is limited to several, but not all activation markers (Figure S3).
Stimulation of control T cells with PHA-L resulted in an elevation of binding of all used lectins, except the terminal α-2,6 sialic acid binding SNA (data not shown), indicating a generally increased complexity of glycosylation pattern upon activation. These results were in accordance with previous findings, arguing that N-glycan abundance, branching, glycan chain elongation, and hereby complexity enhanced [39,40], and terminal α-2,6 sialic acid residues declined [41–43] on freshly activated T cells. However, the increase in glycan complexity after activation was hardly seen in SLE T cells, as an increase in lectin binding upon activation was rather low or was absent in SLE, a phenomenon that is also explained by the activated phenotype of SLE T cells, even without treatment with activating agents. Furthermore, the decreased Gal-1 binding of SLE T cells was observed, not only in resting state, but also persisting after activation. No difference was found between CD4+ and
Figure 4.Effect of neuraminidase treatment on Gal-1 binding of SLE T cells. Activated SLE T cells were treated withα2-3,6,8 neuraminidase (Gal-1+α2-3,6,8 Neu; dotted line) or left untreated (Gal-1;
empty, continuous line), and then Gal-1 binding was investigated by cytofluorimetry, as described in the materials and methods section. The grey shadowed histogram shows the negative control: no Gal-1,+streptavidin—FITC. The upper image shows a representative profile of Gal-1 binding, the lower graph shows means (±SEM) of the mean fluorescence intensity (MFI) values of activated SLE T cells. Statistical analysis was performed using a two-tailed pairedt-test. *p<0.05,n=3.
3. Discussion
Selected steps of mammalian N linked glycosylation and lectin binding to specific sugar side chains are summarized in Figure S1. It must be noted that binding of the used lectins was more degenerated than what is shown in the simplified Figure S1; however, it may help in a better apprehension of this work.
Remarkable differences were detected in ConA, LCA, and WGA binding between resting SLE and control T cells, since SLE T cells bound significantly higher amounts of these lectins. As LCA and WGA recognize matured sugar side chains and ConA couples both unmatured (early) and matured (complex) glycans, these results indicated that resting SLE T cells present a glycan structure similar to their activated phenotype. Detection of other activation markers, such as heightened CD40L expression [34], CD44 expression [35–37], exhibition of constant membrane raft polarization and increased GM1 content [38], measured by others, also suggest similarity to an activated state. On the other hand, this activated phenotype did not manifest in terms of CD25 expression on resting SLE T cells, as CD25 levels were similar on resting and activated T cells, suggesting that the activated phenotype is limited to several, but not all activation markers (Figure S3).
Stimulation of control T cells with PHA-L resulted in an elevation of binding of all used lectins, except the terminalα-2,6 sialic acid binding SNA (data not shown), indicating a generally increased complexity of glycosylation pattern upon activation. These results were in accordance with previous findings, arguing that N-glycan abundance, branching, glycan chain elongation, and hereby complexity enhanced [39,40], and terminalα-2,6 sialic acid residues declined [41–43] on freshly activated T cells.
However, the increase in glycan complexity after activation was hardly seen in SLE T cells, as an increase in lectin binding upon activation was rather low or was absent in SLE, a phenomenon that is also explained by the activated phenotype of SLE T cells, even without treatment with activating agents. Furthermore, the decreased Gal-1 binding of SLE T cells was observed, not only in resting state, but also persisting after activation. No difference was found between CD4+and CD4- (CD8) cells in terms of binding of any of the lectins (Figure S2). Some previous findings indicate that the proportion of effector memory (C-C Motif Chemokine Receptor 7{CCR7}-CD27+) and terminally
Int. J. Mol. Sci.2019,20, 4455 7 of 14
differentiated effector memory (CCR7-CD27-) cells increase in SLE, and may correlate with disease activity or damage [44,45]. It would be interesting to compare the cell surface glycosylation patterns of naive and various subtypes of memory T cells; however, it was outside the scope of our present study.
It is also to be noted that SLE memory effector T cells are crippled in response to antigen stimulation, as they respond to stimulation with apoptosis instead of proliferation [45], which might be a consequence of the altered glycosylation.
Variation in the binding of lectins tested was only confined to Gal-1, whose binding is determined by the presence of asialylated terminal N-acetyl lactose residues [46]. To clarify the background of this specific variability of Gal-1 binding, the expression of enzymes involved in creating the glycosylation pattern was determined. Analysis of the mRNA expression of glycosylation enzymes was chosen, since previous data indicated that glycosylation was primarily regulated at the transcriptional level of the appropriate enzymes [31]. Expressions of glycosyltransferases, alpha mannosidases, beta-N-acetylglucosaminetransferases, sialytransferases, and a neuraminidase,NEU1, were similar in control and SLE T cells. These findings are in accordance with the results of lectin assays, as all lectins tested bound similarly to the activated control and autoimmune T cells, with the exception ofGal-1.
The difference in Gal-1 binding between control and patient activated T cells might therefore result from the distinct sialylation of the Gal-1 binding glycoconjugates. This presumption seemed to be supported by the finding that ratios of the expression of sialyltransferases (ST3GAL6andST6GAL1) and neuraminidase shifted towards the sialytransferases, indicating a more intensified sialylation of SLE T cell glycans, including Gal-1 binding structures. Sialylation plays an important role in masking terminal carbohydrate chains, hence regulating lectin binding and signal transduction processes.
Sialyltransferases attach, while neuraminidases remove sialic acid residues of terminal carbohydrate groups. Consequently, the accessibility of lectin binding sites is specifically regulated by the concerted action of sialyltransferases and neuraminidases. This point of view was supported with the finding, that ablation of sialic acid from surface glycoconjugates of living activated SLE T cells by neuraminidase treatment resulted in an increase in Gal-1 binding.
An important issue is how glycosylation affects autoimmune T cell activation, cell–cell interactions and autoantibody production. The available literature data are limited, and further detailed investigation is required. However, several studies suggest that pathological glycosylation results in disturbed T cell receptor (TCR)-major histocompatibility complex (MHC) interactions [38], cell adhesion [40], necrotic cell death- and glycan-specific autoantibody production [47], and deviant antigen presentation [48,49]. How closely the pathomechanism of SLE is associated with the surface glycosylation pattern and its abnormalities remains to be elucidated. Nevertheless, the present findings seem to corroborate our hypothesis regarding the resistance of activated SLE T cells to the apoptotic effects of Gal-1. As we described earlier [20], activated SLE T cells showed a reduced response to Gal-1 due to their defective expression of intracellular Gal-1. The present work suggests that altered glycosylation and, hence, the decreased binding of extracellular Gal-1 to SLE T cells can be another cause of the resistance to Gal-1-mediated immunomodulation, serving a putative novel pathogenic mechanism in SLE. It has to also be clarified whether removal of sialic acid from cell surface glycoconjugates results in the restoration of Gal-1-induced apoptotic sensitivity. Nevertheless, it has become clear from this work that analyzing the glycosylation process, especially the expression ratio of sialyltransferases and the neuraminidases and the binding of Gal-1 to the cell surface, may emerge as a novel approach to connecting disease phenotypes with functional pathways within T cells (differential-diagnosis of diseases or patient subset analysis within particular multisystem autoimmune diseases).
Since SLE is an autoimmune disease with multiple alterations on genetic, protein, signaling, and glycosylation levels, it is difficult to determine the primary cause of the disorder. It is likely that all the more-or-less relational changes result in the final manifestation of SLE. As glycosylation affects cell migration, adhesion, and signal transduction, its changes must be an important factor contributing to the pathomechanism of the disease. This view is supported by the finding that the binding of Gal-1
Int. J. Mol. Sci.2019,20, 4455 8 of 14
to SLE T cells, an anti-inflammatory human lectin, decreases because of the different sialylation of SLE T cells from that of healthy T cells, and thus it must be another reason that SLE T cells are more resistant to Gal-1-induced apoptosis [20].
The glycosylation phenotype resembles an activated state of SLE T cells. Though the fundamental causes behind the development of SLE are unclear, it is known that alpha-mannosidase II knock out mice develop an SLE-like disease [50]. This enzyme removes early mannose from maturing glycoconjugates, therefore, it is crucial to the final formation of healthy complex N-glycan structures observed in mammals. Its deficiency leads to immature, mannose-rich glycan chains being upregulated because of a disruption in their stepwise disassembly before the complex chain can be built in their place [51].
This effect is similar to our findings indicating a higher-than-normal distribution of mannose-rich glycans on SLE T cells before activation. It is known that mannose-rich chains are much more common on many strains of fungi and are easily recognized as non-self structures leading to auto-immune reactions [50].
Altered glycosylation in SLE is not confined to T cells, as the glycan profile of IgG is a primary predictor of the inflammatory capability of the molecule. Asialylated, agalactosylated glycan chains are stronger activators of complement than sialylated chains, and as such, pro-inflammatory responses are upregulated by the IgG molecule if it contains less terminal syalic acid units [5].
Altogether, the above data indicate that alteration in glycosylation in SLE is likely to be a primary phenomenon, and it contributes to the pathomechanism of the disease.
To our knowledge, the current work provides the first evidence for altered T cell surface glycosylation in SLE. Our major findings are that resting SLE T cells show an activated phenotype from the glycosylation point of view and lectin binding of activated SLE T cells is similar to the controls, with exception of the significantly lower Gal-1 binding. Furthermore, this is a consequence of a shift toward terminal sialylation of glycan structures due to an increasedST6GAL1/NEU1and/orST3GAL6/NEU1 ratio. Indeed, desialylation of the surface glycans on SLE T cells results in a remarkable increase in Gal-1 binding.
4. Materials and Methods
4.1. Ethical Statement
The study was designed in accordance with the guidelines of the Declaration of Helsinki and was approved by the Human Investigation Review Board, University of Szeged reference, No. 2833/2011 on 21 February 2011.
4.2. Patients
Patients with SLE (n=18) and healthy controls (n=19) were examined, except in one experiment wheren=3 (Figure3). All patients met the 2012 SLICC classification criteria for SLE [52,53] and had active disease, as reflected by relevant disease activity indices. Eligible patients had an SLE Disease Activity-Index-2000 (SLEDAI-2K)≥6 [54], did not have a co-existent inflammatory condition (overlapping autoimmune disease or infection), and did not have diabetes mellitus. Treatment with potent immunosuppressive drugs (mycophenolate mofetil, cyclophosphamide, rituximab) or corticosteroid at a dose>5 mg prednisolone equivalent was also an exclusion criterion. Controls were healthy individuals without any inflammatory disease or diabetes mellitus.
Demographics and the relevant disease activity data are presented in Table3.
Int. J. Mol. Sci.2019,20, 4455 9 of 14
Table 3. Demographics and disease activity parameters. Numbers before and in brackets indicate mean and range, respectively. SLEDAI-2K: SLE Disease Activity-Index-2000, anti-dsDNA: antibody to double-stranded DNA.
Subject Characteristics Age Female/Male Disease Activity Parameter
SLE 42 (23–54) 17/1
SLEDAI-2K 14 (6–30)
anti-dsDNA (IU/mL) 88 (2–220)
Control 54 (31–75) 17/2
4.3. Cells
Peripheral blood mononuclear cells (PBMC) were isolated from SLE patients and healthy donors using Ficoll (GE Healthcare, Amersham, UK) gradient centrifugation. A part of the PBMCs was stimulated with 1µg/mL phytohaemagglutinin-L (PHA-L, Sigma-Aldrich, St. Louis, MO, USA) and the cells were cultured for 72 h in a humidified incubator with 5% CO2 at 37◦C in Roswell Park Memorial Institute (RPMI)-1640 medium (Gibco, Life Technologies, Paisley, UK) supplemented with 10% fetal bovine serum (FBS) (Gibco, Life Technologies, Paisley, UK), 2 mM L-glutamine (Gibco, Life Technologies, Paisley, UK) and penicillin-streptomycin (Sigma-Aldrich, St. Louis, MO, USA), henceforward referred to as activated T cells. Activated T cell cultures were>90% pure, as controlled with flow cytometry using anti-human CD3 antibody (BioLegend, San Diego, CA, USA) (data not shown).
4.4. Lectin Binding Assay
Resting or activated T cells were washed twice with cold phosphate buffered saline (PBS) and incubated at 4 ◦C for 30 min with eFluor 660 fixable viability dye (eBioscience, Thermo Fisher Scientific, Waltham, MA, USA), then fixed with 4% paraformaldehyde for 4 min at room temperature.
After washing the samples twice in PBS supplemented with 1% FBS and 0.1% sodium-azide (fluorescence-activated cell sorting (FACS) buffer), the cells were incubated at 4◦C for 20 min with fluorescein-labeled lectins or unlabeled Gal-1 (lectins used are listed in Table1). The fluorescein-labeled plant lectin kit (Vector Laboratories, Burlingame, CA, USA) was used according to the manufacturer’s instructions. Recombinant galectin-1 was produced and characterized in our laboratory, as previously described [15]. Gal-1-binding was detected as follows: after washing with FACS buffer, biotinylated mouse monoclonal antibody to Gal-1 (2C1/6) was added and incubated at 4◦C for 45 min. Samples were washed with cold FACS buffer before adding fluorescein isothiocyanate(FITC)-labeled streptavidin and incubating the cells at 4◦C for 20 min. Finally, the samples were washed twice in FACS buffer.
Samples were analyzed with a FACSCalibur system (BD Biosciences, Franklin Lakes, NJ, USA) and data were evaluated using FlowJo V10 software (BD Biosciences, Franklin Lakes, NJ, USA). The lectin binding was evaluated on resting T cells within PBMCs or activated T cells by gating CD3+cells with PE/Cy5-conjugated anti-human CD3 antibody (BioLegend, San Diego, CA, USA).
4.5. Neuraminidase Treatment
Activated T cells (2×10⁶/sample) were treated withα2-3,6,8 neuraminidase (α2-3,6,8 Neu, New England BioLabs, Ipswich, MA, USA) according to the manufacturer’s instructions or left untreated.
Briefly, the cells were washed with PBS then incubated with 200 U ofα2-3,6,8Neu in a total volume of 40µL glycobuffer (provided by the manufacturer) for 15 min at 37◦C. After washing the samples with cold PBS, Gal-1 binding, viability staining, fixation, and flow cytometry analysis were done, as described above.
Int. J. Mol. Sci.2019,20, 4455 10 of 14
4.6. Quantitative Real-Time PCR (qPCR)
The qPCR assays were performed according to the MIQE (Minimum Information for Publication of Quantitative Real-Time PCR Experiments) guidelines [55]. The names of genes are listed in Table2. Total RNA was extracted from activated T cells (1–3×10⁶cells) using PerfectPure RNA Cultured Cell kit (5 PRIME, Gaithersburg, MD, USA) according to the manufacturer’s instructions with on-column DNase digestion. The amount and quality of RNA were measured using NanoDrop-1000 spectrophotometer (Thermo Fisher Scientific, Waltham, MA, USA). For cDNA synthesis, 2µg of total RNA/reaction was reverse transcribed using RevertAid H Minus First Strand cDNA Synthesis Kit (Thermo Fisher Scientific, Waltham, MA, USA) in the presence of 1.66µM of oligo (dT) 18 and random hexamer primers, 0.5 mMdNTP, 10 U RiboLock RNase Inhibitor, and 200 U RevertAid H Minus Reverse Transcriptase for 60 min at 42◦C, then heated for 10 min at 70◦C. Quantitative PCR amplifications were carried out with appropriate negative controls at least in duplicate. The reaction volume was 20µL and composed of AccuPower 2×Greenstar qPCR Master Mix (Bioneer, Alameda, CA, USA), 300–300 nM primers, and 40-fold diluted cDNA. For PCR amplifications, RotoGene3000 instrument (Corbett Research, Sydney, Australia) was used. The qPCR program included: initial 95◦C for 15 min, followed by repeated 45 cycles (95◦C for 15 s, 60–62◦C for 20 s, 72◦C for 20 s), and melting temperature analysis increasing the temperature from 55◦C to 98◦C at 0. 5◦C/step with 8 sec stops between each step. Quantitative real-time PCR data were analyzed using the Rotor Gene software (v6.1 build 93).
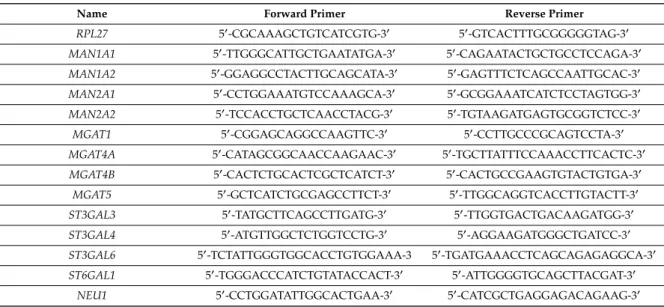
Relative mRNA levels, normalized toRPL27, were presented as log2transformation of relative gene expression, namely subtraction of Ct values (∆Ct=CtRPL27−CtGOI). The mRNA expression ratios were calculated using the following formula: ∆Ct×gene−∆CtY gene. Primer sequences were partly taken from [56–59], or designed using the Universal Probe Library Assay Design program (Roche Applied Science, Basel, Switzerland). Primer sequences used in the study are shown in Table4.
Table 4.Primer sequences used in the study for the mRNA amplification of glycosylation enzymes.
Name Forward Primer Reverse Primer
RPL27 50-CGCAAAGCTGTCATCGTG-30 50-GTCACTTTGCGGGGGTAG-30
MAN1A1 50-TTGGGCATTGCTGAATATGA-30 50-CAGAATACTGCTGCCTCCAGA-30 MAN1A2 50-GGAGGCCTACTTGCAGCATA-30 50-GAGTTTCTCAGCCAATTGCAC-30 MAN2A1 50-CCTGGAAATGTCCAAAGCA-30 50-GCGGAAATCATCTCCTAGTGG-30 MAN2A2 50-TCCACCTGCTCAACCTACG-30 50-TGTAAGATGAGTGCGGTCTCC-30
MGAT1 50-CGGAGCAGGCCAAGTTC-30 50-CCTTGCCCGCAGTCCTA-30
MGAT4A 50-CATAGCGGCAACCAAGAAC-30 50-TGCTTATTTCCAAACCTTCACTC-30 MGAT4B 50-CACTCTGCACTCGCTCATCT-30 50-CACTGCCGAAGTGTACTGTGA-30
MGAT5 50-GCTCATCTGCGAGCCTTCT-30 50-TTGGCAGGTCACCTTGTACTT-30 ST3GAL3 50-TATGCTTCAGCCTTGATG-30 50-TTGGTGACTGACAAGATGG-30
ST3GAL4 50-ATGTTGGCTCTGGTCCTG-30 50-AGGAAGATGGGCTGATCC-30
ST3GAL6 50-TCTATTGGGTGGCACCTGTGGAAA-3 50-TGATGAAACCTCAGCAGAGAGGCA-30 ST6GAL1 50-TGGGACCCATCTGTATACCACT-30 50-ATTGGGGTGCAGCTTACGAT-30
NEU1 50-CCTGGATATTGGCACTGAA-30 50-CATCGCTGAGGAGACAGAAG-30
4.7. Statistical Analysis
Statistical analysis was performed using GraphPad Prism Version 7.01. In all statistical analyses, an unpaired, two-tailedt-test was used to compare data obtained in T cells of healthy controls and SLE patients. There was only one exception (Figure4B), where paired two-tailed Student’st-test was chosen for the comparison of values from T cells of the same patient with or without neuraminidase treatment. The significant differences were indicated as follows: *p<0.05, **p<0.01, ***p<0.001.
Supplementary Materials: Supplementary materials can be found athttp://www.mdpi.com/1422-0067/20/18/
4455/s1.
Int. J. Mol. Sci.2019,20, 4455 11 of 14
Author Contributions:Conceptualization:É.M.,Á.C., L.K.; methodology:É.M.,Á.C., E.S.,Á.H., M.B.; software:
E.S.,Á.H.; validation:Á.C.,É.M.; formal analysis: E.S.,Á.H.,Á.C.; investigation: M.B., L.K.; resources:É.M.,Á.C., L.K.; data curation:Á.H.,Á.C.; writing—original draft preparation: E.S.,Á.H.; writing—review and editing:Á.C., É.M., L.K.; visualization: E.S.; supervision:É.M., L.K.; project administration:Á.C.; funding acquisition:É.M., L.K.
Funding: This research was funded by GINOP 2.2.1-15-2016-00007 and by a research grant of the Faculty of Medicine, University of Szeged No IV-3606-222/b-10/2017.
Acknowledgments:The authors would like to thank Andrea Gercsófor excellent technical assistance, and Edit Kotogány for flow cytometric analysis. We thankÁgnes Zvara for discussions about gene expression data analysis and LászlóPuskás for the access to the Rotogene3000 instrument.
Conflicts of Interest:The authors declare no conflict of interest.
Abbreviations
SLE Systemic lupus erythematosus
Gal-1 Galectin-1
NEU Neuraminidase
ConA Concanavalin-A
LCA Lens culinarisagglutinin
WGA Wheat germ agglutinin
PHA phytohaemagglutinin
PHA-L Phaseolus vulgarisleukoagglutinin
SNA Sambucus nigraagglutinin
MFI Median fluorescence intensity
MGAT1–5- Beta-N acetylglucosaminyltransferases
MAN Mannosidase
MGAT N-Acetyl glucosaminyltransferase
ST Sialyltransferase
SLEDAI-2K SLE disease activity index-2000 Anti-dsDNA Antibody to double-stranded DNA PBMC Peripheral blood mononuclear cell
PBS Phosphate buffered saline
FACS Fluorescence-activated cell sorting
References
1. Chachadi, V.B.; Cheng, H.; Klinkebiel, D.; Christman, J.K.; Cheng, P.W. 5-Aza-20-deoxycytidine increases sialyl Lewis X on MUC1 by stimulatingβ-galactoside:α2,3-sialyltransferase 6 gene.Int. J. Biochem. Cell Biol.
2011,43, 586–593. [CrossRef] [PubMed]
2. Stowell, S.R.; Ju, T.; Cummings, R.D. Protein glycosylation in cancer.Annu. Rev. Pathol.2015,10, 473–510.
[CrossRef] [PubMed]
3. Axford, J.S. Glycosylation and rheumatic disease.Biochim. Biophys. Acta-Mol. Basis Dis.1999,1455, 219–229.
[CrossRef]
4. Mackiewicz, A.; Mackiewicz, K. Glycoforms of serum alpha 1-acid glycoprotein as markers of inflammation and cancer.Glycoconj. J.1995,12, 241–247. [CrossRef]
5. Sell, S. Progress in pathology cancer-associated carbohydrates identified by monoclonal antibodies.Hum.
Pathol.1990,21, 1003–1019. [CrossRef]
6. Gudelj, I.; Lauc, G.; Pezer, M. Immunoglobulin G glycosylation in aging and diseases.Cell. Immunol.2018, 333, 65–79. [CrossRef] [PubMed]
7. Arnold, J.N.; Wormald, M.R.; Sim, R.B.; Rudd, P.M.; Dwek, R.A. The impact of glycosylation on the biological function and structure of human immunoglobulins.Annu. Rev. Immunol.2007,25, 21–50. [CrossRef]
8. Maverakis, E.; Kim, K.; Shimoda, M.; Gershwin, M.E.; Patel, F.; Wilken, R.; Raychaudhuri, S.; Ruhaak, L.R.;
Lebrilla, C.B. Glycans in the immune system and the altered glycan theory of autoimmunity: A critical review.J. Autoimmun.2015,57, 1–13. [CrossRef]
Int. J. Mol. Sci.2019,20, 4455 12 of 14
9. Hauser, M.A.; Kindinger, I.; Laufer, J.M.; Späte, A.-K.; Bucher, D.; Vanes, S.L.; Krueger, W.A.; Wittmann, V.;
Legler, D.F. Distinct CCR7 glycosylation pattern shapes receptor signaling and endocytosis to modulate chemotactic responses.J. Leukoc. Biol.2016,99, 993–1007. [CrossRef]
10. Toscano, M.A.; Bianco, G.A.; Ilarregui, J.M.; Croci, D.O.; Correale, J.; Hernandez, J.D.; Zwirner, N.W.;
Poirier, F.; Riley, E.M.; Baum, L.G.; et al. Differential glycosylation of TH1, TH2 and TH-17 effector cells selectively regulates susceptibility to cell death.Nat. Immunol.2007,8, 825–834. [CrossRef]
11. Bieberich, E. Synthesis, Processing, and Function of N-glycans in N-glycoproteins.Adv. Neurobiol.2014,9, 47–70. [PubMed]
12. Camby, I.; Le Mercier, M.; Lefranc, F.; Kiss, R. Galectin-1: A small protein with major functions.Glycobiology 2006,16, 137R–157R. [CrossRef] [PubMed]
13. Garin, M.I.; Chu, C.-C.; Golshayan, D.; Cernuda-Morollon, E.; Wait, R.; Lechler, R.I. Galectin-1: A key effector of regulation mediated by CD4+CD25+T cells.Blood2007,109, 2058–2065. [CrossRef] [PubMed]
14. Motran, C.C.; Molinder, K.M.; Liu, S.D.; Poirier, F.; Miceli, M.C. Galectin-1 functions as a {Th}2 cytokine that selectively induces {Th}1 apoptosis and promotes {Th}2 function.Eur. J. Immunol.2008,38, 3015–3027.
[CrossRef] [PubMed]
15. Ion, G.; Fajka-Boja, R.; Tóth, G.K.; Caron, M.; Monostori,É. Role of p56lck and ZAP70-mediated tyrosine phosphorylation in galectin-1-induced cell death.Cell Death Differ.2005,12, 1145–1147. [CrossRef]
16. Ion, G.; Fajka-Boja, R.; Kovács, F.; Szebeni, G.; Gombos, I.; Czibula,Á.; Matkó, J.; Monostori,É. Acid sphingomyelinase mediated release of ceramide is essential to trigger the mitochondrial pathway of apoptosis by galectin-1.Cell Signal.2006,18, 1887–1896. [CrossRef] [PubMed]
17. Kovács-Sólyom, F.; Blaskó, A.; Fajka-Boja, R.; Katona, R.L.; Végh, L.; Novák, J.; Szebeni, G.J.; Krenács, L.;
Uher, F.; Tubak, V.; et al. Mechanism of tumor cell-induced T-cell apoptosis mediated by galectin-1.Immunol.
Lett.2010,127, 108–118. [CrossRef]
18. Blaskó, A.; Fajka-Boja, R.; Ion, G.; Monostori,É. How does it act when soluble? Critical evaluation of mechanism of galectin-1 induced T-cell apoptosis.Acta Biol. Hung.2011,62, 106–111. [CrossRef]
19. Novák, J.; Kriston-Pál,É.; Czibula,Á.; Deák, M.; Kovács, L.; Monostori,É.; Fajka-Boja, R. GM1 controlled lateral segregation of tyrosine kinase Lck predispose T-cells to cell-derived galectin-1-induced apoptosis.
Mol. Immunol.2014,57, 302–309. [CrossRef]
20. Cabrera, P.V.; Amano, M.; Mitoma, J.; Chan, J.; Said, J.; Fukuda, M.; Baum, L.G. Haploinsufficiency of C2GnT-I glycosyltransferase renders T lymphoma cells resistant to cell death.Blood2006,108, 2399–2406.
[CrossRef]
21. Deák, M.; Hornung,Á.; Novák, J.; Demydenko, D.; Szabó, E.; Czibula,Á.; Fajka-Boja, R.; Kriston-Pál,É.;
Monostori,É.; Kovács, L. Novel role for galectin-1 in T-cells under physiological and pathological conditions.
Immunobiology2015,220, 483–489. [CrossRef] [PubMed]
22. Cummings, R.D.; Etzler, M.E.Essentials of Glycobiology; Varki, A., Cummings, R.D., Esko, J.D., Eds.; Cold Spring Harbor Laboratory Press: Cold Spring Harbor, NY, USA, 2009.
23. Maupin, K.A.; Liden, D.; Haab, B.B. The fine specificity of mannose-binding and galactose-binding lectins revealed using outlier motif analysis of glycan array data. Glycobiology2012, 22, 160–169. [CrossRef]
[PubMed]
24. Tateno, H.; Nakamura-Tsuruta, S.; Hirabayashi, J. Comparative analysis of core-fucose-binding lectins from Lens culinaris and Pisumsativum using frontal affinity chromatography. Glycobiology2009,19, 527–536.
[CrossRef] [PubMed]
25. Peters, B.P.; Goldstein, I.J.; Flashner, M.; Ebisu, S. Interaction of Wheat Germ Agglutinin with Sialic Acid.
Biochemistry1979,18, 5505–5511. [CrossRef] [PubMed]
26. Gladman, D.D.; Ibanez, D.; Urowitz, M.B. Systemic lupus erythematosus disease activity index 2000.
J. Rheumatol.2002,29, 288–291. [PubMed]
27. Schwarz, R.E.; Wojciechowicz, D.C.; Park, P.Y.; Paty, P.B. Phytohemagglutinin-L (PHA-L) lectin surface binding of N-linkedβ1-6 carbohydrate and its relationship to activated mutant ras in human pancreatic cancer cell-lines.Cancer Lett.1996,107, 285–291. [CrossRef]
28. Fischer, E.; Brossmer, R. Sialic acid-binding lectins: Submolecular specificity and interaction with sialoglycoproteins and tumour cells.Glycoconj. J.1995,12, 707–713. [CrossRef] [PubMed]
Int. J. Mol. Sci.2019,20, 4455 13 of 14
29. Itakura, Y.; Nakamura-Tsuruta, S.; Kominami, J.; Tateno, H.; Hirabayashi, J. Sugar-binding profiles of chitin-binding lectins from the hevein family: A comprehensive study. Int. J. Mol. Sci. 2017,18, 1160.
[CrossRef] [PubMed]
30. Pothukuchi, P.; Agliarulo, I.; Russo, D.; Rizzo, R.; Russo, F.; Parashuraman, S. Translation of genome to glycome: Role of the Golgi apparatus.FEBS Lett.2019. [CrossRef]
31. Comelli, E.M.; Head, S.R.; Gilmartin, T.; Whisenant, T.; Haslam, S.M.; North, S.J.; Wong, N.K.; Kudo, T.;
Narimatsu, H.; Esko, J.D.; et al. A focused microarray approach to functional glycomics: Transcriptional regulation of the glycome.Glycobiology2006,16, 117–131. [CrossRef]
32. Nairn, A.V.; York, W.S.; Harris, K.; Hall, E.M.; Pierce, J.M.; Moremen, K.W. Regulation of glycan structures in animal tissues.J. Biol. Chem.2008,283, 17298–17313. [CrossRef] [PubMed]
33. Altheide, T.K.; Hayakawa, T.; Mikkelsen, T.S.; Diaz, S.; Varki, N.; Varki, A. System-wide genomic and biochemical comparisons of sialic acid biology among primates and rodents. J. Biol. Chem. 2006, 281, 25689–25702. [CrossRef] [PubMed]
34. Nan, X.; Carubelli, I.; Stamatos, N.M. Sialidase expression in activated human T lymphocytes influences production of IFN-γ.J. Leukoc. Biol.2007,81, 284–296. [CrossRef] [PubMed]
35. Katsiari, C.G.; Liossis, S.N.C.; Dimopoulos, A.M.; Charalambopoulos, D.V.; Mavrikakis, M.; Sfikakis, P.P.
CD40L overexpression on T cells and monocytes from patients with systemic lupus erythematosus is resistant to calcineurin inhibition.Lupus2002,11, 370–378. [CrossRef] [PubMed]
36. Lesley, J. CD44 structure and function.Front. Biosci.2016,3, 616–630. [CrossRef]
37. Guan, H.; Nagarkatti, P.S.; Nagarkatti, M. Role of CD44 in the differentiation of Th1 and Th2 cells:
CD44-deficiency enhances the development of Th2 effectors in response to sheep RBC and chicken ovalbumin.
J. Immunol.2009,183, 172–180. [CrossRef] [PubMed]
38. Li, Y.; Harada, T.; Juang, Y.-T.; Kyttaris, V.C.; Wang, Y.; Zidanic, M.; Tung, K.; Tsokos, G.C. Phosphorylated ERM Is Responsible for Increased T Cell Polarization, Adhesion, and Migration in Patients with Systemic Lupus Erythematosus.J. Immunol.2007,178, 1938–1947. [CrossRef]
39. Jury, E.C.; Flores-Borja, F.; Kabouridis, P.S. Lipid rafts in T cell signalling and disease.Semin. Cell Dev. Biol.
2007,18, 608–615. [CrossRef]
40. Shental-Bechor, D.; Levy, Y. Effect of glycosylation on protein folding: A close look at thermodynamic stabilization.Proc. Natl. Acad. Sci. USA2008,105, 8256–8261. [CrossRef]
41. Polley, A.; Orłowski, A.; Danne, R.; Gurtovenko, A.A.; Bernardino de la Serna, J.; Eggeling, C.; Davis, S.J.;
Róg, T.; Vattulainen, I. Glycosylation and Lipids Working in Concert Direct CD2 Ectodomain Orientation and Presentation.J. Phys. Chem. Lett.2017,8, 1060–1066. [CrossRef]
42. Chen, H.-L.; Li, C.F.; Grigorian, A.; Tian, W.; Demetriou, M. T cell receptor signaling co-regulates multiple Golgi genes to enhance N-glycan branching.J. Biol. Chem.2009,284, 32454–32461. [CrossRef] [PubMed]
43. Hernandez, J.D.; Klein, J.; Van Dyken, S.J.; Marth, J.D.; Baum, L.G. T-cell activation results in microheterogeneous changes in glycosylation of CD45. Int. Immunol. 2007, 19, 847–856. [CrossRef]
[PubMed]
44. Comelli, E.M.; Sutton-Smith, M.; Yan, Q.; Amado, M.; Panico, M.; Gilmartin, T.; Whisenant, T.; Lanigan, C.M.;
Head, S.R.; Goldberg, D.; et al. Activation of murine CD4+and CD8+T lymphocytes leads to dramatic remodeling of N-linked glycans.J. Immunol.2006,177, 2431–2440. [CrossRef] [PubMed]
45. Piantoni, S.; Regola, F.; Zanola, A.; Andreoli, L.; Dall’Ara, F.; Tincani, A.; Airo’, P. Effector T-cells are expanded in systemic lupus erythematosus patients with highdisease activity and damage indexes.Lupus2018,27, 143–149. [CrossRef] [PubMed]
46. Fritsch, R.D.; Shen, X.; Illei, G.G.; Yarboro, C.H.; Prussin, C.; Hathcock, K.S.; Hodes, R.J.; Lipsky, P.E.
Abnormal differentiation of memory T cells in systemic lupus erythematosus. Arthritis Rheum. 2006,54, 2184–2197. [CrossRef] [PubMed]
47. Stowell, S.R.; Arthur, C.M.; Mehta, P.; Slanina, K.A.; Blixt, O.; Leffler, H.; Smith, D.F.; Cummings, R.D.
Galectin-1, -2, and -3 exhibit differential recognition of sialylatedglycans and blood group antigens.J. Biol.
Chem.2008,283, 10109–10123. [CrossRef] [PubMed]
48. Dotan, N.; Altstock, R.T.; Schwarz, M.; Dukler, A. Anti-glycan antibodies as biomarkers for diagnosis and prognosis.Lupus2006,15, 442–450. [CrossRef]
49. Harding, C.V.; Kihlberg, J.; Elofsson, M.; Magnusson, G.; Unanue, E.R. Glycopeptides bind MHC molecules and elicit specific T cell responses.J. Immunol.1993,151, 2419.
Int. J. Mol. Sci.2019,20, 4455 14 of 14
50. Jensen, T.; Hansen, P.; Galli-Stampino, L.; Mouritsen, S.; Frische, K.; Meinjohanns, E.; Meldal, M.; Werdelin, O.
Glycopeptide specific T cell hybridomas raised against an αGalNAc O-glycosylated self peptide are discriminating between highly related carbohydrate groups.Immunol. Lett.1997,56, 449. [CrossRef]
51. Green, R.S.; Stone, E.L.; Tenno, M.; Lehtonen, E.; Farquhar, M.G.; Marth, J.D. Mammalian N-Glycan branching protects against innate immune self-recognition and inflammation in autoimmune disease pathogenesis.
Immunity2007,27, 308–320. [CrossRef]
52. Moremen, K.W. Golgi alpha-mannosidase II deficiency in vertebrate systems: Implications for asparagine-linked oligosaccharide processing in mammals. Biochim. Biophys. Acta2002, 1573, 225–235.
[CrossRef]
53. Hochberg, M.C. Updating the American college of rheumatology revised criteria for the classification of systemic lupus erythematosus.Arthritis Rheum.1997,40, 1725. [CrossRef] [PubMed]
54. Petri, M.; Orbai, A.-M.; Alarcon, G.S.; Gordon, C.; Merrill, J.T.; Fortin, P.R.; Bruce, I.N.; Isenberg, D.;
Wallace, D.J.; Nived, O.; et al. Derivation and validation of the Systemic Lupus International Collaborating Clinics classification criteria for systemic lupus erythematosus. Arthritis Rheum. 2012, 64, 2677–2686.
[CrossRef] [PubMed]
55. Rabinovich, G.A.; Ramhorst, R.E.; Rubinstein, N.; Corigliano, A.; Daroqui, M.C.; Kier-Joffé, E.B.; Fainboim, L.
Induction of allogenic T-cell hyporesponsiveness by galectin-1-mediated apoptotic and non-apoptotic mechanisms.Cell Death Differ.2002,9, 661–670. [CrossRef] [PubMed]
56. Bustin, S.A.; Benes, V.; Garson, J.A.; Hellemans, J.; Huggett, J.; Kubista, M.; Mueller, R.; Nolan, T.; Pfaffl, M.W.;
Shipley, G.L.; et al. The MIQE guidelines: Minimum information for publication of quantitative real-time PCR experiments.Clin. Chem.2009,55, 611–622. [CrossRef] [PubMed]
57. Ma, H.; Zhou, H.; Song, X.; Shi, S.; Zhang, J.; Jia, L. Modification of sialylation is associated with multidrug resistance in human acute myeloid leukemia.Oncogene2015,34, 726–740. [CrossRef] [PubMed]
58. Tringali, C.; Lupo, B.; Cirillo, F.; Papini, N.; Anastasia, L.; Lamorte, G.; Colombi, P.; Bresciani, R.; Monti, E.;
Tettamanti, G.; et al. Silencing of membrane-associated sialidaseNEU3diminishes apoptosis resistance and triggers megakaryocytic differentiation of chronic myeloid leukemic cells K562 through the increase of ganglioside GM3.Cell Death Differ.2009,16, 164–174. [CrossRef]
59. Zhou, H.; Ma, H.; Wei, W.; Ji, D.; Song, X.; Sun, J.; Zhang, J.; Jia, L. B4GALT family mediates the multidrug resistance of human leukemia cells by regulating the hedgehog pathway and the expression of p-glycoprotein and multidrug resistance-associated protein 1.Cell Death Dis.2013,4, e654. [CrossRef]
©2019 by the authors. Licensee MDPI, Basel, Switzerland. This article is an open access article distributed under the terms and conditions of the Creative Commons Attribution (CC BY) license (http://creativecommons.org/licenses/by/4.0/).