Citation:Benk˝o, E.; Iliˇc, I.G.; Kristó, K.; Regdon, G., Jr.; Csóka, I.;
Pintye-Hódi, K.; Srˇciˇc, S.; Sovány, T.
Predicting Drug Release Rate of Implantable Matrices and Better Understanding of the Underlying Mechanisms through Experimental Design and Artificial Neural Network-Based Modelling.
Pharmaceutics2022,14, 228.
https://doi.org/10.3390/
pharmaceutics14020228 Academic Editor: Alyssa Panitch Received: 2 December 2021 Accepted: 14 January 2022 Published: 19 January 2022 Publisher’s Note:MDPI stays neutral with regard to jurisdictional claims in published maps and institutional affil- iations.
Copyright: © 2022 by the authors.
Licensee MDPI, Basel, Switzerland.
This article is an open access article distributed under the terms and conditions of the Creative Commons Attribution (CC BY) license (https://
creativecommons.org/licenses/by/
4.0/).
pharmaceutics
Article
Predicting Drug Release Rate of Implantable Matrices and Better Understanding of the Underlying Mechanisms through Experimental Design and Artificial Neural
Network-Based Modelling
Ern ˝o Benk ˝o1, Ilija German Iliˇc2 , Katalin Kristó1 , Géza Regdon, Jr.1 , IldikóCsóka1 , Klára Pintye-Hódi1, Stane Srˇciˇc2and Tamás Sovány1,*
1 Institute of Pharmaceutical Technology and Regulatory Affairs, University of Szeged, Eötvös u. 6, H-6720 Szeged, Hungary; benko.erno.mate@egis.hu (E.B.); kristo.katalin@szte.hu (K.K.);
geza.regdon@pharm.u-szeged.hu (G.R.J.); csoka.ildiko@szte.hu (I.C.);
klara.hodi@pharm.u-szeged.hu (K.P.-H.)
2 Department of Pharmaceutical Technology, University of Ljubljana, Aškerˇceva cesta 7, SI-1000 Ljubljana, Slovenia; ilija.german.ilic@ffa.uni-lj.si (I.G.I.); stanko.srcic@ffa.uni-lj.si (S.S.)
* Correspondence: sovany.tamas@szte.hu; Tel.: +36-62545576
Abstract:There is a growing interest in implantable drug delivery systems (DDS) in pharmaceutical science. The aim of the present study is to investigate whether it is possible to customize drug release from implantable DDSs through drug–carrier interactions. Therefore, a series of chemically similar active ingredients (APIs) was mixed with different matrix-forming materials and was then compressed directly. Compression and dissolution interactions were examined by FT-IR spectroscopy.
Regarding the effect of the interactions on drug release kinetics, a custom-made dissolution device designed for implantable systems was used. The data obtained were used to construct models based on artificial neural networks (ANNs) to predict drug dissolution. FT-IR studies confirmed the presence of H-bond-based solid-state interactions that intensified during dissolution. These results confirmed our hypothesis that interactions could significantly affect both the release rate and the amount of the released drug. The efficiencies of the kinetic parameter-based and point-to-point ANN models were also compared, where the results showed that the point-to-point models better handled predictive inaccuracies and provided better overall predictive efficiency.
Keywords:drug–excipient interaction; polymers; nondegradable; matrix tablet; controlled release;
design of experiments; artificial neural networks
1. Introduction
Matrix tablets belong to the most popular systems for controlled delivery of drugs.
Drug liberation from porous matrices is a complex process, influenced by numerous param- eters such as solubility, matrix porosity [1], swelling [2] and gel formation [3] of polymers.
The gel properties are influenced by particle size [1,4] or by the molecular weight of poly- mers [5] and they generally determine the drug transport within the matrix, which may be diffusion-driven [2], relaxation-driven [6], external mass-transport-driven or anoma- lous [7]. Especially, the anomalous transport mechanism presupposes the presence of interparticle interactions within the system [5,7]. Novel achievements require the reconsid- eration of traditional thinking about inert excipients, and they turn the investigation and utilization of drug–excipient interactions into a focus of the development of tailored drug delivery systems.
Most of the polymers used as pharmaceutical excipients can form supramolecular conjugates [8], and the resulting H-bond-based, ionic drug excipient [9], or excipient–
excipient [10] interactions may provide an ideal way to customize drug release. The
Pharmaceutics2022,14, 228. https://doi.org/10.3390/pharmaceutics14020228 https://www.mdpi.com/journal/pharmaceutics
Pharmaceutics2022,14, 228 2 of 16
formation of supramolecular interactions is most likely in dissolution or melt-based pro- duction processes, but de Robertis et al. described the occurrence of similar interactions in directly compressed systems [11]. In our previous study, we examined the release of risedronate sodium from biodegradable and non-degradable implants. Although the slow- est release rate has been shown in low porosity non-degradable systems, unexpectedly prolonged, sustained release was observed in the degradable systems even after complete matrix disintegration. This was due to a strong H-bond-based interaction between rise- dronate sodium and chitosan, suggesting that the role and presence of intermolecular interactions in the drug release rate of directly compressed matrices could be significantly underestimated [12].
Therefore, the primary goal of the present study is to confirm the hypothesis that drug–
excipient interactions can be used to further prolong drug release from non-degradable matrices, while the strength of the interactions can be predicted based on the acid strength of the drugs.
To confirm the primary hypothesis, the original PVC matrix was combined with Eudragit of different grades as a model excipient, which allowed for the development of drug-binder interactions, which are mentioned as a favourable choice to produce controlled- release DDSs. Weak base Eudragit E100 and acidic Eudragit L100-55 are commonly used for oral administration, but recent reports [13–19] have investigated their applicability in parenteral drug administration. Following intramuscular administration of Eudragit-based nanoparticles, safety tests were performed [18] to examine liver and skeletal muscle damage during the 6-week experiment. Tissue samples from the liver were similar to the control group; skeletal muscle showed inflammation in the first week, which decreased by the second week; at the end of the experiment, it became similar to the control group as well.
In the case of intravenous microparticulate administration [13], only local inflammation was observed. Overall, the use of these materials as implantable excipients is considerable, especially because quaternerised Eudragit can facilitate paracellular API permeation at pH 7.4, which highlights the benefits of Eudragit copolymers.
A quality by design based approach was used to investigate the effect of critical material attributes on the mechanical properties of the matrices, the strength of the inter- action, and the drug release rate. Design of experiments (DoE) was used to reveal basic relationships, while artificial neural networks (ANN) were used for the prediction of drug dissolution of the designed matrices. ANNs are commonly used types of machine learn- ing/deep learning methods which mimic the signal transduction and learning mechanism of the human brain. ANNs can self-accommodate to the learning environment and are therefore widely applied for modelling of difficult nonlinear problems in a wide range of applications, including pharmaceutics. Previous studies [20,21] have demonstrated that ANNs are excellent tools for modelling the mechanical properties of tablets, whereas Galata et al. had successfully used ANNs to model drug release from hydrophilic, sustained- release matrix systems [22] by point-to-point modelling of drug release. Nevertheless, the question of how the developed network may be used for the modelling of general problems remained open. A secondary objective of the present study was to reveal if the tested material attributes will enable a generalized prediction of drug dissolution, and furthermore, another objective was to compare the efficiency of point-to-point modelling with another method where kinetic parameters (shape parameters of the dissolution curve) served as output variables.
2. Materials and Methods 2.1. Materials
Aceclofenac (ACE) was a kind gift from ExtractumPharma Ltd. (Budapest, Hungary), while diclofenac sodium (DIS), paracetamol (PAR) and polyvinyl chloride (polymerization degree: 60–150) (PVC) were kindly gifted by Gedeon Richter Plc. (Budapest, Hungary). A powder form of Eudragit E100, Eudragit EPO (EE) and Eudragit L100-55 (EL) was supplied
Pharmaceutics2022,14, 228 3 of 16
by Evonik Industries AG (Essen, Germany). The main physicochemical properties of raw materials are summarized in Table1.
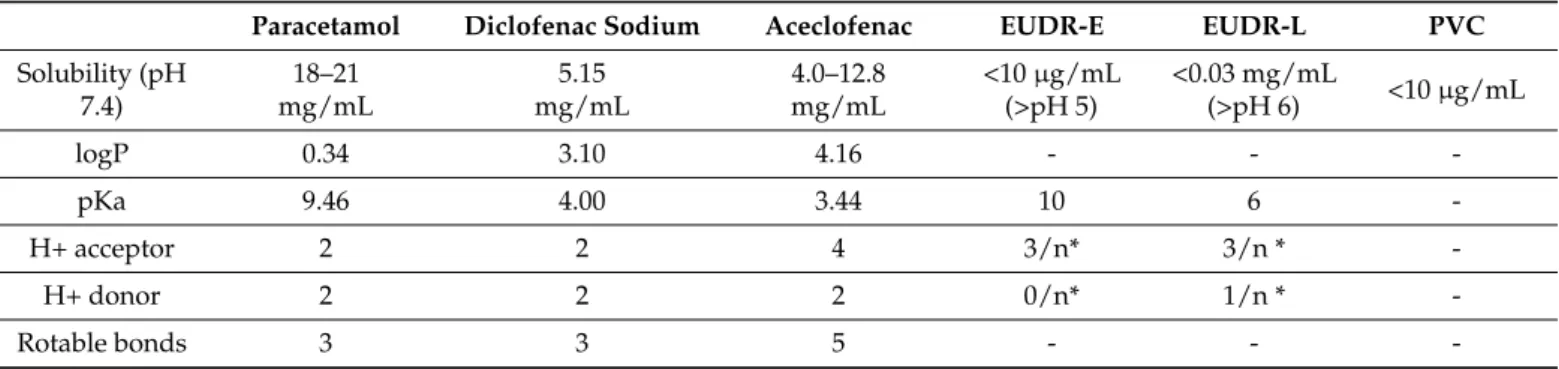
Table 1.Physicochemical properties of raw materials.
Paracetamol Diclofenac Sodium Aceclofenac EUDR-E EUDR-L PVC
Solubility (pH 7.4)
18–21 mg/mL
5.15 mg/mL
4.0–12.8 mg/mL
<10µg/mL (>pH 5)
<0.03 mg/mL
(>pH 6) <10µg/mL
logP 0.34 3.10 4.16 - - -
pKa 9.46 4.00 3.44 10 6 -
H+ acceptor 2 2 4 3/n* 3/n * -
H+ donor 2 2 2 0/n* 1/n * -
Rotable bonds 3 3 5 - - -
* x/n: represents the number of H+ acceptor/donor groups per monomer.
2.2. Methods
2.2.1. Tablet Preparation
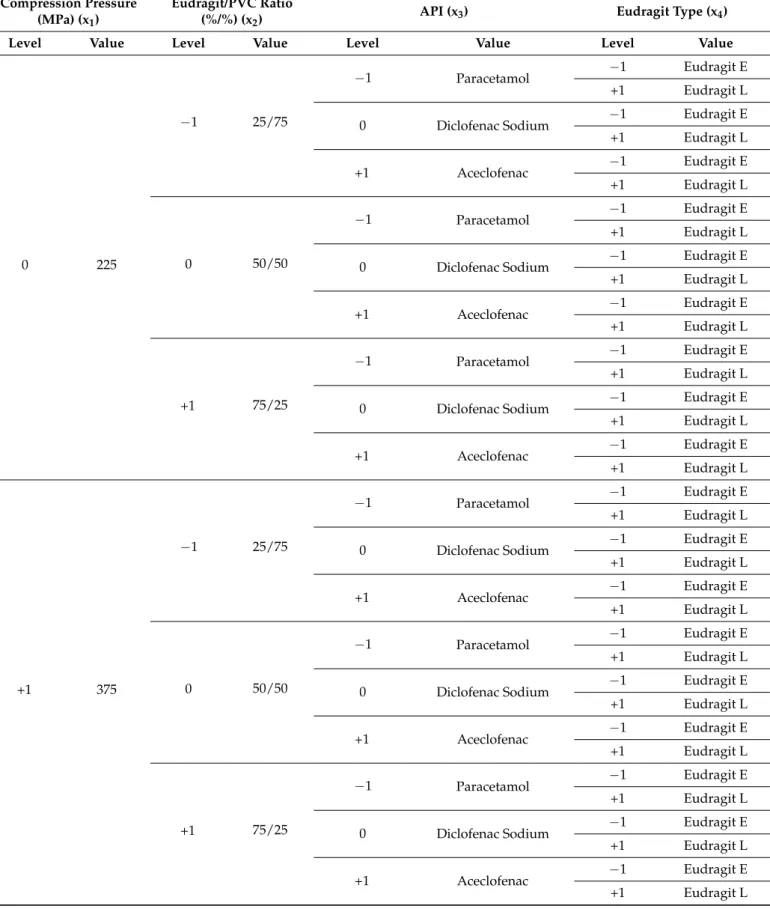
Tablets were prepared according to a mixed 2- and 3-level factorial design, where the acidic or basic nature of excipients (e.g., the use of Eudragit E or L) was studied as 2-level, while the acidic strength of API, the weight ratio of excipients and the applied compression force were studied as 3-level factors. The detailed experimental plan is shown in Table2.
Table 2.DoE plan.
Compression Pressure (MPa) (x1)
Eudragit/PVC Ratio
(%/%) (x2) API (x3) Eudragit Type (x4)
Level Value Level Value Level Value Level Value
−1 75
−1 25/75
−1 Paracetamol −1 Eudragit E
+1 Eudragit L
0 Diclofenac Sodium −1 Eudragit E
+1 Eudragit L
+1 Aceclofenac −1 Eudragit E
+1 Eudragit L
0 50/50
−1 Paracetamol −1 Eudragit E
+1 Eudragit L
0 Diclofenac Sodium −1 Eudragit E
+1 Eudragit L
+1 Aceclofenac −1 Eudragit E
+1 Eudragit L
+1 75/25
−1 Paracetamol −1 Eudragit E
+1 Eudragit L
0 Diclofenac Sodium −1 Eudragit E
+1 Eudragit L
+1 Aceclofenac −1 Eudragit E
+1 Eudragit L
Pharmaceutics2022,14, 228 4 of 16
Table 2.Cont.
Compression Pressure (MPa) (x1)
Eudragit/PVC Ratio
(%/%) (x2) API (x3) Eudragit Type (x4)
Level Value Level Value Level Value Level Value
0 225
−1 25/75
−1 Paracetamol −1 Eudragit E
+1 Eudragit L
0 Diclofenac Sodium −1 Eudragit E
+1 Eudragit L
+1 Aceclofenac −1 Eudragit E
+1 Eudragit L
0 50/50
−1 Paracetamol −1 Eudragit E
+1 Eudragit L
0 Diclofenac Sodium −1 Eudragit E
+1 Eudragit L
+1 Aceclofenac −1 Eudragit E
+1 Eudragit L
+1 75/25
−1 Paracetamol −1 Eudragit E
+1 Eudragit L
0 Diclofenac Sodium −1 Eudragit E
+1 Eudragit L
+1 Aceclofenac −1 Eudragit E
+1 Eudragit L
+1 375
−1 25/75
−1 Paracetamol −1 Eudragit E
+1 Eudragit L
0 Diclofenac Sodium −1 Eudragit E
+1 Eudragit L
+1 Aceclofenac −1 Eudragit E
+1 Eudragit L
0 50/50
−1 Paracetamol −1 Eudragit E
+1 Eudragit L
0 Diclofenac Sodium −1 Eudragit E
+1 Eudragit L
+1 Aceclofenac −1 Eudragit E
+1 Eudragit L
+1 75/25
−1 Paracetamol −1 Eudragit E
+1 Eudragit L
0 Diclofenac Sodium −1 Eudragit E
+1 Eudragit L
+1 Aceclofenac −1 Eudragit E
+1 Eudragit L
Powder mixing was made with a Paul Schatz principle based 1.5 L mixer (Inversina, BioEngineering, Wald, Switzerland) at 45 rpm for 8 min and then for another 2 min with the addition of 1% magnesium stearate as lubricant. The mixtures were compressed with
Pharmaceutics2022,14, 228 5 of 16
an instrumented Kilian SP 300 hydraulic press (IMA Kilian GmbH & Co., KG, Cologne, Germany) using 7 mm-diameter punches with a bevelled edge. The mixtures were loaded into the die manually then compressed in a semi-automatic ’jogging’ mode with the application of 2.9, 8.7, or 14.4 kN compression force (75, 225 and 375 MPa compression pressure, respectively).
2.2.2. Physical Properties
The physical characterization of tablets was made with a Kraemer UTS tablet tester (Kraemer Elektronik GmbH, Germany). Mass, hardness, thickness and diameter were measured. The true density of matrices (ρtrue) was determined with a helium gas pyc- nometer (AccuPyc 1330, Micromeritics, Norcross, GA, USA), while apparent density (ρapp) was calculated from their mass and physical dimensions. Then, porosity (ε) was obtained according to the following equation (Equation (1)):
ε= 1−(ρapp/ρtrue) (1)
2.2.3. Physicochemical Characterization
For the specific identification and characterization of interactions, FT-IR spectra were acquired. ZeSe HATR accessory was used, and measurements were taken with a resolution of 4 cm−1, a scan number of 128, with CO2 and H2O correction. Spectral data were evaluated with SpectraGryph software v1.2.10 (Dr. F. Menges, Berchtesgaden, Germany).
2.2.4. Dissolution Tests
According to the requirements of implantable matrix systems, a custom-made disso- lution tester was applied, imitating the dissolution environment of the tissue matrix and the shearing properties of other flow-through equipment [13]. Tablets were placed into Erlenmeyer flasks containing 50 mL of pH 7.4 phosphate buffered saline solution. The dis- solution medium was circulated with an Alitea-XV (Alitea, Sweden) peristaltic pump using a flow rate of 2 mL/min. Due to the vast number of samples to be studied, 24 h dissolution tests were conducted for all compositions to obtain the most important kinetic parameters, and only those samples were selected afterwards for a one-week study in which the lowest release rates were observed. The concentration gradient was continuously maintained by mimicking the time related systemic renewing of the body fluids. Therefore, in the 24 h long experiments 2.5, 5, 5, 5, 10, and 20 mL samples were taken and replaced with fresh medium after 15 and 30 min and 1, 2, 4, and 8 h, respectively, while the last samples were taken after 24 h. In the case of the one-week study, 5, 5, 10, 20, 35, 35, and 35 mL volumes were sampled and refreshed as above after 1, 2, 4, 8, 24, 48, and 72 h, respectively, while the last samples were taken after 168 h. From each composition, three parallel measurements were taken. Quantitative analysis was made with a ThermoGenesys UV-spectrometer at a wavelength of 274 nm for aceclofenac, 276 nm for diclofenac sodium and 244 nm in the case of paracetamol. The dissolution kinetics was characterized according to the Korsmeyer–Peppas equation (Equation (2)).
Mt/M0=ktn (2)
whereM0is the initial drug amount in the matrix,Mtis the drug amount at the given time (t), kis the dissolution rate constant andn is the release exponent regarding the diffusion mechanism.
2.2.5. Design of Experiments and Artificial Neural Networks
DoE analysis and ANN modelling were performed with Statistica v.13.5.0.17 (Tibco Software Inc., Palo Alto, CA, USA). Compression pressure (x1), amount of excipient (x2), API (x3) and excipient used (x4) were examined as independent factors, while hardness (y1), porosity (y2) and release rate (y3) were used as optimization parameters in the DoE analysis.
Pharmaceutics2022,14, 228 6 of 16
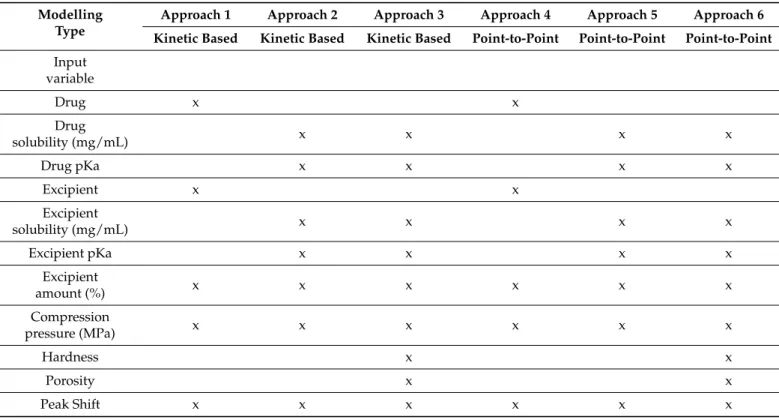
The secondary objective of the present study was to compare the effectiveness of various modelling approaches to enable generalized prediction of drug dissolution rates from different matrices. In kinetic-based modelling, the release rate and release exponent were used as the output of the ANN model, while in point-to-point modelling, the dissolved amount of drug at the various sampling times was applied according to Galata et al. [22], which included 7 data points. Our hypothesis is that kinetic-based modelling allows for a simplified network structure and faster generalization. To clarify the importance of different input parameters for predictive accuracy, 3 different parameter combinations were used to train the ANNs for both kinetic based and point-to-point modelling. A list of inputs used in the different training approaches is provided in Table3, while a detailed data set for training, testing, and validating ANNs is provided in Table S1.
Table 3.Input variables of the various ANN training approaches.
Modelling Type
Approach 1 Approach 2 Approach 3 Approach 4 Approach 5 Approach 6 Kinetic Based Kinetic Based Kinetic Based Point-to-Point Point-to-Point Point-to-Point Input
variable
Drug x x
Drug
solubility (mg/mL) x x x x
Drug pKa x x x x
Excipient x x
Excipient
solubility (mg/mL) x x x x
Excipient pKa x x x x
Excipient
amount (%) x x x x x x
Compression
pressure (MPa) x x x x x x
Hardness x x
Porosity x x
Peak Shift x x x x x x
Feed-forward, back-propagation multilayer perceptron networks were developed in all cases. The networks were trained with BFGS algorithm. The number of hidden neurons was gradually increased in a dynamic system depending on the number of input and output neurons:I + O−3≤n≤I + O + 1, whereIis the number of inputsOis the number outputs andnis number of hidden neurons; thus, the hidden neuron number varied from 4–8, 6–10, 8–12, 9–13, 11–15, 13–17 in cases of approach 1–6, respectively.
A multistart method including 10,000 networks was applied using the automated neural networks module of Statistica with each hidden neuron number, including a training approach to screen the best performing network with different initialization patterns and activation functions for hidden and output neurons. The training was stopped when the root mean square error (RMSE) of test the dataset reached its minimum. The 5 best performing networks from each multistart run were retained for further analysis.
The prediction performance of the networks was evaluated based on network perfec- tion, which is the mean R2of the observed vs. predicted data of each output neuron, and on the RMSE of predictions on the validation subset.
Pharmaceutics2022,14, 228 7 of 16
3. Results and Discussion 3.1. Physical Parameters
The physical parameters of the tablets are shown in Table 4, while the statistical evaluation of the effect of compression pressure (x1), amount of excipient (x2), API (x3) and excipient used (x4) on hardness (y1) and porosity (y2) of the various compositions are displayed in Equations (3) and (4), respectively. The presented equations provided the best fit; for the equations containing the full set of the acquired factor effects and their interactions, please see the Supplementary Materials. The significant factors and factor interactions are highlighted in boldface in all cases.
y1= 110.11 +47.02x1+9.46x12+19.31x2−10.04x3−29.78x4+ 2.45x1x2+ 2.45x12x2 + 2.29x12x22−6.31x1x3−4.29x12x3+4.96x1x32−3.62x12x32−3.32x2x32−11.48x2x4−
2.24x22x4−2.33x3x4+6.83x32x4
R2= 0.9743 adj. R2= 0.9599 MS Res = 123.02
(3)
y2= 0.133−0.053x1−0.023x12−0.046x3+0.018x4+0.024x1x2−0.019x1x22+ 0.012x12x3+ 0.011x12x32−0.014x1x4−0.033x2x3−0.009x2x32+ 0.010x22x32−
0.009x2x4+0.016x22x4
R2= 0.7627 adj R2= 0.6775 MS Res = 0.0023
(4)
Table 4.Physical parameters of matrices.
Eudragit/PVC Ratio (%/%)
Compression Pressure
(MPa) Composition Mass
(mg) Hardness
(N) Porosity Composition Mass
(mg) Hardness
(N) Porosity Composition Mass
(mg) Hardness
(N) Porosity
25/75 75
PAR- PVC-EL
147.0 15.0 0.307
DIS- PVC-EL
152.1 8.0 0.423
ACE- PVC-EL
144.5 13.5 0.279
225 147.9 114.3 0.136 135.2 118.5 0.125 131.4 68.2 0.077
375 141.6 109.1 0.118 202.6 140.7 0.082 131.2 103.6 0.067
50/50
75 149.0 18.7 0.290 154.2 34.0 0.236 152.7 22.9 0.232
225 135.9 95.8 0.122 138.7 92.0 0.128 137.8 65.8 0.104
375 142.2 133.6 0.111 146.9 134.4 0.058 142.4 71.3 0.097
75/25 75 147.0 28.2 0.306 153.8 27.3 0.026 147.7 15.2 0.027
225 151.7 132.6 0.118 136.9 97.0 0.137 134.9 90.7 0.086
375 149.7 153.8 0.091 121.5 153.8 0.100 137.1 116.7 0.060
25/75
75
PAR- PVC-EE
154.8 113.6 0.223
DIS- PVC-EE
150.4 94.4 0.092
ACE- PVC-EE
147.3 93.4 0.106
225 142.5 166.6 0.126 129.0 130.7 0.098 151.2 159.1 0.038
375 136.1 184.5 0.098 130.7 173.7 0.113 152.7 164.7 0.014
50/50 75 149.0 50.1 0.191 151.7 57.4 0.210 151.1 67.6 0.141
225 152.2 146.7 0.109 138.8 102.6 0.101 137.6 87.5 0.068
375 145.2 161.8 0.105 138.7 153.8 0.080 139.0 143.6 0.071
75/25 75 149.5 128.6 0.282 137.4 102.9 0.147 146.3 131.2 0.102
225 137.0 192.4 0.131 135.8 160.6 0.121 145.9 187.9 0.011
375 148.6 211.2 0.115 151.7 201.0 0.046 141.7 192.8 0.011
The porosity of the system exhibited a well-established logarithmic correlation with tablet hardness (Figure1), and the increase in pressure resulted in stronger matrices and decrement in porosity. Nevertheless, there were some outliers, where tablets with low breaking hardness showed extremely low porosity. In such cases, radically increased dwell time was required to avoid critical tableting problems, e.g., capping, lamination, cracking, or picking. This phenomenon caused poorer fitting accuracy in case of porosity (y2) values; thus, the results of the statistical analysis and the related conclusions should be treated with caution.
The results revealed that matrices made of EE could reach higher breaking hardness and lower porosity than the tablets made of EL. From the aspect of different weight ratios, the general conclusion is that the composites containing more methacrylate copolymer and less PVC appeared to be the strongest systems with the least porosity, while the 25:75 Eudragit–PVC ratio showed the lowest values and the highest porosity. The mean values showed that paracetamol formed the hardest, and aceclofenac formed the weakest, matrices, but in contrast with the general expectations, this was not directly proportional to the drug release rate, which supports our primary hypothesis that besides the
Pharmaceutics2022,14, 228 8 of 16
matrix porosity the physicochemical properties of the applied materials, the presence of drug–carrier interactions may considerably influence drug release.
Pharmaceutics 2022, 14, x 7 of 17
225 152.2 146.7 0.109 138.8 102.6 0.101 137.6 87.5 0.068
375 145.2 161.8 0.105 138.7 153.8 0.080 139.0 143.6 0.071
75/25
75 149.5 128.6 0.282 137.4 102.9 0.147 146.3 131.2 0.102
225 137.0 192.4 0.131 135.8 160.6 0.121 145.9 187.9 0.011
375 148.6 211.2 0.115 151.7 201.0 0.046 141.7 192.8 0.011
The porosity of the system exhibited a well-established logarithmic correlation with tablet hardness (Figure 1), and the increase in pressure resulted in stronger matrices and decrement in porosity. Nevertheless, there were some outliers, where tablets with low breaking hardness showed extremely low porosity. In such cases, radically increased dwell time was required to avoid critical tableting problems, e.g., capping, lamination, cracking, or picking. This phenomenon caused poorer fitting accuracy in case of porosity (y2) values; thus, the results of the statistical analysis and the related conclusions should be treated with caution.
The results revealed that matrices made of EE could reach higher breaking hardness and lower porosity than the tablets made of EL. From the aspect of different weight ratios, the general conclusion is that the composites containing more methacrylate copolymer and less PVC appeared to be the strongest systems with the least porosity, while the 25:75 Eudragit–PVC ratio showed the lowest values and the highest porosity. The mean values showed that paracetamol formed the hardest, and aceclofenac formed the weakest, matri- ces, but in contrast with the general expectations, this was not directly proportional to the drug release rate, which supports our primary hypothesis that besides the matrix porosity the physicochemical properties of the applied materials, the presence of drug–carrier in- teractions may considerably influence drug release.
Figure 1. Hardness–porosity plot.
3.2. Investigation of Drug–Carrier Interactions
The FT-IR spectra of the compressed samples were used to reveal the presence of the drug–excipient interactions. The method is well applicable in various fields where chem- ical interactions are the area of interest [23,24]; the present analysis focuses on selected wavenumber ranges reasonably, where signals of H-bond forming groups can be found.
Weak signal intensities were observed in the -OH stretching region (3000–3600 cm−1, data not displayed) for all samples, which made the drawing of proper consequences about the interaction status impossible. The further analysis therefore focuses on the C=O stretching (1600–1800 cm−1) and the β-OH (β-NH) deformation vibration (1200–1600 cm−1) regions.
According to our primary hypothesis, the interaction potential of the studied APIs decreases in the order of ACE > DIS >> PAR, and stronger interactions are expected with EE than with EL in all cases. The results generally confirmed this hypothesis.
Figure 2 displays the IR spectra of ACE-PVC-EE composition, which exhibits inten- sive signs of drug–polymer interactions. In the carbonyl signal (C=O stretching) region, Figure 1.Hardness–porosity plot.
3.2. Investigation of Drug–Carrier Interactions
The FT-IR spectra of the compressed samples were used to reveal the presence of the drug–
excipient interactions. The method is well applicable in various fields where chemical interactions are the area of interest [23,24]; the present analysis focuses on selected wavenumber ranges reasonably, where signals of H-bond forming groups can be found.
Weak signal intensities were observed in the -OH stretching region (3000–3600 cm−1, data not displayed) for all samples, which made the drawing of proper consequences about the interaction status impossible. The further analysis therefore focuses on the C=O stretching (1600–1800 cm−1) and theβ-OH (β-NH) deformation vibration (1200–1600 cm−1) regions.
According to our primary hypothesis, the interaction potential of the studied APIs decreases in the order of ACE > DIS >> PAR, and stronger interactions are expected with EE than with EL in all cases. The results generally confirmed this hypothesis.
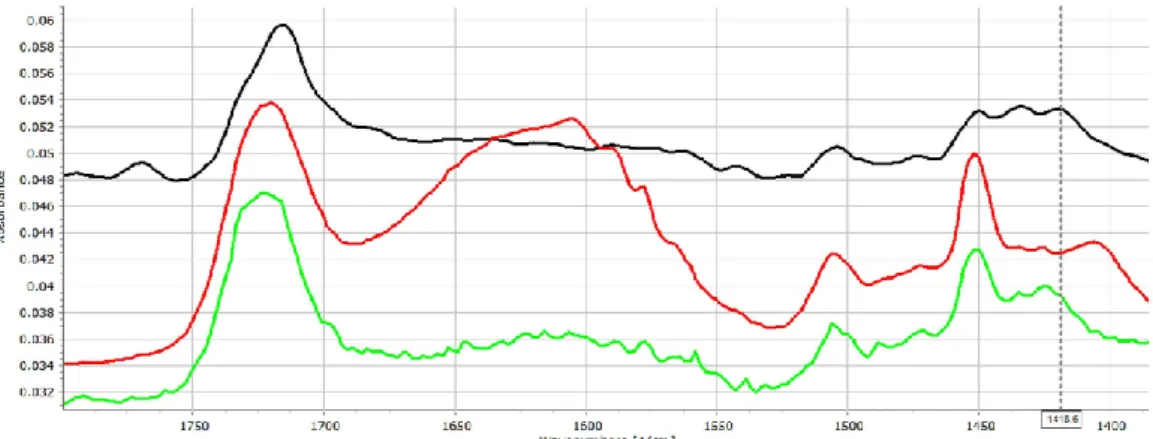
Figure2displays the IR spectra of ACE-PVC-EE composition, which exhibits intensive signs of drug–polymer interactions. In the carbonyl signal (C=O stretching) region, EE has a characteristic peak at 1722 cm−1, while the ACE at 1712 and at 1769 cm−1belong to the dimerized and monomer forms, respectively. The monomeric peak of ACE (1769 cm−1) exhibits decreasing intensity with the increasing amount of EE (Figure2), indicating strong conjugation between the drug and excipient.
Some further changes, such as the shifting of the deformation vibration of the HNC bonds at 1415 cm−1appears to shift to 1420 cm−1, which indicates that the corresponding molecular parts may take part in the interaction.
Pharmaceutics 2022, 14, x 8 of 17
EE has a characteristic peak at 1722 cm−1, while the ACE at 1712 and at 1769 cm−1 belong to the dimerized and monomer forms, respectively. The monomeric peak of ACE (1769 cm−1) exhibits decreasing intensity with the increasing amount of EE (Figure 2), indicating strong conjugation between the drug and excipient. Some further changes, such as the shifting of the deformation vibration of the HNC bonds at 1415 cm−1 appears to shift to 1420 cm−1, which indicates that the corresponding molecular parts may take part in the interaction.
Figure 2. FT-IR spectra (1400–1800 cm−1 range) of the ACE (black), ACE-PVC:EE 75:25 (red), ACE- PVC:EE 50:50 (green), ACE-PVC:EE 25:75 (deep blue), EE (light blue) and PVC (purple) samples;
multicursor indicates the place of peak shift in the spectrum.
As was expected, ACE exhibited fewer signs of interactions in relation to the acidic EL polymer (Figure 3). The presence of mild interactions by increasing the amount of the EL is supported by the slight shift of the carbonyl signal to 1715, 1717 and 1719 cm−1 in the cases of 75:25, 50:50 and 25:75 PVC:EL ratios, respectively, and indicated increasing strength of interactions, which is also supported by the decreasing intensity of the unas- sociated acidic carbonyl absorption peak which appears at 1769 cm−1.
The β-OH vibration of EL appears at 1472.2 cm−1, which cannot be seen clearly in the spectra of matrices. A slight shift of the peak at 1415.3 towards 1417.8 cm−1 can be recog- nised, which may reflect some further changes in the environment of the diphenylamine group of the drug. This finding is in accordance with the observation of Liu et al., who confirmed that EL may form H-bond based interactions under proper circumstances [25].
Figure 3. FT-IR spectra (1400–1800 cm−1 range) of the ACE (black), ACE-PVC:EL 75:25 (red), ACE- PVC:EL 50:50 (green), ACE-PVC:EL 25:75 (deep blue), EL (light blue) and PVC (purple) samples;
multicursor indicates the place of peak shift in the spectrum.
To clarify the importance of the solid-state interactions, and to analyse the effect of the dissolution medium on the strength of interactions, the following experiment was Figure 2.FT-IR spectra (1400–1800 cm−1range) of the ACE (black), ACE-PVC:EE 75:25 (red), ACE- PVC:EE 50:50 (green), ACE-PVC:EE 25:75 (deep blue), EE (light blue) and PVC (purple) samples;
multicursor indicates the place of peak shift in the spectrum.
Pharmaceutics2022,14, 228 9 of 16
As was expected, ACE exhibited fewer signs of interactions in relation to the acidic EL polymer (Figure3). The presence of mild interactions by increasing the amount of the EL is supported by the slight shift of the carbonyl signal to 1715, 1717 and 1719 cm−1in the cases of 75:25, 50:50 and 25:75 PVC:EL ratios, respectively, and indicated increasing strength of interactions, which is also supported by the decreasing intensity of the unassociated acidic carbonyl absorption peak which appears at 1769 cm−1.
Pharmaceutics 2022, 14, x 8 of 17
EE has a characteristic peak at 1722 cm−1, while the ACE at 1712 and at 1769 cm−1 belong to the dimerized and monomer forms, respectively. The monomeric peak of ACE (1769 cm−1) exhibits decreasing intensity with the increasing amount of EE (Figure 2), indicating strong conjugation between the drug and excipient. Some further changes, such as the shifting of the deformation vibration of the HNC bonds at 1415 cm−1 appears to shift to 1420 cm−1, which indicates that the corresponding molecular parts may take part in the interaction.
Figure 2. FT-IR spectra (1400–1800 cm−1 range) of the ACE (black), ACE-PVC:EE 75:25 (red), ACE- PVC:EE 50:50 (green), ACE-PVC:EE 25:75 (deep blue), EE (light blue) and PVC (purple) samples;
multicursor indicates the place of peak shift in the spectrum.
As was expected, ACE exhibited fewer signs of interactions in relation to the acidic EL polymer (Figure 3). The presence of mild interactions by increasing the amount of the EL is supported by the slight shift of the carbonyl signal to 1715, 1717 and 1719 cm−1 in the cases of 75:25, 50:50 and 25:75 PVC:EL ratios, respectively, and indicated increasing strength of interactions, which is also supported by the decreasing intensity of the unas- sociated acidic carbonyl absorption peak which appears at 1769 cm−1.
The β-OH vibration of EL appears at 1472.2 cm−1, which cannot be seen clearly in the spectra of matrices. A slight shift of the peak at 1415.3 towards 1417.8 cm−1 can be recog- nised, which may reflect some further changes in the environment of the diphenylamine group of the drug. This finding is in accordance with the observation of Liu et al., who confirmed that EL may form H-bond based interactions under proper circumstances [25].
Figure 3. FT-IR spectra (1400–1800 cm−1 range) of the ACE (black), ACE-PVC:EL 75:25 (red), ACE- PVC:EL 50:50 (green), ACE-PVC:EL 25:75 (deep blue), EL (light blue) and PVC (purple) samples;
multicursor indicates the place of peak shift in the spectrum.
To clarify the importance of the solid-state interactions, and to analyse the effect of the dissolution medium on the strength of interactions, the following experiment was Figure 3.FT-IR spectra (1400–1800 cm−1range) of the ACE (black), ACE-PVC:EL 75:25 (red), ACE- PVC:EL 50:50 (green), ACE-PVC:EL 25:75 (deep blue), EL (light blue) and PVC (purple) samples;
multicursor indicates the place of peak shift in the spectrum.
Theβ-OH vibration of EL appears at 1472.2 cm−1, which cannot be seen clearly in the spectra of matrices. A slight shift of the peak at 1415.3 towards 1417.8 cm−1can be recognised, which may reflect some further changes in the environment of the diphenylamine group of the drug. This finding is in accordance with the observation of Liu et al., who confirmed that EL may form H-bond based interactions under proper circumstances [25].
To clarify the importance of the solid-state interactions, and to analyse the effect of the dissolu- tion medium on the strength of interactions, the following experiment was performed. Tablets were dipped into pH 7.4 buffer for 30 min to achieve a complete moisturization of the sample, then the excess of the water was removed, and the samples were measured with FT-IR. Nevertheless, since the presence of water in the pores completely masked the signals in the 3000–3600 and 1550–1700 cm−1 regions, the samples were dried in desiccator for 24 h and measured again.
Figure4displays that the strength of intermolecular interactions has increased as an effect of water absorption. The characteristic peaks of HCN bonds from 1434 cm−1was shifted to 1451 cm−1, while the peak at 1420 cm−1 shifted to 1405 cm−1. The characteristic peak of C-N stretching at 1252 cm−1shifted to 1272 cm−1. These changes may also be observed in case of the dried samples, despite some re-organization due to water loss.
Pharmaceutics 2022, 14, x 9 of 17
performed. Tablets were dipped into pH 7.4 buffer for 30 min to achieve a complete moisturization of the sample, then the excess of the water was removed, and the samples were measured with FT-IR. Nevertheless, since the presence of water in the pores com- pletely masked the signals in the 3000–3600 and 1550–1700 cm−1 regions, the samples were dried in desiccator for 24 h and measured again.
Figure 4 displays that the strength of intermolecular interactions has increased as an effect of water absorption. The characteristic peaks of HCN bonds from 1434 cm−1 was shifted to 1451 cm−1, while the peak at 1420 cm−1 shifted to 1405 cm−1. The characteristic peak of C-N stretching at 1252 cm−1 shifted to 1272 cm−1. These changes may also be ob- served in case of the dried samples, despite some re-organization due to water loss.
Figure 4. FT-IR spectra of ACE-PVC:EE 75:25 samples: original (black), dipped (red), and dried (green).
In the case of EL containing samples (Figure 5), similar changes may be observed in the characteristic peaks of HCN vibrations: the peak at 1438 cm−1 shifts to 1425 cm−1 and its intensity increases considerably, while and C-N stretching signal, which may be found at 1279 cm−1, shifts to 1291 cm−1.
Figure 5. FT-IR spectra of ACE-PVC:EL 75:25 samples: original (black), dipped (red), and dried (green).
As expected, the matrices prepared with DIS exhibited fewer spectral changes after compression, primarily due the weaker acidity of the drug, but the higher porosity may also play a possible role in this phenomenon. Similarly, as in the ACE-containing compo- sitions, the most obvious changes may be found in the C=O stretching region. The charac- teristic peak doublet may be found at 1555 and 1571 cm−1, where the shift of the peak intensities in the direction of 1571 cm−1 may be observed with increasing Eudragit content.
As expected, the shift is less intensive in the case of EL-containing compositions (Figure S1) than in EE-containing ones (Figure S2). Some further signs of mild interactions and Figure 4.FT-IR spectra of ACE-PVC:EE 75:25 samples: original (black), dipped (red), and dried (green).
In the case of EL containing samples (Figure 5), similar changes may be observed in the characteristic peaks of HCN vibrations: the peak at 1438 cm−1shifts to 1425 cm−1and its intensity
Pharmaceutics2022,14, 228 10 of 16
increases considerably, while and C-N stretching signal, which may be found at 1279 cm−1, shifts to 1291 cm−1.
Pharmaceutics 2022, 14, x 9 of 17
performed. Tablets were dipped into pH 7.4 buffer for 30 min to achieve a complete moisturization of the sample, then the excess of the water was removed, and the samples were measured with FT-IR. Nevertheless, since the presence of water in the pores com- pletely masked the signals in the 3000–3600 and 1550–1700 cm−1 regions, the samples were dried in desiccator for 24 h and measured again.
Figure 4 displays that the strength of intermolecular interactions has increased as an effect of water absorption. The characteristic peaks of HCN bonds from 1434 cm−1 was shifted to 1451 cm−1, while the peak at 1420 cm−1 shifted to 1405 cm−1. The characteristic peak of C-N stretching at 1252 cm−1 shifted to 1272 cm−1. These changes may also be ob- served in case of the dried samples, despite some re-organization due to water loss.
Figure 4. FT-IR spectra of ACE-PVC:EE 75:25 samples: original (black), dipped (red), and dried (green).
In the case of EL containing samples (Figure 5), similar changes may be observed in the characteristic peaks of HCN vibrations: the peak at 1438 cm−1 shifts to 1425 cm−1 and its intensity increases considerably, while and C-N stretching signal, which may be found at 1279 cm−1, shifts to 1291 cm−1.
Figure 5. FT-IR spectra of ACE-PVC:EL 75:25 samples: original (black), dipped (red), and dried (green).
As expected, the matrices prepared with DIS exhibited fewer spectral changes after compression, primarily due the weaker acidity of the drug, but the higher porosity may also play a possible role in this phenomenon. Similarly, as in the ACE-containing compo- sitions, the most obvious changes may be found in the C=O stretching region. The charac- teristic peak doublet may be found at 1555 and 1571 cm−1, where the shift of the peak intensities in the direction of 1571 cm−1 may be observed with increasing Eudragit content.
As expected, the shift is less intensive in the case of EL-containing compositions (Figure S1) than in EE-containing ones (Figure S2). Some further signs of mild interactions and Figure 5.FT-IR spectra of ACE-PVC:EL 75:25 samples: original (black), dipped (red), and dried (green).
As expected, the matrices prepared with DIS exhibited fewer spectral changes after compression, primarily due the weaker acidity of the drug, but the higher porosity may also play a possible role in this phenomenon. Similarly, as in the ACE-containing compositions, the most obvious changes may be found in the C=O stretching region. The characteristic peak doublet may be found at 1555 and 1571 cm−1, where the shift of the peak intensities in the direction of 1571 cm−1may be observed with increasing Eudragit content. As expected, the shift is less intensive in the case of EL-containing compositions (Figure S1) than in EE-containing ones (Figure S2). Some further signs of mild interactions and increased intramolecular association of the C-O bond region of EE-containing matrices may also be observed (Figure S2). The characteristic peak of DIS at 1279 cm−1and of EE at 1269.5 cm−1overlap around 1274 cm−1in accordance with the increasing amount of EE.
The observed interactions were strongly intensified by the dipping. The ratio of the associated C=O groups increased for both EE- and EL-containing matrices (Figure S3 and Figure S4, respectively), which is well visible from the increasing intensity of the associated C=O peak at 1555 cm−1and 1549 cm−1for EE and EL, respectively. Further changes such as the increasing intensity of the peak at 1410 cm−1and a peak shift from 1234 to 1248 cm−1, associated with theβNH and C-N stretching vibration, respectively, indicates that under these circumstances, the secondary amino group of DIS was also involved in the association with EE. In the case of EL, the corresponding changes may be found at 1409, 1232, and at 1250 cm−1. Other peak shifts from 1168 to 1197 cm−1and from 1190 to 1198 cm−1for EE and EL, respectively, confirm the presence of intermolecular associations from the side of the polymers.
In the case of PAR-containing compositions, they exhibit no obvious signs of interactions in case of EL- (Figure S5) or EE- (Figure S6) containing compositions. The only mentionable change is the slight shift of a C-N stretching peak (PAR) from 1221 to 1224 or 1226 cm−1, in the case of EL- and EE-containing compositions, respectively. This finding was in accordance with our primary hypothesis and with the finding of Obediat et al., who also observed no interactions between EE and PAR in compressed matrix systems [26].
Nevertheless, after dipping the tablets into the dissolution medium, considerable changes were observed in the FT-IR spectra for both the EE- and EL-containing samples. The shift of the peaks from 1504 to 1512 cm−1and from 1432 to 1454 cm−1indicates the participation of the secondary amide group, while the shift of the peak from 1224 to 1239 cm−1refers on the involvement of the phenolic -OH group into intermolecular associations (Figure S7). The shift of the characteristic peak of EE from 1170 to 1147 cm−1suggests that the drug is connected to tertiary amino groups of the polymer.
The above-mentioned changes may be observed in case of EL-containing samples (peak shifts from 1504 to 1514 cm−1, from 1434 to 1424 cm−1and from 1224 to 1240 cm−1), while the shift of the characteristic peak of EL from 1169 to 1186 cm−1indicates that the carbonyl side groups of the polymer are involved into the association (Figure S8).
Overall, the results confirmed that solid-state drug-polymer interactions may be presented after direct compression of the materials, which were in accordance with the findings with de Robertis et al. [11]. The weak solid-state H-bonds may further strengthen during the dissolution process and may influence the drug release rate [12], or in some cases, it may even turn into the formation of polyelectrolyte complexes, as was observed by Pavli et al. [27].
Pharmaceutics2022,14, 228 11 of 16
3.3. Dissolution Tests and Kinetic Study
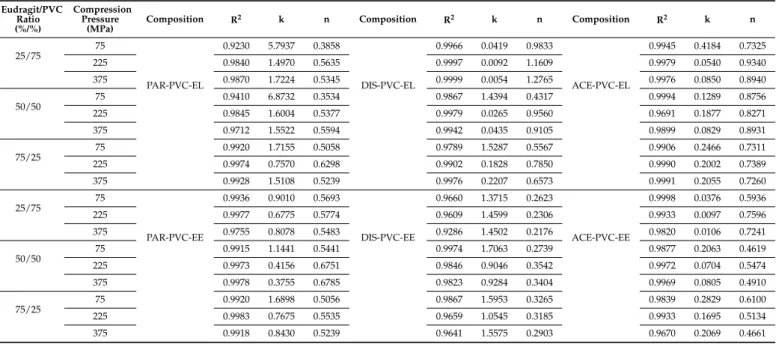
The drug release kinetics were evaluated with the use of the Korsmeyer–Peppas model (Table5), which is the most regular type of dissolution in the case of hydrophilic matrix systems. It can be noticed from the results that the dissolution followed non-Fickian diffusion. Most n values represent non-Fickian kinetics, except for those below 0.45. In the case of cylindrical shapes, Fickian diffusion has a value of 0.45, and for spherical shapes, this value is 0.43. The reason for having smaller values than the limitations of the model is due to the polydisperse nature of the system [28]. Particle size has a major influence on the release exponent. In addition, the geometry of tablets slightly varies from an ideal cylindrical shape.
Table 5.Release rates and release exponents derived from the Korsmeyer–Peppas model (24 h long test).
Eudragit/PVC Ratio (%/%)
Compression Pressure
(MPa)
Composition R2 k n Composition R2 k n Composition R2 k n
25/75 75
PAR-PVC-EL
0.9230 5.7937 0.3858
DIS-PVC-EL
0.9966 0.0419 0.9833
ACE-PVC-EL
0.9945 0.4184 0.7325
225 0.9840 1.4970 0.5635 0.9997 0.0092 1.1609 0.9979 0.0540 0.9340
375 0.9870 1.7224 0.5345 0.9999 0.0054 1.2765 0.9976 0.0850 0.8940
50/50 75 0.9410 6.8732 0.3534 0.9867 1.4394 0.4317 0.9994 0.1289 0.8756
225 0.9845 1.6004 0.5377 0.9979 0.0265 0.9560 0.9691 0.1877 0.8271
375 0.9712 1.5522 0.5594 0.9942 0.0435 0.9105 0.9899 0.0829 0.8931
75/25
75 0.9920 1.7155 0.5058 0.9789 1.5287 0.5567 0.9906 0.2466 0.7311
225 0.9974 0.7570 0.6298 0.9902 0.1828 0.7850 0.9990 0.2002 0.7389
375 0.9928 1.5108 0.5239 0.9976 0.2207 0.6573 0.9991 0.2055 0.7260
25/75 75
PAR-PVC-EE
0.9936 0.9010 0.5693
DIS-PVC-EE
0.9660 1.3715 0.2623
ACE-PVC-EE
0.9998 0.0376 0.5936
225 0.9977 0.6775 0.5774 0.9609 1.4599 0.2306 0.9933 0.0097 0.7596
375 0.9755 0.8078 0.5483 0.9286 1.4502 0.2176 0.9820 0.0106 0.7241
50/50 75 0.9915 1.1441 0.5441 0.9974 1.7063 0.2739 0.9877 0.2063 0.4619
225 0.9973 0.4156 0.6751 0.9846 0.9046 0.3542 0.9972 0.0704 0.5474
375 0.9978 0.3755 0.6785 0.9823 0.9284 0.3404 0.9969 0.0805 0.4910
75/25 75 0.9920 1.6898 0.5056 0.9867 1.5953 0.3265 0.9839 0.2829 0.6100
225 0.9983 0.7675 0.5535 0.9659 1.0545 0.3185 0.9933 0.1695 0.5134
375 0.9918 0.8430 0.5239 0.9641 1.5575 0.2903 0.9670 0.2069 0.4661
The PAR-loaded matrices released the most drugs from 40% to 90% within 24 h, the acidic ACE-containing ones released between 2% and 80%, and the DIS-loaded systems released 6–50%.
These differences cannot be explained with the different solubilities of the APIs since the applied dissolution environment ensures sink conditions for all tested drugs, and therefore the solubility may not be a limiting factor.
Nevertheless, the results of statistical analysis (Equation (5)) revealed that the main governing forces of the drug dissolution rate (y3) are the physicochemical properties, especially the acidic strength of the drug (x3) and the applied compression force (x1), which confirm that the release rate is primarily determined by the porosity of the tablets, since PAR loaded matrices have the lowest hardness and highest porosity (Table3.).
y3= 0.937−0.380x1−0.284x12−0.804x3+ 0.185x4−0.242x1x22+0.403x1x3+ 0.116x1x32+0.289x12x3−0.208x1x4−0.181x12x4−0.241x2x3−0.135x2x32+
0.197x2x4+ 0.116x22x4−0.440x3x4−0.427x32x4
R2= 0.7669 adj R2= 0.6661 MS Res = 0.5176
(5)
The amount of excipient (x2), and excipient used (x4) exhibited non-significant effects on the dissolution rate, but regarding the significant factor interactions, the compressibility of the API and its possible chemical interactions with the polymer have considerable influence on drug liberation.
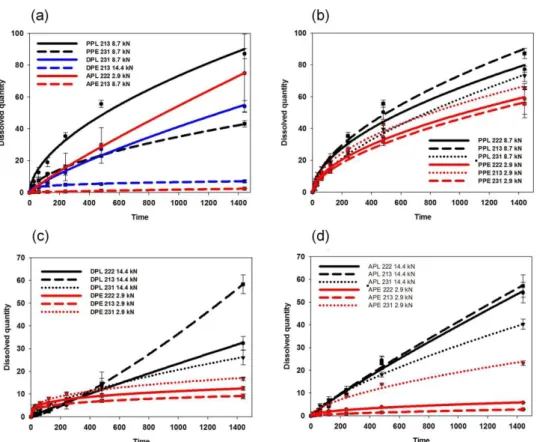
To confirm this observation and to minimize the effect of the mechanical differences, the dissolution rates of tablets with similar porosities (0.13±0.02) were compared (Figure6a).
Pharmaceutics2022,14, 228 12 of 16
Pharmaceutics 2022, 14, x 12 of 17
drugs and the alkaline EE. This finding supports our previous observation on the role of in situ forming drug–polymer interactions in drug dissolution [12] and were in accord- ance with the similar findings of Priemel et al. [30] and Mustafine et al. [31].
Figure 6. Drug release from various matrices: effect of the drug and polymer properties (a) and effect of the composition and compression force for PAR- (b), DIS- (c) and ACE- (d) containing ma- trices.
Finally, to confirm that the interaction-based matrix design is a suitable approach for long-term drug delivery, one-week long dissolution studies were also performed with some selected compositions. The detailed results can be found in the supplementary ma- terial.
3.4. ANN Modelling
ANN modelling was performed for a dual purpose: to cross check the DoE-based results on the importance of various descriptors on drug dissolution and to compare the effectiveness of kinetic-based and point-to-point approaches in the predictability of the dissolution data. The use of various predictor sets may help the further clarification in which material attributes a play crucial role in the dissolution of the developed implanta- ble matrices.
The results revealed that the overall perfection of point-to-point modelling was sig- nificantly (p < 0.05) better than kinetic parameter-based models (0.92 ± 0.02 and 0.87 ± 0.03, respectively). No significant difference was observed between the prediction performance of retained networks related to the applied hidden neuron number (Table S3); the results were inconsistent and more dependent on network initialization. Similarly, the use of the various predictor sets caused no considerable change in the overall prediction perfor- mance, but an interesting difference was observed between the point-to-point and kinetic parameter-based models when the prediction performance was compared on the train, test, and validation subsets. In the case of kinetic parameter-based modelling, the RMSE Figure 6.Drug release from various matrices: effect of the drug and polymer properties (a) and effect of the composition and compression force for PAR- (b), DIS- (c) and ACE- (d) containing matrices.
The results met the expectations since EE-based compositions exhibited considerably lower dissolution rates in all cases. Furthermore, in contrast to the observation of Mustafine et al., where in the case of acidic APIs, a dissolution rate of 100% was expected between 2 to 8 h with the application of EE and EL [29], slower dissolution was achieved with all tested systems, which also supports the importance of drug–matrix interactions on the dissolution rate.
The amount of the released drug decreased to 50.6% from 78.5%, to 10.9% from 45.7% and to 6.2% from 58.5% in the cases of PAR-, DIS- and ACE-containing systems, respectively, if EL was switched to EE in the matrix (Figure6b–d). This may be partially explained by the increased hardness and smaller overall porosity of EE-containing samples, but the tendency is the same if the dissolution rates of samples with similar porosities are compared. In contrast, the observed results are in good accordance with the strength of drug–carrier interactions, since stronger interactions were expected between the acidic drugs and the alkaline EE. This finding supports our previous observation on the role of in situ forming drug–polymer interactions in drug dissolution [12] and were in accordance with the similar findings of Priemel et al. [30] and Mustafine et al. [31].
Finally, to confirm that the interaction-based matrix design is a suitable approach for long- term drug delivery, one-week long dissolution studies were also performed with some selected compositions. The detailed results can be found in the supplementary material.
3.4. ANN Modelling
ANN modelling was performed for a dual purpose: to cross check the DoE-based results on the importance of various descriptors on drug dissolution and to compare the effectiveness of kinetic- based and point-to-point approaches in the predictability of the dissolution data. The use of various predictor sets may help the further clarification in which material attributes a play crucial role in the dissolution of the developed implantable matrices.
The results revealed that the overall perfection of point-to-point modelling was significantly (p< 0.05) better than kinetic parameter-based models (0.92±0.02 and 0.87±0.03, respectively). No significant difference was observed between the prediction performance of retained networks related to the applied hidden neuron number (Table S3); the results were inconsistent and more dependent on network initialization. Similarly, the use of the various predictor sets caused no considerable change in the overall prediction performance, but an interesting difference was observed between the
Pharmaceutics2022,14, 228 13 of 16
point-to-point and kinetic parameter-based models when the prediction performance was compared on the train, test, and validation subsets. In the case of kinetic parameter-based modelling, the RMSE of predictions on train (0.22±0.08, 0.15±0.07, 0.09±0.05) and test (0.30±0.04, 0.29±0.05, 0.19±0.05) datasets were significantly improved in order of Approach 1, 2 and 3, respectively, while no significant change was observed in the validation dataset. In contrast, for point-to-point modelling, the RMSE of predictions on train and test datasets remained unchanged, while it was a significant improvement on the validation dataset (328±19, 235±18, 158±10) in order of approaches 5, 4, and 6, respectively.
Nevertheless, despite that the observed differences can be stated, the use of continuous inputs with appropriate descriptors of the tablet texture (hardness, porosity) enabled for the best prediction performance for both point-to-point and kinetic parameter-based approaches, despite the fact that the texture parameters exhibited relatively low importance in predictivity according to the results of the global sensitivity analysis (Table S4).
The results of the global sensitivity analysis, which show the relative importance of various predictors (inputs) on prediction outcome, are partly consistent with the results of the experimental design. The greatest effect was observed for drug solubility, but the pKa of the excipients and the peak shift indicating drug–excipient interactions exhibited similar importance versus the compression pressure, tablet texture or the amount of excipient (Table S4).
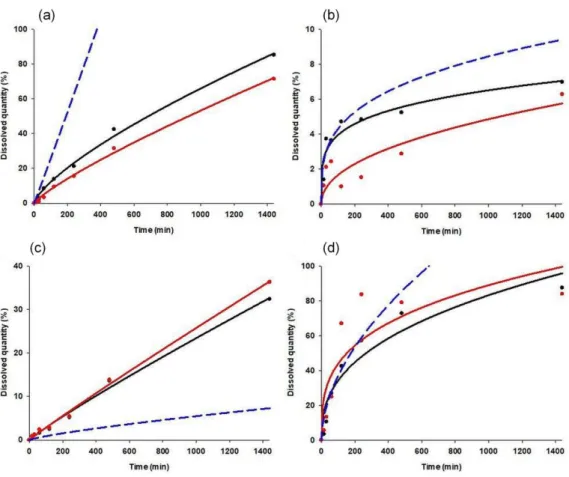
To ultimately compare the prediction effectiveness of point-to-point and kinetic parameter- based modelling approaches, the best performing networks (best overall training perfection and lowest prediction error on validation dataset, with no negative prediction values) were selected for both modelling approaches. The best network for kinetic parameter-based modelling had nine input, seven hidden and two output neurons, with logistic activation on hidden and exponential on output neurons (training perfection: 0.9103, validation error: 0.0760). The structure of the best point-to-point network was nine input, sixteen hidden, and seven output neurons, with exponential activation on hidden neurons and logistic on output neurons (training perfection: 0.9286, validation error: 83.06).
Figure7shows the predicted dissolution curves of the best and worst predicted cases.
Pharmaceutics 2022, 14, x 14 of 17
Figure 7. Observed and predicted dissolution curves of case 43 (a), case 36 (b), case 24 (c) and case 7 (d). Black dots: observed data points; black line: fitted model on observed data; red dots: predicted data points; red line: fitted model on predicted data points; blue line: predicted model.
4. Conclusions
The present study introduced a comprehensive systematic approach for the investi- gation of the role of chemical interactions between APIs and excipients in directly com- pressed matrices. With the help of FT-IR studies, it was confirmed that solid-state interac- tions may be induced in directly compressed matrix systems. The results also confirmed that the presence of solid-state interactions may not always present in directly compressed systems, but their presence will definitely predict strong in situ forming interactions dur- ing the drug dissolution process. The interactions are mostly H-bond based, but the form- ing of polyelectrolyte complexes cannot be excluded. The results of both DoE analysis and the ANN modelling supported our primary hypothesis that API-excipient interactions have a considerable effect on drug release by retaining the drug in the matrix.
The secondary hypothesis that kinetic parameters can be effectively used as an out- put in predicting drug release during ANN modelling has not been substantiated. The simplified structure did not result in a faster generalization of the network, and due to the wide scatter of the output results, small variations in the predicted release rate caused a high degree of uncertainty in the predicted dissolution curves. In contrast, when a point- to-point approach is used, the difference between the observed and predicted data at a given time can be compensated for at other time points. Therefore, applying a point-to- point approach provides greater reliability and more reliable predictions.
Nevertheless, the above-mentioned limitations can be overcome by increasing the number of cases, which makes it possible to fill in the gaps in the training data set. There- fore, the combination of interaction factors and ANN-based modelling may be a promis- ing way to design extended-release products, especially implantable systems with tai- lored dissolution properties.
Figure 7. Observed and predicted dissolution curves of case 43 (a), case 36 (b), case 24 (c) and case 7 (d). Black dots: observed data points; black line: fitted model on observed data; red dots:
predicted data points; red line: fitted model on predicted data points; blue line: predicted model.