Research Article
Development and Characterisation of Modified Release Hard Gelatin Capsules, Based on In Situ Lipid Matrix Formation
Gábor Vasvári,1Bence Csontos,1Tamás Sovány,2Géza Regdon Jr,2Attila Bényei,3Judit Váradi,1 Ildikó Bácskay,1Zoltán Ujhelyi,1Pálma Fehér,1Dávid Sinka,1Thi Le Phuong Nguyen,1
Miklós Vecsernyés,1and Ferenc Fenyvesi1,4
Received 8 February 2018; accepted 8 August 2018
Abstract. A new technology was developed to form extended release hard gelatin capsules, based on the lipid matrix formation of Gelucire 50/13 and cetostearyl alcohol. Matrices were formedin situbyfilling pulverised lipids, ethylcellulose and active ingredients such as diclofenac sodium, acetaminophen and metronidazol into capsules and heating at 63°C for 11 min. Effects of heating were investigated also on the brittleness of capsule shells. Inhibition of the evaporation of water reduced capsule damage. Dissolution tests and texture analysis were performed to discover the release and mechanical profiles of the matrices. Tests were repeated after 1 month storage and results were compared. Gelucire 50/13 alone prolonged drug release but cetostearyl alcohol slowed drug liberation even further. Drug release from all compositions was found to followfirst- order kinetic. Significant softening of the matrices was detected during storage in composition containing only Gelucire 50/13, ethylcellulose and diclofenac sodium. Thermal analysis and IR tests were also performed to discover physicochemical interactions between active pharmaceu- tical ingredients and excipients. Thermal analysis confirmed a notable interaction between diclofenac sodium and Gelucire 50/13 which could be the cause of the observed softening. In conclusion, modified release hard gelatin capsules were developed by a simple and fast monolithic lipid matrix formation method.
KEY WORDS: lipid matrix; in situ matrix formation; Gelucire 50/13; hard gel capsule; dissolution kinetics.
INTRODUCTION
Hard gelatin capsules are well known immediate-release dosage forms with the ease of powder or granulefilling, which makes them the second most preferred dosage form after conventional tablets (1). HGCs are manufactured separately and supplied in various sizes and colours; furthermore, they are often printed. The speed of hard capsule production could be a crucial issue when thefinal formulation of the capsule is considered, since powder and pelletfilling machines are more productive compared to the liquid and semi-solidfilling machines (2,3).
Another reason could be to favour the development of HGCs that they are preferred to befilled with solid or semi- solid (4) dispersion. Dispersions, suspension or solutions are pumped while in molten state then solidifies or at least became semi-solid in the body of the capsule (5). When formulating modified release capsules, the modified release coating of the filled material or the direct coating of the capsule shell is a possibility (6,7). The above-mentioned formulations could either increase the bioavailability of poorly water-soluble drugs or may retard the dissolution of certain drugs (5). Lipid excipients are used in many drug formulations to sustain drug release. The easiest approach is direct compression to tablets. This however is applicable for excipients with high melting points and poor powder flow often requires further technological processes such as wet or dry granulation. Moulding is an alternative method to prolong the release of water-soluble and heat-resistant drugs.
On the other hand, matrix formation by melting technologies is a feasible method for the formulation of poorly water- soluble drugs (8). This method includes the complete melting of the lipid vehicle and the drug must be homogenously dispersed or dissolved in the melt (9). Since 70°C is the upper limit regarding the liquid-fill’s temperature, (2,10) to avoid Electronic supplementary material The online version of this article
(https://doi.org/10.1208/s12249-018-1146-5) contains supplementary material, which is available to authorized users.
1Department of Pharmaceutical Technology, University of Debrecen, Nagyerdei krt. 98., PO Box 78, Debrecen, 4010, Hungary.
2Institute of Pharmaceutical Technology and Regulatory Affairs, University of Szeged, Eötvös u. 6., Szeged, 6720, Hungary.
3Department of Physical Chemistry, University of Debrecen, Egyetem tér 1., Debrecen, 4032, Hungary.
4To whom correspondence should be addressed. (e–mail:
fenyvesi.ferenc@pharm.unideb.hu)
1530-9932/18/0000-0001/0#2018 American Association of Pharmaceutical Scientists
capsule damage, an alternative approach was designed and tested.
The aim of the study was to make a simple, modified release HGC formulation, based on a quick melting step. We determined whether is it possible tofill HGCs with a suitable powder blend composed of an active pharmaceutical ingredi- ent and excipients, preferably lipid materials with relatively low melting range, compatible with gelatin to sustain drug release. Then after capsulefilling, short heating would result in a complete melting inside the shell which, after cooling, result in a solid block providing extended drug release. We chose three different active ingredients as model drugs, namely diclofenac sodium, acetaminophen and metronida- zole, sorted in decreasing aqueous solubility (11,12). The lipid matrix formation was based on the melting and solidification of Gelucire 50/13 (GC) and cetostearyl alcohol (CSA).
Various types of Gelucires, blends of mono-, di- and tri- glycerides and mono- and di-fatty acid esters of PEGs, are used in pharmaceutics. In the field of lipid matrices, compositions prepared by extrusion-spheronisation, melt- pelletisation and other moulding techniques with several active ingredient were investigated before (13–16). To prevent sedimentation of the API in the closed capsule shell, celluloses, such as microcrystalline cellulose, and ethylcellulose (a hydrophobic derivative) as adsorbents were selected and tested. Until date of publishing, no reference was available where the matrix was made by in situ matrix formation, after the capsule shellfilling.
MATERIAL AND METHODS Materials
Gelucire 50/13 (GC) was kindly gifted from Gattefossé (Saint-Priest, France), cetostearyl alcohol (CSA), acetamino- phen (ACP) and metronidazole (MNZ) were Ph. Eur. grade and purchased from Hungaropharma (Budapest, Hungary).
Microcrystalline celluloses (MCC), Vivapur 200, 12 and 100 were gifts from JRS Pharma (Rosenberg, Germany).
Diclofenac sodium (DS) was purchased from Cayman Chem- ical Company (Ann Arbor, Michigan, USA). Ethylcellulose (EC), Ethocel Standard 100 was a kind gift from Colorcon Limited Budapest (Budapest, Hungary). HGCs (Coni-Snap®, size 0) were purchased from Capsugel (Morristown, New Jersey, USA). Other reagents were all of analytical grade and purchased from Sigma-Aldrich Kft. (Budapest, Hungary).
Capsule Tests
Effect of Heating Conditions on the Loss of Drying of the Empty Capsules
It is well known that water content is crucial for maintaining the mechanical properties of gelatine (17) and it has been shown that the structural and mechanical properties of hard gelatin capsules are a function of relative humidity (18). Empty HGC shells were divided into two groups, covered and uncovered. Covered were filled into a glass container with a fixed plastic cap, uncovered were poured into disposable plastic weighing boats. Then, they were placed into the preheated hot-air oven (Memmert SFE 550,
Memmert GmbH, Germany) for 10, 20 and 30 min at 63°C (19). Capsules were weighed and loss of drying was calculated before and instantly after, heating. The changes in the moisture content were also investigated 1 day, 1 week and 1 month after the experiments. For the loss of drying test, HGCs were dried overnight in an oven at 105°C (18).
Effect of Heating on the Brittleness of the HGC
Two different types of experiments were carried out.
Firstly, we did the Tube test, which consists of a 100 g weight dropping on an empty capsule from a height of 8 cm (18). The weight was a stainless steel with a diameter of 245 mm. Then, 150 empty capsules were investigated in 3 groups; uncovered capsule were placed in a glass baker, and covered capsule were placed in a glass baker sealed with aluminium foil and control group. All capsules were heated in oven for 11 min at 63°C except the control. After heating, capsules were allowed to cool down and Tube test was carried out.
In the second experiment, 20 empty shells and 20 shells filled with lactose were heated as described above. After cooling, both groups were tested for cracks and leakage in a friability tester. Rotation speed was 25 rpm. Tests lasted for 4 and 12 min (100 and 300 falls) Capsules were individually visually checked for any crack and powder leakage.
Selection of the Appropriate Adsorbent
We tested the effect of different types of cellulose derivatives as absorbents on the texture of matrices with the following method. The lipids and the celluloses, either EC or different grades of MCC, were homogenised in mortar with a pestle and the blend was filled in the cavities of a PVC/PE/
PvdC blister (diameter 11 mm, depth 8 mm). The blends contained 15% CSA, 40% GC and 45% cellulose derivatives.
Then the blister was placed into a preheated oven (Memmert SFE 550, Memmert GmbH, Germany) for 11 min at 63°C.
The duration and the temperature were established in a preliminary experiment when the complete melting of the materials was confirmed by visual inspection. After 11 min, the blister was taken out and allowed to cool down to room temperature. The formed matrices were extracted, observed visually and their crushing strength was measured with a CT3 texture analyser with a maximum load of 4500 g (Brookfield Engineering Laboratories, MA, USA). Texture Pro CT program was used for the measurements (Brookfield Engi- neering Laboratories, MA, USA). The amount of the absorbent was experimentally determined for each API.
Pulverisation of the Gelucire and the Cetostearyl Alcohol GC and CSA arrived in pellet form. Due to the lower melting range of the GC (around 50°C) (20) compared to the CSA (49–56°C) (21), we cooled the GC between 2 and 8°C, by placing into refrigerator for 24 h. Then the GC was crushed in a precooled mortar and sieved (European Sieve No.355), CSA was crushed without previous cooling and sieved, the pulverised materials were stored at room temper- ature and used for the further experiments.
Preparation of the Sustained Release Capsules
In this study, 6.5 g of each composition shown in TableI were homogenised in a mortar; each empty capsule shells were filled by a manual capsule filling device. After filling, they were heated in the oven for 11 min at 63°C. The capsules lied in a horizontal position in disposable plastic weighing boats. After the melting procedure, the capsules were slowly cooled to 35°C in 5 min by letting cool air inside. Finally, the capsules were allowed to cool to room temperature.
Mechanical Tests of the SR Capsules Three-Point Bending Test
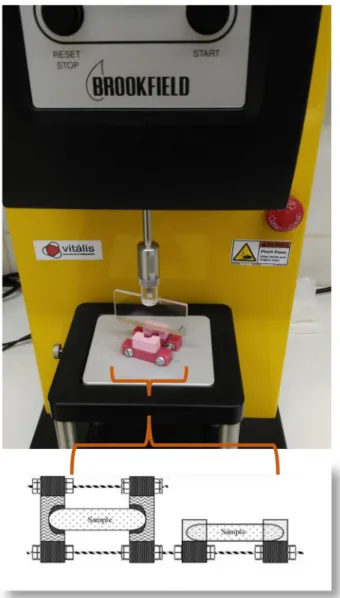
To evaluate the brittleness of the formed matrices, three- point bend test was chosen. A custom-made adjustablefixture was designed and made for the test. The measurements were made with the CT3 texture analyser with a TA7 knife edge probe, the maximum forces to break the blocks in halves was recorded with the Texture Pro CT program. The effect of ageing was also investigated by storing the samples for a month. Samples were stored in air-tight glass containers between 18 and 25°C and at 40–65% relative humidity (18,22). The custom-made fixture and the device set up for the three-point bend test can be seen on Fig.1.
Plasticity Test of the DS Capsules
The texture analyser was equipped with an acrylic cylinder, TA11/1000, (d 25.4 mm) and the device was programmed to compress the blocks with a constant speed (0.50 mm/s) until a 4500 g of resistance is detected, while the programme recorded the distance.
NIR Measurements
A Thermo Scientific Antaris II FT-NIR spectrometer (ThermoFisher Scientific, USA) with an integrating sphere accessory with internal background was used for the spectroscopical investigation of the samples. The resolution
was set to 4 cm−1, the scan number was 128 and H2O and CO2 corrections were applied.
The spectra were evaluated with the use of Spectragryph optical spectroscopy software v1.0.2 (Dr. F. Menges, Berchtesgaden, Germany).
Thermal Analysis
Differential scanning calorimetry (DSC) measurements were performed with a DSC 821e (Mettler-Toledo GmbH, Switzerland) instrument. During the DSC measurements, the start temperature was 25°C, the end temperature was 500°C and the applied heating rate was 10°C min−1. The measurements were performed in an Argon atmosphere (purity = 99.999%, 70 cm3min−1flow rate). Then, 5 ± 1 mg sample was measured into an aluminium pan (40μl). The curves were calculated and were evaluated with STARe Software.
The thermal characteristics of the sample mass loss were determined with a thermal gravimetric analyser TG/DSC1 Table I. Compositions of the Capsules
Formulation API (%) CSA (%) EC (%) GC (%) API content (mg)a
DS1 33 0 7 60 120.29
DS2 33 5 7 55 117.31
DS3 33 10 7 50 121.94
ACP1 33 0 12 55 109.1
ACP2 33 5 12 50 108.34
ACP3 33 10 12 45 111.83
MNZ1 40 0 10 50 155.34
MNZ2 40 5 10 45 149.1
MNZ3 40 10 10 40 150.72
aAPI content was calculated based on the individual weights and the theoretical composition of the capsules. The masses of 20 capsules were measured, and the proportion of API was calculated and expressed in mg
Fig. 1. Brookfield texture analyser with the adjustablefixture, set up for three-point bending tests. The presented adjustable fixture designed and built for the three-point bending test. (40 × 52 × 20, width, depth, height in mms)
(Mettler-Toledo GmbH, Switzerland) operated under N2 atmosphere (purity = 99.999%, 70 cm3 min−1 flow rate).
During the TG measurements, the start temperature was 25°C, the end temperature was 500°C and the applied heating rate was 10°C min−1. Further, 10 ± 1 mg sample was measured into an aluminium pan (100μl).
The curves of DSC and TG results were calculated and were evaluated with STARe Software.
Powder X-Ray Diffraction Study
For the XRPD measurement, the samples were finely powdered. The powder was mixed with minimum amount of CryoOil (Mitegen) and a small ball was formed andfixed on a Mylar loop. The X-ray measurement was performed at 298 (2) K on a Bruker D8 Venture diffractometer with Photon 200 CMOS detector, equipped with a multilayer mirror monochromator and a CuKα INCOATEC IμS micro-focus source (λ= 1.54178 Å). This scans for 360° were collected and the optimised detector distance was 120 mm and data collection time was 60 s. The raw frame data were collected and frames were integrated using the Bruker APEX3 program (v2017.3 *Bruker AXS Inc.).
HPLC Analysis of the DS Capsules
The samples were analysed by a high-performance liquid chromatography (HPLC). The HPLC system Merck-Hitachi ELITE LaCrom consisted of a pump (L-2130), degasser, automated injector, column oven (L-2300) and a photodiode array detector (DAD). The column module was kept at 25°C, and the DAD was set to collect signals within the spectral range of 220–400 nm. The separation of dissolved components DS capsules and the pure API was performed on the Zorbax Eclipse Plus C8, (4.6 × 150 mm, 5.0μm, end-capped) (Agilent, Santa Clara, CA, USA). The injected volume of samples was 20μl. Aflow rate of 1.0 ml min−1was applied. The mobile phase A was an aqueous solution containing 0.5 g/L of phosphoric acid R and 0.8 g/L of sodium dihydrogen phosphate R, adjusted to pH 2.5. Mobile phase B was methanol. The two phases were mixed in a ratio of 34:66 (v/v). The analyses were performed with EZChrome Elith™software (Hitachi, Tokyo, Japan) for collecting and processing data. Fresh samples were compared to stored samples; in this case, the storage time was 2 year, with the same storage conditions as mentioned in‘Three-point bending test’ section. To analyse or detect any degradation product beside pure DS, samples were dissolved in 900 ml of phosphate- buffer solution (pH 6.8) and after filtration (0.2 μm PES membrane filter) were further diluted 10 or 100 times with methanol. This solution was injected.
In vitroDrug Dissolution
Rotating basket method was used for dissolution tests, according to the European Pharmacopoeia, using Erweka DT800 dissolution tester. The rotation speed was 100 rpm, the dissolution medium was simulated intestinalfluid (SIF) without pancreatin and the temperature was maintained at 37
± 0.5°C. As a sample, 4 ml of the dissolution medium was withdrawn at predetermined intervals and the volume of the dissolution medium was kept at 900 ml by adding fresh
medium. Samples were filtered with a 0.45 μm PTFE membrane filter and 0.5 ml of the samples were diluted by adding 4.5 ml of purified water (PW). The released amount of the DS, the ACP and the MNZ was measured spectrophoto- metrically (Shimadzu UV-1601, Shimadzu Corp., Kyoto, Japan) at 276 (23), 243 (24) and 320 (25) nm, respectively.
Three samples from every compositions were tested. Freshly prepared samples and capsules after 1 month storage were also compared.
Mathematical Analysis of the Drug Release Profiles
To determine the similarity or difference between the drug release profiles of the matrices, a model independent approach, similarity, f2 and difference, f1 factor (26) was calculated for each composition after formulation and after 1 month of storage.
Dissolution efficacy (27) was also calculated after formu- lation and after 1 month of storage.
f1¼∑nj¼1Rj−Tj
∑nj¼1Rj 100
wherem is the sampling number,RjandTjare the percent dissolved of the reference and the test products at each time pointj.
f2¼50log h1þð1=nÞ∑nj¼1wjRj−Tj2i−0;5 100
wherewjis an optional weight factor.
DE¼∫t0ydt
y100t100%
whereyis the drug percent dissolved at timet.
To determine the drug release kinetics of APIs from every compositions, release data was fitted to zero-order, first-order and Korsmeyer-Peppas model using non-linear regression in SigmaPlot (Systat Software Inc., USA) (27).
Q ¼ Q0 þ k0t Qt ¼ Q0 e−k1t
Qt
Q∞ ¼ kkptn
where Q is amount of drug release at time t, Q0 is the initial amount of drug, Qt is the amount of drug remaining at timetandQt/Q∞is fraction of drug released at timet. k0,k1and kkp are the kinetic constants for zero- order, first-order and Korsmeyer-Peppas models, respec- tively andn is the release exponent, indicative of the drug release mechanism, (27).
Statistical Analysis
For statistical analysis, SigmaStat software (version 3.1;
SPSS Inc.) was used. Comparison of two groups was
performed by unpairedttest, while comparison of more than two groups was performed using ANOVA. Differences were considered significant atp< 0.05 (28).
RESULTS
Effect of Heating Conditions on the Loss of Drying of the Empty Capsules
The time while the empty shells were kept in constant temperature significantly affected the moisture contents.
Control capsules had 14.1% moisture content which was due to its appropriate storing, in accordance with the supplier’s recommendation (29). By preventing the unwanted water loss, covered capsules still had a 12.97% loss of drying even after 30 min of heating. Without any preventive measures, even 10 min of heating resulted a drop to the LOD value of 9.38%. After 20 and 30 min, the uncovered capsules retained only 7.63 and 7.22% of their moisture.
Effect of Heating on the Brittleness of the HGCs
As a result of the Tube test, 16 uncovered capsules broke compared to the 4 covered broken shells, control capsules were also examined and only three capsules cracked from thefifty. In the modified friability test, no cracks and no powder leakage was found in the case of empty and the lactosefilled shells even after 12 min.
Selection of the Appropriate Adsorbent
Due to their extreme brittleness, matrices with Vivapur 200 and 12 cracked and fall apart even though the careful removal from the PVC blisters. Vivapur 101 and Ethocel Std.
100 hold the structure together. Their crushing strength was 194.5 ± 55.3 and 348.38 ± 40.61 g respectively. Since micro- crystalline cellulose has disintegrant properties (30) and Ethocel Std 100 provided the strongest block, for the further experiments Ethocel Std 100 was used as adsorbent.
Mechanical Tets of the SR Capsules
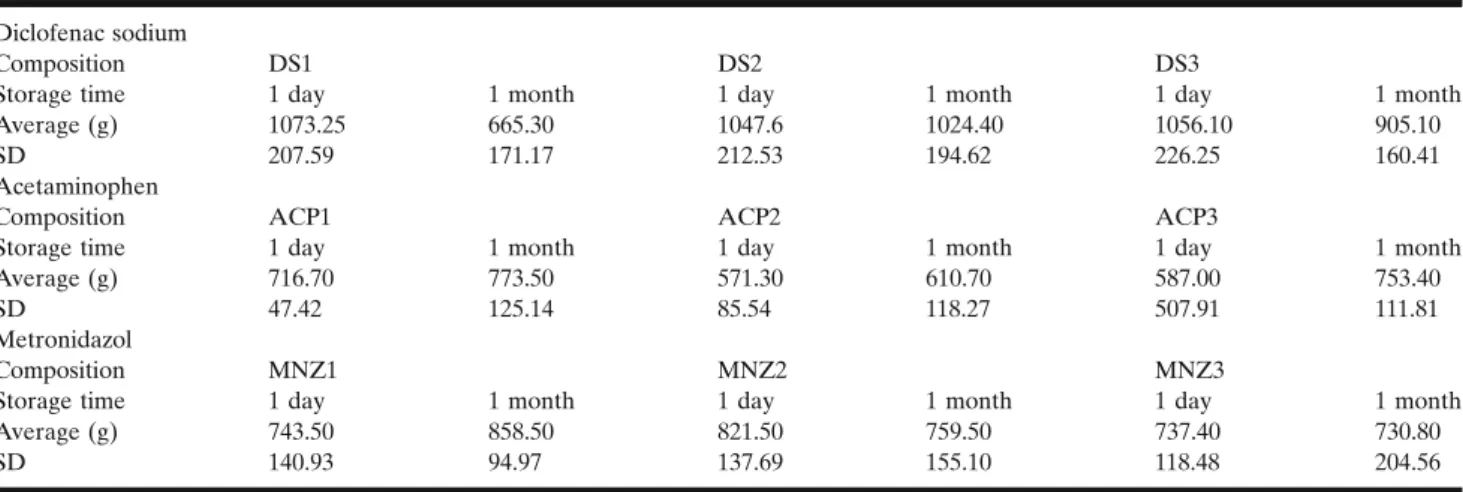
The results of the three-point bend test are shown in TableII. The results, the performedttest and ANOVA showed that short-time storage had no significant effect comparing the ACP formulations (p> 0.05). All of these compositions had an average mechanical resistance greater than 571.3 g. However, one of the examined ACP3 samples had an unforeseen brake in its structure, which resulted in a resistance of 138.5 g and a significantly greater standard deviation. No other compositions or samples showed similar properties throughout the whole research. Investigating the hardness changes upon storage in the cases of the MNZ formulations showed intermediate values comparing the ACP and the DS formulations. Then, 1 month storage caused no significant changes (p> 0.05). Unlike the others, DS formulations, namely DS1, became significantly softer than the DS2 and DS3 after 1 month of storage (p= 0.021). Similar phenomenon was also observed when fresh and stored DS1 was compared (p= 0.023).
To investigate the significant softening found in DS formu- lations (DS1), plasticity tests was performed with the matrices.
Test results are presented in TableIII. Interestingly, the softening
was not significant in the case of DS1 (p> 0.05), but the hardening of the DS2 and DS3 compositions were found to be significant before and after test (p= 0.0236; andp= 0.0052).
Thermal Analysis
The results of the thermal gravimetric analysis (TableIV) proved that all of the APIs and the excipients are stable at the temperature of the experiment; no sign of chemical decompo- sitions or changes were detected under 100°C. The pure ACP and the MNZ melts at 170.84 and 162.32°C. Diclofenac showed an endothermic peak at 290.68°C, which was immediately followed by an exothermic peak (Fig.2a). Based on the TG curve of the API, it is very likely that its melting is associated with thermal decomposition. The DSC curves of the GC and CSA shows wide endothermic peaks at 52.27 and at 56.27°C, respectively which indicates the melting of the excipients.
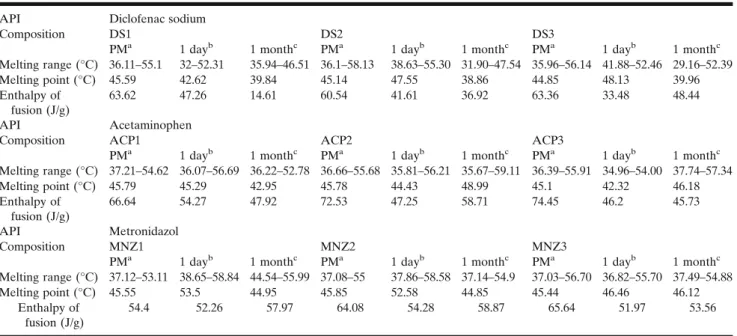
Powder blends of the DS compositions showed endothermic peaks around 45°C (Table V); the DS3 however showed a binary endotherm event, and this is probably due to the 10%
CSA content of the sample. The melting peaks of the lipids during storage slightly shifted below 40°C. Based on the comparison of the enthalpy of fusion, remarkable changes were detected. In the case of DS1, the value decreased from 47.26 to 14.61 J/g, while for DS2 and DS3, such changes were not recorded (TableV). The melting range of the diclofenac sodium also shifted to lower temperatures, namely to 233.65 (Fig.2a), 228.41 and 233.43°C for DS1, DS2 and DS3 and this phenom- enon occurred at the stored samples as well.
ACP also decreased the melting range and the fusion of enthalpy of the GC and CSA, in all cases, (TableV). The APIs melting range was also decreased; however, as the samples containing more and more CSA, the melting peaks got closer to the peak of the pure drug. As the DSC curves of the fresh and stored samples were compared, it was noticed that the melting range of the ACP1 has become narrower from 121.32–172.28 to 124.57–170.76°C. ACP2 and ACP3 showed no similar alterations. The melting peak of the MNZ in our study was found to be at 162.32°C. In contrast to the previous formulations, only slight decrease of the melting point was observed with the MNZ capsules. The melting range broadening was detected only in the case of the stored MNZ1 compared to the fresh one (Fig.2c).
NIR Measurements
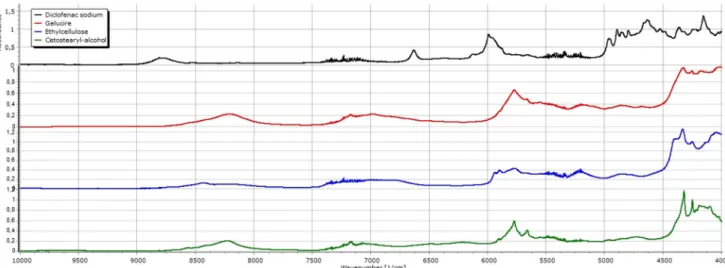
The NIR spectra of the DS compositions present peaks at 4328 1/cm as a result of the overlap of the characteristic signals of GC (4327 1/cm), EC (4333 1/cm) and CSA (4322 1/cm) (Fig. 3). Slight shift can be observed toward lower wavenumbers in the cases of the theoretical spectra as the ratio of the CSA in the matrix increases. These alterations however appear less intensively with the fresh matrices; all relative peak intensities decrease, signal shifts and widening to higher wavenumbers can be seen as a comparison to the peak at 4252 1/cm. A possible explanation is that an interaction could be between EC and GC, and DS might be involved also. During storage, the structure changes continue as relative intensity decreases and the peak at 4328 1/cm widens. Diclofenac also has characteristic peaks at 4798, 4842, 4856 and 4894 1/cm. The relative intensity of thefirst peak is
higher compared to the fourth peak, but during storage, the difference between the two peaks disappeared. The peak’s relative intensity at 4893 1/cm increases in all DS samples, and the ratio of intensity between 4840 and 4857 1/cm sets back as seen at the pure API (Fig.4).
Similar events were recorded with ACP as the appearance of the peak at 4328 1/cm. CSA also shifts the peak toward 4322 1/cm. On the other hand, this overlap and difference between ACP matrices are unimpressive. In the region of 4550–5000 1/cm, ACP has many characteristic signals (4647, 4719, 4895, 4945 1/cm). The wavenumbers and the relative intensities are constant. The double peaks at 5665 and 5771 1/cm are also present, but during storage, peak changes were only detected at 5771 1/cm, peak broadening and decrease in the relative intensity. Overlap of the peak at 5907 1/cm (CSA) and the peak at 5924 1/cm (ACP) results in a wide local maximum intensity (5912 1/cm). This peak appears at the wavenumber character- istic of ACP (5924 1/cm) again in the stored samples.
In the case on MNZ-containing samples, the same overlapping of characteristic peaks of GC, EC and CSA may be observed, but similarly to the ACP-containing samples, the characteristic peaks of MNZ at 5862, 5896, 5932, 6009 and 6061 1/cm remained unchanged both in powder and melted form, and during storage, indicating that there is no interaction between the API and excipients.
PXRD Study
Our pure actives and our freshly prepared samples of formulations were tested by powder X-ray diffraction. As
presented, pure DS were in its crystalline form, the diffractogram is characterised by the presence of principal diffraction lines at 7.3, 8.5, 11.0, 12.5, 15.0, 16.0, 17.0, 19.5, 23.5 25.0 and at 27.5° (2θ) (Supplementary Materials Fig.S1).
In DS1 formulation, lack of characteristic peaks was pre- sented of diclofenac. Pure GC showed only two peaks at 19.25° and 23.4° and as we detected in the tested DS1 formulation only peaks (19.3° and 23.3°) characteristic to the Gelucire were present (31).
We tested our samples (ACP1) and our pure API to determine if there was any phase transition of ACP since the active has polymorphism also (32–34). The pure active gave the following diffraction peaks: 12.1, 13.75, 15.5, 16.7, 18.1, 20.4, 21.5 and 24.4 at 2θ. Fresh ACP1 presented two extra peaks, namely 19.2° and 23.5°, which are characteristic to the Gelucire 50/13.
Fresh MNZ1 sample was also compared with GC and pure MNZ too. Characteristic peaks were present at 12.5, 14.0, 16.2, 17.2, 18.0, 19.5, 20.7, 21.5, 23.2, 24.8, 25.2, 27.2, 28.0, 29.15 29.9 and 33.2° (2θ). Fresh MNZ1 showed the following: 12.2, 13.9, 16.2, 17.2, 18.0, 19.15, 20.7, 21.5, 23.3, 24.8, 25.3, 27.3, 28.0, 29.2, 29.9 and 33.2° (2θ). As the result of these measurements, undissolved fraction of the pure MNZ was still present in the sample.
HPLC Analysis of Degradation Products
The chromatographic evaluation was performed on fresh and stored (2 years old) samples. The chromatograms of the analysis is presented in the Supplementary Materials (Fig.S2).
The separation and the analysis of the degradation product of DS were only detectable in the case of concentrated solutions Table II. Results of the Three-Point Bend Tests
Diclofenac sodium
Composition DS1 DS2 DS3
Storage time 1 day 1 month 1 day 1 month 1 day 1 month
Average (g) 1073.25 665.30 1047.6 1024.40 1056.10 905.10
SD 207.59 171.17 212.53 194.62 226.25 160.41
Acetaminophen
Composition ACP1 ACP2 ACP3
Storage time 1 day 1 month 1 day 1 month 1 day 1 month
Average (g) 716.70 773.50 571.30 610.70 587.00 753.40
SD 47.42 125.14 85.54 118.27 507.91 111.81
Metronidazol
Composition MNZ1 MNZ2 MNZ3
Storage time 1 day 1 month 1 day 1 month 1 day 1 month
Average (g) 743.50 858.50 821.50 759.50 737.40 730.80
SD 140.93 94.97 137.69 155.10 118.48 204.56
All values are in grams and represent the average of the force where matrices are broken (n= 5)
Table III. Test Results of the Plasticity Tests on DS Matrices
Composition DS1 DS2 DS3
Storage time 1 day 1 month 1 day 1 month 1 day 1 month Averagea(mm) 0.65 0.73 0.94 0.65 0.97 0.68
SD 0.16 0.29 0.21 0.10 0.11 0.13
aAll values are in millimetres where 4500 g of resistance was detected (n= 5)
Table IV. Mass Losses of the Excipients and the APIs in TG Measurements
CSA EC GC DS ACP MNZ
Weight loss (%) 0.008 0.377 0.002 0.226 0.102 0.102 Data shows mass losses only between 25 and 100°C
(not more than ten times dilution with methanol). The retention time of the degradation product (small peak) was at 5.6 min (λmax= 265 nm), before the main peak of the API (Rt9.6 mins;
λmax= 275). The AUC values for this impurity was the highest only at 2-year-old DS1 samples, and the ratio of the AUCs of the impurity was less than 0.5% for each samples.
In vitroDrug Dissolution
Figure 5a shows the dissolution profile of the fresh and stored DS capsules. Based on the data, it was confirmed that the Gelucire 50/13 alone slowed the drug dissolution, 81.99% of the API dissolved after 500 min. However, drug release became somewhat faster on storage, 80.65% dissolved in 250 min compared with the starting value of 72.24%. Blending 5 and 10% CSA to the compositions, DS2 and DS3, resulted to prolonged drug release. From the fresh samples, 83.85% (DS2)
and 83.76% (DS3) of the drug dissolved in 750 min. After 1 month of storage, 82.61% dissolved from DS2 in 750 min;
interestingly, 70.73% dissolved from DS3 and drug release did not reach 80% during the test time, 1150 min.
Dissolution profiles of the ACP capsules were plotted in Fig. 5b. Comparing the fresh and stored release data of capsules with Gelucire 50/13 alone (ACP1) in 500 min, 79.48 and 91.00% of the drug dissolved, respectively. Incorporating 5 and 10% of CSA into the matrices (ACP2 and ACP3) slowed the drug dissolution further. Then, 81.98 and 75.30%
of the drug dissolved from the fresh and the stored ACP2 in 600 min, while the release profiles of the fresh and stored ACP3 were practically identical; in 850 min, 81.53 and 81.68% got released from the dosage form.
In Fig. 5c, the drug dissolution results of the MNZ compositions are shown. MNZ has the smallest water solubility among the studied APIs. Without CSA (MNZ1), 81.39% of its drug content released from the fresh sample in 500 min; after storage, the dissolution did not changed remarkably, and 80.50% dissolved from the capsules. With 5% CSA in the matrices (MNZ2), the drug release was very similar at start, 80.66% got released in 500 min; after storing the samples, the dissolved drug fraction decreased to 71.47%.
In the case of MNZ3, the drug release did not alter; in 1150 min, the amount of the dissolved drug was 80.81 and 82.81% for the fresh and the stored samples.
Mathematical Analysis of the Drug Release Profile
Modelfitting results, the dissolution efficacies and results of the pairwise procedure calculations of the different compositions are presented in the Supplementary material TableSIand TableSII.
First-order model was found to be the best model describing DS release from the fresh and the stored matrices.
However, it should be noted that similarity and difference factor calculations of formulation DS3 showed changes after storage, its f1 and f2 was 10.88 and 54.84, respectively. The highest value for the determination coefficient was found in the fresh DS3 sample (R2= 0.9973), but upon 1 month of storage, it decreased to 0.9916 only.
ACP capsulesfitting results showed similar results, namely fresh ACP1 and ACP2 have the highest values (R2= 0.9986), and after 1 month of storage the correlation had no changes;
only a small decrease toR2= 0.9979 and 0.9970, respectively.
The values of the determination coefficients for fresh and stored ACP3 was slightly lower, 0.9953 and 0.9924. Based on the model independent calculations, all of the dissolution profiles were found to be similar.
Model analysis results of the MNZ matrices showed that without storage, thefirst-order modelfitted best to the release data of the composition MNZ1, MNZ2 and MNZ3, R2= 0.9988 and 0.9989 and 0.9997, respectively. After storing the samples for 1 month,first-order model remained to have the highest values of determination coefficients (R2= 0.9958, 0.9977 and 0.9985). When their profiles were compared after storage, the biggest difference was found with composition MNZ2, where f1 and f2 was 10.43 and 57.76, respectively;
notably, the dissolution profiles can be considered similar.
MNZ3 compositions showed no alterations in the results of modelling; first-order remained the best model describing Fig. 2. DSC curves ofaDS, GC and the DS1 compositions,bACP,
GC and the ACP1 compositions andcDSC curves of the MNZ, GC and the MNZ1 compositions. Fresh melted refers to the molten sample stored for 1 day, while the stored melted refers to the molten sample stored for 1 month. PM means the fresh powder mixture of the DS1, ACP1 and MNZ1 respectively. Data was collected between 25 and 500°C
drug dissolution upon storage, and strong similarity (f1 = 1.2;
f2 = 89.21) between the release profiles was also confirmed.
DISCUSSION
We aimed to design and formulate a modified release HGC system, based on a new formulation method within situ lipid matrix formation. We fully characterised not only the properties of the formed lipid matrix, but we tested also the effect of heating on HGCs.
Based on the loss of drying results, we can state that our capsules were stored appropriately and they were fully suitable for our experiments (35). Additionally, our experiment was rather unique by applying short-term heating to the empty shells
and measuring the remaining water content. Interestingly, a trend was noticed where capsule shell lost their moisture primary in the earlier periods. A possible explanation could be that because of heating gelatine becomes hygroscopic and it has a potential to slow down the rate of moisture loss (18).
Interestingly, when the capsules were treated with a relatively short heating at 63°C, significant difference was found between the groups where the capsules were kept in a close container or where not. The authors also want to highlight that Tube test is a very simple method, but only has a pass or failed category concerning its evaluation (18).
Texture analysis may demonstrate high resolution measure- ments, and it is also needed to emphasise that a load cell which can detect and record more than 200 N of tensile force Table V. Thermal Parameters of the Powder Mixtures, the Fresh and Stored Lipid Matrices
API Diclofenac sodium
Composition DS1 DS2 DS3
PMa 1 dayb 1 monthc PMa 1 dayb 1 monthc PMa 1 dayb 1 monthc
Melting range (°C) 36.11–55.1 32–52.31 35.94–46.51 36.1–58.13 38.63–55.30 31.90–47.54 35.96–56.14 41.88–52.46 29.16–52.39
Melting point (°C) 45.59 42.62 39.84 45.14 47.55 38.86 44.85 48.13 39.96
Enthalpy of fusion (J/g)
63.62 47.26 14.61 60.54 41.61 36.92 63.36 33.48 48.44
API Acetaminophen
Composition ACP1 ACP2 ACP3
PMa 1 dayb 1 monthc PMa 1 dayb 1 monthc PMa 1 dayb 1 monthc
Melting range (°C) 37.21–54.62 36.07–56.69 36.22–52.78 36.66–55.68 35.81–56.21 35.67–59.11 36.39–55.91 34.96–54.00 37.74–57.34
Melting point (°C) 45.79 45.29 42.95 45.78 44.43 48.99 45.1 42.32 46.18
Enthalpy of fusion (J/g)
66.64 54.27 47.92 72.53 47.25 58.71 74.45 46.2 45.73
API Metronidazol
Composition MNZ1 MNZ2 MNZ3
PMa 1 dayb 1 monthc PMa 1 dayb 1 monthc PMa 1 dayb 1 monthc
Melting range (°C) 37.12–53.11 38.65–58.84 44.54–55.99 37.08–55 37.86–58.58 37.14–54.9 37.03–56.70 36.82–55.70 37.49–54.88
Melting point (°C) 45.55 53.5 44.95 45.85 52.58 44.85 45.44 46.46 46.12
Enthalpy of fusion (J/g)
54.4 52.26 57.97 64.08 54.28 58.87 65.64 51.97 53.56
These values represent the thermal events related to the melting of the lipid matrices in the formulations with different APIs
aPM powder mixtures
bOne day, freshly prepared lipid matrices
cOne month, lipid matrices stored for 1 month
Fig. 3. NIR spectra of the DS compositions. Fresh melt refers to the molten sample stored for 1 day, while the stored melt refers to the molten sample stored for 1 month. PM means the fresh powder mixture of the different DS compositions
is elementary (36). The mechanical strength of the capsules
can be preserved if preventive step,e.g.closed in fullyfilled containers or humidified hot air as heating medium, is applied. However, when wet air is applied, deformation and sticking of the capsules can occur (35,37). Among critical process parameters, we can mention the high degree of homogeneity of the powder mixture (necessary to develop uniform matrices in shape and strength). Duration and temperature of heating should be well controlled and restricted limits should have to be applied.
Texture analysis has been used earlier as a non-destructive test to examine mechanical properties of empty and filled capsules (36), for the determination of disintegration time of fast-disintegrating tablets (38) or to test the mechanical charac- teristics of medicated chewing gums (39). The three-point test of the DS compositions revealed a hard structure at start, but also a slight softening through its storage. It is well known that drug formulation prepared by melt techniques may alter their drug not only their drug release (9,22,40) but their mechanical properties also. Gelucire 50/13 was found to become softer during storage in previous publications (41,42). In fracturing test, DS1 showed softening during 1-month storage, while the increasing ratio of the CSA in the compositions DS2 and DS3 prevented the softening, and no significant changes was measured during storage. Interestingly, when the plasticity test was evaluated, alteration was detected upon storage, namely hardening of the DS2 and DS3 samples. The difference between thefindings can be explained by the distinct nature of the texture analysis. While the plasticity tests are compressional tests where the whole sample is deformed, the three-point bend is a fracturing test, where defined points of the sample isfixed and the force to break samples in halves is recorded. Structure alterations, caused by lipid ageing or reorganisation of the chains of PEG or fatty acids might be the root cause. As a summary, the more CSA added to the powder, the harder matrices developed upon storage. CSA content of matrices has an impact on dissolution of diclofenac also. Higher (10%) CSA content modified the release of diclofenac and on the other hand, modified the physical properties of the matrices. CSA decreased the plasticity, while without CSA the plasticity did not changed significantly, but the resistant against bending de- creased. It can be explained by the higher cohesion provided by the CSA. CSA has a well-defined chemical structure, while Gelucire is a mixture of different components. Theoretically, increasing the CSA content in the matrices leads to the Fig. 4. NIR spectra of the excipients, Gelucire 50/13, ethylcellulose and cetostearyl-alcohol and diclofenac sodium
Fig. 5. Dissolution curves ofaDS samples,bACP samples,cMNZ samples. All of the curves represent the average of three random samples for each storage time
development of an ordered structure. Regarding the mechanical evaluation of the different compositions, all of the formulations showed to be resistant enough to be transported of the capsules into blisters. To break the weakest matrices (ACP2), the pressure of 571 g should be used, while for the others, especially the MNZ and DS more than 700 or 1000 g would be sufficient.
These could be noteworthy results from a potential dosage form candidate which production lacks any compressional step, plus the observed softening during storage would not alter the matrices to a brittle and sensitive form.
The dissolved material decomposed at 233.65 (Fig.2a), 228.41 and 233.43°C for DS1, DS2 and DS3, and this phenomenon occurred at the stored samples. Compared to its original temperature of decomposition (290.68°C), this is a significant change. In the case of DS1, thermal analysis revealed significant decrease in the enthalpy of fusion during storage, which is in concordance with the texture analysis.
Increasing amount of CSA prevented this effect in DS2 and DS3, but the melting range of DS decreased in each composition. Thesefindings strongly suggest that there is an interaction among DS and GC. The ACP both in the fresh and stored matrices was at least partially dissolved, as the GC decreases in the different compositions the undissolved fraction of the drug increases. Approximately 50% of the original amount of ACP remains in its crystal form. The melting peak shifts was the mostly negligible in the cases of MNZ matrices, but a considerable amount remained in its crystalline state in the matrices.
Based on the NIR measurements, it can be stated that melting results development of intermolecular associations among the moulded excipients and the EC, possibly due to the formation of hydrogen-bonds. This association strengthened while the samples were stored until the measurements. Signs were detected suggesting that DS also involved in this molecular association, while none were for ACP and MNZ. The difference might be a result of the different molecule structure and the distinct strength of hydrogen acceptor/donor groups.
The powder X-ray diffraction study (PXRD) measure- ments demonstrated that only characteristic peaks of Gelucire were present in DS1. Based on the disappearance of the crystalline diclofenac sodium, we can conclude that with our method of manufacture solid solution of diclofenac was formed.
Regarding the PXRD measurements of the ACP1 and the pure active, we detected no phase transition of the active ingredient on the molten matrix. To study the phase transition of the acetaminophen, in a series of experiments by Maniruzzaman et al., variable temperature X-ray powder diffraction measure- ments were performed to determine and detect changes of the acetaminophen. (43) They found that the characteristic crystal- line peak at 24.36° for polymorphic form I shifted to a new a peak position at 24.03° with higher intensity when form II developed. They concluded that this change is a strong evidence of the transition. Based on these result, we can state that form I (monoclinic) acetaminophen was in our samples and the active was also presented in its undissolved form.
According to the biowaiver monograph of this active ingredient, for the metronidazole base only, polymorphism has not been reported (44). As the examination of the diffractograms of MNZ1, GC and pure MNZ shows the active is present in the molten matrix in its undissolved form.
HPLC assay of DS matrices revealed negligible chemical degradation of the API, and no further identification (e.g.
LC-MS) was performed.
As proved by the dissolution profiles, Gelucire 50/13 alone provided a prolonged drug release from the matrices; however, the maximum released drug content did not reach 100% release from DS formulations. Possible explanations could be that the Gelucire and the cetostearyl alcohol kept it physically entrapped. An earlier study showed that diclofenac-Gelucire 50/13 solid dispersion provides faster drug release compared to the physical mixture (45,46). The reason why drug release has accelerated during storage in the case of DS1 is that the API dissolved in the lipid matrix or because of the ageing, fatty acid or PEG chain reorganisations of the Gelucire 50/13 as the main meltable component (47). The interaction between DS and GC observed in thermal analysis can explain the accelerated dissolution. Interestingly, ACP and GC have a similar interac- tion. This is in concordance with a previous observation when ACP was added to hot and molten GC and stored for weeks.
Rapid release compared to the fresh samples was also noticed (48). A clear evidence of the effect of CSA on decreasing the drug release rate is presented on Fig.5, since the hydrophobic excipients decreased both water uptake and the water- penetration into the dosage form (49,50). Based on the drug dissolution data, we can state that as the APIs water solubility increases, the dissolution rates from the presented formulations also increased. As model calculations showed,first-order model was found to describe the drug dissolution from all of the matrices. Thefirst-order describes drug release through diffu- sion mechanism, and it has been used to describe drug dissolution from systems such as matrix tablets containing water-soluble drugs (9,51). The authors would also like to emphasise that drug release from Gelucire 50/13 could be due to matrix erosion and swelling. Dissolution of various APIs from multi-component systems is the resultant of complex phenom- enon where, in most of the cases, matrix swelling and erosion could simultaneously occur with the diffusion of the dissolved drug through the microchannel system of the dosage form. Our study was performed to prove that lipid matrix formation can be accomplished afterfilling and closing the capsule shell and might open a new path to formulate sustained-release dosage forms.
Difference and similarity factors are frequently used to compare dissolution data (26,27,52). Both equation is used and recommended by the FDA; however, f2 is the preferred one (52). Values between 0 and 15 for f1 and between 50 and 100 for f2 factor ensure similarity between dissolution curves (27). Based on the author’s calculations, similarity between the release curves can be declared. As described earlier, lipid materials often age during storage. However, the effect of ageing was investigated before (22,47), and no publications were found whether the alterations can be prevented by excipients. Since the structural and crystalline properties of complex bases are not fully understood, more research and studies should be done to discover proper solutions.
CONCLUSION
In this study, we developed a new method and technology to alter drug release from HGCs without dissolving or dispersing the API in molten material and liquid-fill the shells. We successfully extended the drug release by in situ melting and lipid matrix
formation. Capsule studies proved that heating conditions must be considered cautiously, but short-term heating can be per- formed on HGCs without becoming brittle. Texture analysis revealed that formed matrices are resistant to bear the stress of further technological processes, such as transferring from or to bulk containers of bags and blistering. Thermal analysis con- firmed that no thermal degradation occurred at 63°C, and the lowest temperature where degradation started was at 200°C. This platform may be useful to pharmaceutical technologists and researchers to turn to innovative results.
ACKNOWLEDGEMENTS
Ágnes Hajdu from Azelis Hungary is acknowledged for providing the continuous contact with Gattefossé and sup- pling Gelucire samples. Last but not least, Erik Schwendtner from Colorcon Hungary is gratefully thanked for providing free sample and information about the applications of different Ethocel grades.
FUNDING
This paper was supported by the János Bolyai Research Scholarsip of the Hungarian Academy of sciences (BO/00290/
16/5). The publication is supported by the EFOP-3.6.1-16- 2016-00022 projects. The project is co-financed by the European Union and the European Social Fund. This research was also supported by the European Union and the State of Hungary, co-financed by the European Social Fund in the framework of GINOP-2.3.2-15-2016-00043.
REFERENCES
1. Duconseille A, Astruc T, Quintana N, Meersman F, Sante- Lhoutellier V. Gelatin structure and composition linked to hard capsule dissolution: a review. Food Hydrocolloid. 2015;43:360– 76.https://doi.org/10.1016/j.foodhyd.2014.06.006.
2. Stegemann S, Capsugel B. Hard gelatin capsules today - and tomorrow, 2nd edn. Capsugel Library, BAS 192 E 2002;1–23.
3. Niederquell A, Kuentz M. Introduction of a theoretical splashing degree to assess the performance of low-viscosity oils infilling of capsules. AAPS PharmSciTech. 2011;12(1):323–30.
https://doi.org/10.1208/s12249-011-9589-y.
4. Sultana M, Butt MA, Saeed T, Mahmood R, Ul Hassan S, Hussain K, et al. Effect of rheology and poloxamers properties on release of drugs from silicon dioxide gel-filled hard gelatin capsules-a further enhancement of viability of liquid semisolid matrix technology. AAPS PharmSciTech. 2017;18(6):1998–2010.
https://doi.org/10.1208/s12249-016-0674-0.
5. Serajuddin ATM. Solid dispersion of poorly water-soluble drugs: early promises, subsequent problems, and recent break- throughs. J Pharm Sci. 1999;88(10):1058–66. https://doi.org/
10.1021/Js980403l.
6. Pissinati R, Oliveira WP. Enteric coating of soft gelatin capsules by spouted bed: effect of operating conditions on coating efficiency and on product quality. Eur J Pharm Biopharm. 2003;55(3):313–21.
https://doi.org/10.1016/S0939-6411(03)00002-X.
7. Gullapalli RP. Soft gelatin capsules (Softgels). J Pharm Sci.
2010;99(10):4107–48.https://doi.org/10.1002/jps.22151.
8. Semjonov K, Kogermann K, Laidmae I, Antikainen O, Strachan CJ, Ehlers H, et al. The formation and physical stability of two-phase solid dispersion systems of indomethacin in supercooled molten mixtures with different matrix formers. Eur J Pharm Sci.
2017;97:237–46.https://doi.org/10.1016/j.ejps.2016.11.019.
9. Rosiaux Y, Jannin V, Hughes S, Marchaud D. Solid lipid excipients—matrix agents for sustained drug delivery. J Control Release. 2014;188:18–30.https://doi.org/10.1016/j.jconrel.2014.06.004.
10. Karanth H, Shenoy VS, Murthy RR. Industrially feasible alternative approaches in the manufacture of solid dispersions:
a technical report. AAPS PharmSciTech. 2006;7:E31. https://
doi.org/10.1208/pt070487.
11. Llinas A, Burley JC, Box KJ, Glen RC, Goodman JM.
Diclofenac solubility: independent determination of the intrinsic solubility of three crystal forms. J Med Chem. 2007;50(5):979– 83.https://doi.org/10.1021/jm0612970.
12. Yalkowsky SH, He Y, Jain P. Handbook of aqueous solubility data. 2nd ed. Boca Raton: CRC Press; 2010.
13. Siepmann F, Muschert S, Flament MP, Leterme P, Gayot A, Siepmann J. Controlled drug release from Gelucire-based matrix pellets: experiment and theory. Int J Pharm. 2006;317(2):136–43.
https://doi.org/10.1016/j.ijpharm.2006.03.006.
14. Eloy JD, Saraiva J, de Albuquerque S, Marchetti JM. Solid dispersion of Ursolic acid in Gelucire 50/13: a strategy to enhance drug release and Trypanocidal activity. AAPS PharmSciTech.
2012;13(4):1436–45.https://doi.org/10.1208/s12249-012-9868-2.
15. Guimaraes TF, Comelli ACC, Tacon LA, Cunha TA, Marreto RN, Freitas LAP. Fluidized bed hot melt granulation with hydrophilic materials improves Enalapril maleate stability.
AAPS PharmSciTech. 2017;18(4):1302–10. https://doi.org/
10.1208/s12249-016-0593-0.
16. He Y, Johnson JLH, Yalkowsky SH. Oral formulation of a novel antiviral agent, PG301029, in a mixture of gelucire 44/14 and DMA (2: 1, wt/wt). AAPS PharmSciTech. 2005;6:E1.https://
doi.org/10.1208/pt060101.
17. Kozlov PV, Burdygina GI. The structure and properties of solid gelatin and the principles of their modification. Polymer.
1983;24(6):651–66.https://doi.org/10.1016/0032-3861(83)90001-0.
18. Ku MS, Li WY, Dulin W, Donahue F, Cade D, Benameur H, et al. Performance qualification of a new hypromellose capsule:
part I. Comparative evaluation of physical, mechanical and processability quality attributes of Vcaps plus (R), Quali-V (R) and gelatin capsules. Int J Pharm. 2010;386(1–2):30–41.https://
doi.org/10.1016/j.ijpharm.2009.10.050.
19. Hawley AR, Rowley G, Lough WJ, Chatham S. Physical and chemical characterization of thermosoftened bases for molten filled hard gelatin capsule formulations. Drug Dev Ind Pharm.
1992;18(16):1719–39.https://doi.org/10.3109/03639049209040898.
20. Bourret E, Ratsimbazafy V, Maury L, Brossard C. Rheological behaviour of saturated polyglycolysed glycerides. J Pharm Pharmacol. 1994;46(7):538–41.
21. Wong LP, Gilligan CA, Po ALW. Preparation and characteriza- tion of sustained-release ibuprofen-cetostearyl alcohol spheres.
Int J Pharm. 1992;83(1–3):95–114.
22. Khan N, Craig DQM. Role of blooming in determining the storage stability of lipid-based dosage forms. J Pharm Sci.
2004;93(12):2962–71.https://doi.org/10.1002/jps.20210.
23. Ofori-Kwakye K, Mfoafo KA, Kipo SL, Kuntworbe N, Boakye- Gyasi ME. Development and evaluation of natural gum-based extended release matrix tablets of two model drugs of different water solubilities by direct compression. Saudi Pharm J.
2016;24(1):82–91.https://doi.org/10.1016/j.jsps.2015.03.005.
24. Uchimoto T, Iwao Y, Takahashi K, Tanaka S, Agata Y, Iwamura T, et al. A comparative study of glycerin fatty acid ester and magnesium stearate on the dissolution of acetaminophen tablets using the analysis of available surface area. Eur J Pharm Biopharm.
2011;78(3):492–8.https://doi.org/10.1016/j.ejpb.2011.01.014.
25. Kumar PM, Ghosh A. Development and evaluation of metro- nidazole loaded microsponge based gel for superficial surgical wound infections. J Drug Deliv Sci Tech. 2015;30:15–29.https://
doi.org/10.1016/j.jddst.2015.09.006.
26. Polli JE, Rekhi GS, Augsburger LL, Shah VP. Methods to compare dissolution profiles and a rationale for wide dissolution specifications for metoprolol tartrate tablets. J Pharm Sci.
1997;86(6):690–700.https://doi.org/10.1021/Js960473x.
27. Costa P, Manuel J, Lobo S. Modeling and comparison of dissolution profiles. Eur J Pharm Sci. 2001;13(2):123–33.
https://doi.org/10.1016/S0928-0987(01)00095-1.
28. Reti-Nagy K, Malanga M, Fenyvesi E, Szente L, Vamosi G, Varadi J, et al. Endocytosis offluorescent cyclodextrins by intestinal Caco-