Article
The Influence of the Knowledge-Based Network
Structure Hole on Enterprise Innovation Performance:
The Threshold E ff ect of R&D Investment Intensity
Jiajia Hao1, Chunling Li1,*, Runsen Yuan1, Masood Ahmed2,3 , Muhammad Asif Khan3,* and Judit Oláh4,5
1 School of Economics and Management, Yanshan University, Qinhuangdao 066004, China;
zcyjy2012@163.com (J.H.); yuanrunsen@163.com (R.Y.)
2 Lee Kuan Yew School of Public Policy, National University of Singapore, Kent Ridge, 469C Bukit Timhah Road, Singapore 259772, Singapore; e0009120@u.nus.edu
3 Faculty of Management Sciences, Department of Commerce, University of Kotli, Azad Jammu and Kashmir, City Kotli 11100, Pakistan
4 Institute of Applied Informatics and Logistics, Faculty of Economics and Business, University of Debrecen, 4032 Debrecen, Hungary; olah.judit@econ.unideb.hu
5 TRADE Research Entity, North-West University, Vanderbijlpark 1900, South Africa
* Correspondence: lclbbsyh@163.com (C.L.); khanasif82@uokajk.edu.pk (M.A.K.)
Received: 4 July 2020; Accepted: 27 July 2020; Published: 30 July 2020
Abstract: The purpose of innovation is to consume fewer natural resources in order to create sustainable performance; therefore, innovation can ease the pressure of the ecological load and promote the sustainable development of the economy. Taking the 269 enterprises listed on the main board of the electronic information industry from 2010 to 2019 as samples, using the threshold panel data model, the nonlinear relationship between the knowledge-based network structure hole and the short-term and long-term innovation performance of the enterprises were studied, and the threshold effect of R&D investment intensity was discussed. When the R&D investment intensity is from 1.96% to 15.96%, the knowledge-based network structure hole has a significant positive impact on short-term innovation performance. When the R&D investment intensity is from 5.72% to 10.64%, the knowledge-based network structure hole has a significant positive effect on long-term innovation performance. Lower R&D investment intensity can make the knowledge-based network structure hole promote the increase of short term innovation performance, but to make the knowledge-based network structure hole have a positive impact on long term innovation performance, the R&D investment intensity should be increased by more than 5.72%. When R&D investment intensity is not higher than 15.96%, the knowledge-based network structure hole has a significant positive impact on short term innovation performance, but to make the knowledge-based network structure hole maintain the positive effect on long term innovation performance, R&D investment intensity should not exceed 10.64%. Therefore, enterprises should be guided to optimize the knowledge-based network structure according to the R&D investment intensity in order to improve the short term and long-term innovation performance of an enterprise. These research results can help enterprises to save resources and promote the sustainable development of the economy.
Keywords: knowledge-based network; structural hole; R&D investment intensity; innovation performance; threshold effect
Sustainability2020,12, 6155; doi:10.3390/su12156155 www.mdpi.com/journal/sustainability
1. Introduction
As the contradiction between the resource environment and economic development becomes increasingly prominent, people will gradually realize that ecological carrying capacity has become the endogenous variable and the rigid constraint condition of sustainable economic development [1].
The size of ecological carrying capacity determines the industrial type and industrial spatial layout of a region [2]. Ecological carrying capacity refers to the "maximum load of human economic and social development" under the constraints of resources, environment, natural ecology, and social and cultural factors in a certain region [3]. Only by coordinating industrial development and ecological carrying capacity can we ensure the sustainable development of the social economy. The rapid development of manufacturing technology, the uncertain market environment and excessive ecological pressure force enterprises to carry out technological innovation. Innovation is the foundation of industrial development, so the purpose of innovation is to use fewer resources to create more performance.
Global externalization can be an effective approach to acquiring access to worldwide knowledge.
In the era of the knowledge economy, the key factor for enterprises to gain competitive advantage is their ability to apply knowledge [4], and the essence of enterprise innovation is the acquisition, utilization and integration of knowledge [5,6]. The knowledge possessed by the enterprise includes the knowledge acquired from a network generated by voluntarily cooperating innovators [7], as well as the knowledge created by the enterprise itself, and knowledge management capabilities can influence a firm’s performance and industry-university-research cooperation [8–10]. From the perspective of a knowledge foundation, an enterprise is a collection of knowledge elements. The existing knowledge elements constitute the knowledge foundation of an enterprise. Technological innovation is the recombination of knowledge foundation elements. The process of the recombination of knowledge foundation elements can generate new knowledge, and it is also the formation process of the knowledge-based network structure [11,12]. The enterprise knowledge-based network structure hole reflects the closeness of the connection among the knowledge elements in the knowledge-based network structure. The larger the knowledge-based network structure hole, the more diversified the knowledge-based network structure, and the lower the correlation between the knowledge-based elements, the more obvious the tendency for an enterprise to break through the boundaries of the knowledge base for exploratory innovation. The smaller the network structure hole, the more convergent the basic network structure; the higher the correlation among the basic elements, the more inclined enterprises are to combine the existing basic elements of knowledge and implement innovation. The knowledge base element occupying the position of the structural hole can enable the enterprise to break through the boundaries of the original knowledge base element, to create new knowledge, and to reduce the risk and cost of knowledge creation. When the network formed by the enterprise’s knowledge base elements occupies fewer structural holes, the enterprise is limited by the knowledge base, and it is difficult to obtain information and resources, which leads to an increasing cost of knowledge creation. Therefore, the knowledge-based network structure hole has an increasing significance for enterprise innovation performance, which has attracted extensive attention from scholars [13–16]. In addition, the source of knowledge creation and technological innovation is R&D investment. The intensity of R&D investment has an important role in promoting the formation of the knowledge-based network structure, and it has an important impact on the process of the knowledge-based network structure hole affecting corporate innovation performance.
Although scholars have conducted relevant research about the impact of the knowledge-based network structure hole on innovation performance, there are the following deficiencies. Existing studies mostly use linear relationships to judge the impact of the knowledge-based network structure hole on innovation performance, but ignore the indirect impact of R&D investment and do not consider that the dynamic changes of R&D investment can also impact the short-term and long-term innovation performance. Given the above shortcomings, we first used the threshold effect model to determine whether there is a linear or nonlinear relationship between the knowledge-based network structure hole and the short-term and long-term innovation performance, and then examined the impact of the
knowledge-based network structure hole on short-term and long-term innovation performance in different R&D investment intensities. We deeply analyzed the mechanism of the knowledge-based network structure hole in enterprise innovation performance. This paper provides a reference for enterprises to choose to build a diversified or converged knowledge-based network structure and formulate short-term and long-term R&D investment plans.
2. Literature Review and Hypothesis
2.1. Ecological Carrying Capacity and Innovation
Ecological carrying capacity is the application of the carrying capacity concept to the field of ecology. It takes the ecosystem as the carrier and the external interference as the carrying object [17]. It is an objective reflection of the natural system regulating itself and maintaining ecological balance [18].
However, the ecological carrying capacity is not fixed; it is directly related to a specific historical development stage and the level of social and economic development [17,19]. Therefore, ecological carrying capacity is dynamic, and human beings have subjective initiative, which is the key to improving regional carrying capacity and achieving sustainable development [3,20].
The ecological carrying capacity is an indispensable material basis and premise for industrial development. Industrial development requires a certain supply of raw materials, but the number of natural resources and ecological environmental conditions is limited. When industrial development is too extensive, a series of resource exhaustion and environmental pollution will appear. Ecological destruction harms the ecological carrying capacity. When ecological carrying capacity exceeds the upper limit, regional ecological security is threatened. At this time, ecological carrying capacity becomes a constraint for industrial development, and industry optimization is required; in turn, the improvement of resource utilization efficiency, technological progress and lifestyle changes will promote the continuous optimization of industrial development, and can effectively promote ecological carrying capacity. Innovation can affect a firm’s export behavior [21], and can also change people’s lifestyles, promote scientific and technological progress, improve resource utilization efficiency, coordinate industrial development with ecological carrying capacity, and ensure the sustainable development of ecosystems and social systems.
2.2. Knowledge-Based Structures
Cantner, et al. [22] pointed out that the knowledge base of an enterprise includes the knowledge and experience accumulated by the enterprise in the past, but even if they are in the same industry or the same technical field, the different characteristics of the knowledge base will be formed due to different capabilities and ways of absorbing and spreading knowledge [22]. In the process of technological innovation, only by combining the existing knowledge base can the enterprise maximize its innovation performance. Modern technology innovation theory holds that knowledge architecture is more important than knowledge components [23,24]; that is, in the process of technological innovation, the importance of the knowledge foundation elements themselves is far less than the importance of the internal relationship formed between the knowledge foundation elements. The internal connection between the elements of the knowledge foundation is the enterprise’s knowledge structure. Besides this, the knowledge base elements belong to different clusters. The knowledge base elements within the same cluster are coupled through a series of rules, and the knowledge base elements between different clusters are directly or indirectly connected according to another relationship; thus, the internal knowledge-based network structure forms [11,25]. The knowledge-based network structure is formed by a collection of enterprise knowledge base elements according to their corresponding rules.
According to graph theory and complex network methods, the internal knowledge-based network structure can be constructed, and its overall characteristics can be analyzed. The characteristics of the knowledge-based network structure can reflect the core technology, organizational structure and production procedures of the enterprise [26], and represents the organizational form of the enterprise
resources [27]. By improving the efficiency of knowledge reorganization by optimizing the knowledge infrastructure of the enterprise, new knowledge can be created and innovation performance can be improved [28]. Therefore, the characteristics of the knowledge-based network structure become an entry point for analyzing the impact of the knowledge base on innovation performance.
2.3. The Enterprise Knowledge-Based Network Structure Hole and Innovation Performance
Burt [29], a well-known sociologist and professor of sociology and strategy at the University of Chicago Business School, defined the structural hole. He pointed out that a structural hole (SH) is a buffer, which is equivalent to an insulator in a wire or cable. The benefits of two related persons who have a structural hole between each other can contribute to the network without overlapping [29].
The essence of the structural hole is the non-repetitive relationship between the two contacts. If it can occupy the position of a structural hole in the network, this point can obtain important information in different clusters, which can promote the propagation of information in the network [30]. At the same time, the node occupying the position of the structural hole can obtain more heterogeneous information and realize the cross-domain transfer of knowledge. Enterprise innovation often comes from the cross-domain intersection of knowledge [31]. However, in the process of innovation, different enterprises have different capabilities for searching and refining knowledge [28,32], which leads to a nonlinear relationship between the knowledge base and innovation performance [33]. The structural hole has the role of a ‘bridge’ in the knowledge-based network structure. A structural hole can enable an enterprise to cross the limits of knowledge types and create more new knowledge. According to the definitions of exploratory innovation and exploitative innovation, a knowledge-based network structure hole has a different important role. At the same time, the creation of new knowledge is also different because of different learning abilities, so the impact of the structural hole on innovation is also regulated by knowledge absorptive capacity. Among these, when the structural hole has a positive effect on exploitative innovation, the absorptive capacity plays a negative adjustment role. When the structural hole has a positive effect on exploratory innovation, the absorptive capacity plays a positive adjustment role [34]. Furthermore, the structural hole has a ‘bridge’ role in the enterprise relationship network. When an enterprise occupies a structural hole position in a relational network, the enterprise can control and use more information, and can make full use of external knowledge to promote the development of new products. However, occupying too many structural hole positions will increase the enterprise’s public relations costs, and the ability to transfer, absorb and transform into new knowledge will be reduced, which will hurt the innovation performance; that is, there is an inverted U-Curve relationship between the structural hole and innovation performance [35].
From the perspective of knowledge searching and transferance, when the knowledge-based network structure hole is small, the correlation between the knowledge base elements is too high, and the enterprise will appear to rely on technology, which is conducive to a mature enterprise to maintain the existing market, but is not conducive to the improvement of corporate innovation performance.
When the Knowledge-based network structure hole increases, there is a small difference between the various knowledge base elements. The enterprise can take advantage of the structure hole to obtain, transform and use the knowledge base to create new knowledge and improve innovation performance;
however, when the knowledge-based network structure hole continues to increase, the difference between the knowledge base elements increases and the similarity decreases. As a result of the infinite increase in the structure hole, each knowledge base element becomes an isolated node, and there is no connection between nodes. There is no similarity between the knowledge elements. Every additional innovation in an enterprise starts from a zero basis, so the cost and risk of innovation by an enterprise increase greatly, which adversely affects the innovation performance. Based on the above analysis, the following hypothesis is proposed:
Hypothesis H1: there is a nonlinear relationship between the knowledge-based network structure hole and innovation performance.
2.4. Research and Development Investment and Innovation Performance
The impact of R&D investment on innovation performance has always been a hot topic in the field of technological innovation research. R&D investment is the basis for an enterprise to create new products, new processes, new designs and new technologies, and it plays an important role in improving the enterprise’s technological level and performance. However, different levels of R&D investment have different effects on innovation performance; that is, there is a threshold effect on the impact of R&D investment on innovation performance. Only when an enterprise’s R&D investment exceeds a certain value can it have a positive impact on innovation performance, but there is an optimal R&D investment range, beyond which continuing to increase R&D investment will harm the enterprise’s innovation performance [36]. When R&D investment is in the appropriate range, the impact of R&D investment on performance is positive. The direct performance of an enterprise’s R&D management is a jump. An enterprise dynamically adjusts the allocation of R&D resources according to internal and external environments, and improves performance by changing the type of innovation according to the level of external marketization [37,38]. It is also vital that the interaction of innovation and technology with well-functioning institutions can accelerate economic development [39]; Lakner, et al. [40] recommend that boosting the effect of the state is a necessary development of R&D activity even in branches dominated by large-scale enterprises. Vekic, et al. [41]
document that sustainable measures, particularly those of academic start-up and spin-offcompanies, have a very important role in sustainable economic growth (local, national and regional), and are a significant driver of innovation.
Unlike general investment, R&D costs and innovation performance are different in different stages.
The higher the enterprise’s R&D goals and the further away from the market, the less knowledge base is available. There are knowledge nodes in the knowledge-based network that are less relevant to other knowledge elements; that is, there are structure holes in the knowledge-based network structure which hinder information mobility. As a result, innovation risk increases, and increasing R&D investment will not optimize the knowledge-based network structure. Therefore, the knowledge-based network structure negatively affects enterprise innovation performance. With the increase of R&D investment, the enterprise’s R&D capabilities increase, the knowledge stock increases, and the correlation between nodes in the knowledge-based network also increases. The structure hole links the knowledge base elements to make the information flow more smoothly. At this time, the process of R&D is moving backward close to the market, and the risk of innovation reduces. Therefore, the increase of R&D investment has optimized the structure of the knowledge-based network, and the structure hole has a positive effect on enterprise innovation performance. With different R&D investments, a knowledge-based network structure hole in innovation has different impacts on enterprise innovation performance. Based on the above analysis, the following hypotheses are proposed:
Hypothesis H2a:R&D investment has a threshold role in the impact of a knowledge-based network structure hole on innovation performance.
Hypothesis H2b:when the R&D investment is small, the knowledge-based network structure hole negatively affects the innovation performance of an enterprise.
Hypothesis H2c:when the R&D investment exceeds a certain range, the knowledge-based network structure hole positively affects the innovation performance of the enterprise.
3. Research Design
3.1. Sample Selection and Data Collection
The electronic information industry is developing rapidly, with rich experience in technological innovation. Further enhancing independent innovation capabilities and developing core technologies are the focuses of enterprise. Invention patents have higher technological innovation and power stability. At the same time, they are widely recognized by international patent organizations. This article takes A-share listed enterprises on the main board of the electronic information industry as the research object, obtaines patents of electronic information industry enterprises for five years from 2010 to 2019 from the ‘National Key Industry Patent Information Service Platform’ database, and constructs a knowledge-based network structure referring to previous research [42,43]. Other data were obtained from the CSMAR database. Excluding the samples with missing values, a total of 269 valid samples were obtained. All continuous variables were minimized at a 99% level.
3.2. Dependent Variable
This paper uses C2R, a fractional programming model, which can be transformed into its equivalent linear programming problem referring to the two-stage DEA research method for high-tech enterprise technological innovation performance proposed by Han, et al. [44].
Using a fractional programming model, we can calculate efficiency, which reflects innovation performance better than mere quantitative indicators. At the same time, we can choose the lag time to meet the requirements of the lag period, so we chose a fractional programming model.
In addition, there is no requirement for the dimension of the index to facilitate data collection.
However, for fractional programming problems, the solution process is very complicated, and there may be no effective solution. Only by introducing relaxation variables can it be transformed into a linear programming problem and solved.
The innovation performance of enterprises in the electronic information industry was calculated according to the method of the second stage in the article. In the model, there are decision-making units to be evaluated; each decision-making unit has input items and output items, and the output efficiency of each decision-making unit is determined. We treat the output efficiency of each decision-making unit as a surrogate variable for innovation performance. Formula (1) shows the specific mathematical model. The variables in Formula 1 are explained in Table1.
h∗p=Max
Ps r=1
uryrp
Pm
i=1
vixip
s.t.
Ps r=1
uryr j Pm i=1
vixi j
≤1
ur≥ε >0 r=1, 2,. . .s vr≥ε >0 i=1, 2,. . .m j=1, 2,. . .m
(1)
The solution process of the fractional programming model is very cumbersome, and there may be no effective solution. Therefore, according to the study, the fractional programming model was converted into linear programming, and the relaxation variable was introduced. The final calculated output efficiency value is between 0 and 1.
Table 1.Definition of each variable in the model.
Variable Variable Definition
xi j Thei-th input in thej-th decision-making unit yr j Ther-th output in thej-th decision-making unit
vi The weights of thei-th input
ur The weights of ther-th output
ε A positive number tending to 0, the Archimedes number h∗p The relative efficiency value of thep-th decision unit
According to the characteristics of technological innovation, drawing on the research of Zhang [45], the input indicators include selling expenses, operating costs, the total number of scientific researchers and the total number of non-scientific personnel; the output indicators include the operating income and operating profit. Taking full account of the time lag from input to output, in this paper, the data of the innovative output indicators lag one period. Due to the different types of indicators, the data calculation is complicated. To facilitate the calculation, this paper takes the logarithm of the original data as the base.
3.3. Independent Variable
Drawing on the research of Yayavaram and Ahuja [46], the knowledge base is regarded as a network; the nodes represent the knowledge-based elements, and the edges represent the connections between the knowledge-based elements [46]. According to the International Technology Classification Standard (IPC), patent technology is divided into parts, divisions, large classes, small classes, main groups, and groups. This paper classifies them according to the technical standards of large classes. If an enterprise’s patented technology belongs to two large classes, there is a connection between the knowledge base elements; in other words, there is a connection between the two nodes. As shown in Figure1, nodes 1, 2, 3 and 4 respectively represent the types of large classes in the technical classification standard, which are called knowledge-based elements. When a patent technology belongs to both the 1 and 3 categories, a connection will be formed between the two knowledge-based elements. When a patent technology belongs to both the 1 and 4 categories, a connection will be formed between the two knowledge-based elements, and the formation principle of other connections is the same.
This paper builds an enterprise knowledge-based network through UCINNET 6.0. UCINNET is a network analysis integration software, though which we can visualize the relationship matrix between the knowledge base elements to network, and we can also calculates the structure hole of the knowledge-based network.
Sustainability 2020, 12, x FOR PEER REVIEW 7 of 17
operating income and operating profit. Taking full account of the time lag from input to output, in this paper, the data of the innovative output indicators lag one period. Due to the different types of indicators, the data calculation is complicated. To facilitate the calculation, this paper takes the logarithm of the original data as the base.
3.3. Independent Variable
Drawing on the research of Yayavaram and Ahuja [46], the knowledge base is regarded as a network; the nodes represent the knowledge-based elements, and the edges represent the connections between the knowledge-based elements [46]. According to the International Technology Classification Standard (IPC), patent technology is divided into parts, divisions, large classes, small classes, main groups, and groups. This paper classifies them according to the technical standards of large classes. If an enterprise's patented technology belongs to two large classes, there is a connection between the knowledge base elements; in other words, there is a connection between the two nodes.
As shown in Figure 1, nodes 1, 2, 3 and 4 respectively represent the types of large classes in the technical classification standard, which are called knowledge-based elements. When a patent technology belongs to both the 1 and 3 categories, a connection will be formed between the two knowledge-based elements. When a patent technology belongs to both the 1 and 4 categories, a connection will be formed between the two knowledge-based elements, and the formation principle of other connections is the same. This paper builds an enterprise knowledge-based network through UCINNET 6.0. UCINNET is a network analysis integration software, though which we can visualize the relationship matrix between the knowledge base elements to network , and we can also calculates the structure hole of the knowledge-based network.
Figure 1. Schematic diagram of the knowledge-based network structure.
The structure hole represents ‘bridge’ nodes connecting two unrelated knowledge elements, and each ‘bridge’ represents a structure hole. The formula is as follows:
, ,
1
iq jqj q q i q j
SH p p
= −
(2)where j stands for all points directly connected to i, q stands for the points other that j and I, stands for the probability that i connects with q, stands for the probability that j connects with q, and represents the redundancy of the knowledge-based network structure. The sum of the individual size of all the knowledge-based elements minus the redundancy of the network is the effective scale of the knowledge-based network structure.
3.4. Control Variables
To reduce the impact of other factors on enterprise innovation performance, combined with previous research on innovation performance, this paper will take enterprise size, knowledge-base, R&D investment intensity, knowledge-based network centralization (centralization) and knowledge- based network density (density) as control variables. Among these, the scale of the enterprise is
p
iqp
jqiq jq q
p P
Figure 1.Schematic diagram of the knowledge-based network structure.
The structure hole represents ‘bridge’ nodes connecting two unrelated knowledge elements, and each ‘bridge’ represents a structure hole. The formula is as follows:
SH=X
j
1− X
q,q,i,q,j
piqpjq
(2)
wherejstands for all points directly connected toi,qstands for the points other thatjandI,piqstands for the probability thaticonnects withq,pjqstands for the probability thatjconnects withq, andP
q piqpjq represents the redundancy of the knowledge-based network structure. The sum of the individual size of all the knowledge-based elements minus the redundancy of the network is the effective scale of the knowledge-based network structure.
3.4. Control Variables
To reduce the impact of other factors on enterprise innovation performance, combined with previous research on innovation performance, this paper will take enterprise size, knowledge-base, R&D investment intensity, knowledge-based network centralization (centralization) and knowledge-based network density (density) as control variables. Among these, the scale of the enterprise is expressed by the logarithm of the enterprise’s operating income; the R&D investment is expressed by the proportion of the annual R&D investment in the annual operating income; the size of the knowledge base is expressed by the number of patent types in the previous year; and network density is calculated from the knowledge-based network constructed by UCINET 6.0.
3.5. Descriptive Statistics
The dependent variables, independent variables and control variables constitute the balanced panel data of N=269, T=10. From the descriptive statistical results in Table2, the maximum value of enterprise innovation performance is 1, the minimum value is only 0.019, and the average value is 0.244. The innovation performance of the electronic information industry is unevenly distributed, and most of it is in the middle and lower reaches of the overall industry level. The maximum value of the knowledge-based network structure hole is 51.099, the minimum value is only 2, and the standard deviation is 8.664. Electronic information belongs to the high-tech industry, and there is a large gap between the development strategies of enterprises. The correlation between the knowledge elements of enterprise with the large knowledge-based network structure is relatively small, which indicates that the R&D direction is relatively divergent, and the knowledge base available to the enterprise is limited. The correlation between the knowledge elements of an enterprise with a small knowledge-based network structure hole is relatively large, which indicates that the R&D direction is relatively concentrated. The maximum value of R&D investment intensity is 29.18%, the minimum value is 0.63%, and the standard deviation is 6.509. The different development levels and strategies of the enterprise make the R&D investment intensity of the enterprise vary greatly.
Table 2.Descriptive statistics of variables.
Variables Mean Deviation Min Max
Innovation performance 0.244 0.166 0.019 1
SH 9.094 8.664 2 51.099
size 4.818 0.853 1.792 5.778
knowledgebase 11.814 13.070 2 76
R&D 7.620 6.509 0.63 29.18
centralization 0.034 0.0725 0 0.5
density 0.403 0.324 0.036 1
4. Threshold Regression Model Construction and Results Analysis
4.1. Threshold Regression Model
This paper uses the threshold effect model constructed by Hansen [47] to explore the role of R&D investment intensity in the impact of the knowledge-based network structure hole on enterprise innovation performance. This estimator is widely used in economics literature [48–52]. The biggest feature of the model is that it can endogenously divide the R&D investment intensity’s range through
repeated sampling, which makes the research results more reliable. Aligned with recent literature, the formula (3) of the regression model is:
Innovation per f ormancet=µi+a1SHitI(R&D≤γ1) +a2SHitI(γ1<R&D≤γ2) +....
amSHitI(γm−1<R&D≤γm) +...+aMSHitI(γM−1<R&D≤γM) +aM+1SHitI(R&D> γM)+
θ1sizet+θ2knowledgebaset+θ3R&Dt+θ4centralizationt+θ5densityt+εit
(3)
R&D is the threshold variable,γ1. . . γMare the threshold values to be estimated, I(*) is the indicator function,µiis the individual difference of each enterprise’s cross-section that does not change with time, andεitis the error term term and follows the independent normal distribution (0,δˆ2).
Enterprise innovation is a gradual process. At different stages of innovation, enterprises have different capabilities for applying and transforming the knowledge base, so it is necessary to discuss the impact of the knowledge-based network structure hole on short-term and long-term innovation performance. It is also important to discuss what range of R&D investment intensity can make the impact most positive.
Model 1 was constructed to study the impact of the knowledge-based network structure hole on the short-term innovation performance, as formula (4) shows:
Innovation per f ormancet+1=µi+a1SHitI(R&D≤γ1) +a2SHitI(γ1<R&D≤γ2) +....
amSHitI(γm−1<R&D≤γm) +...+aMSHitI(γM−1<R&D≤γM) +aM+1SHitI(R&D> γM)+
θ1sizet+θ2knowledgebaset+θ3R&Dt+θ4centralizationt+θ5densityt+εit
(4)
Among these, the knowledge-based network structure hole, R&D investment intensity, and other control variables use current data, and the innovation performance uses data lagging.
Model 2 was constructed to study the impact of the knowledge-based network structure hole on the long-term innovation performance, as formula (5) shows:
Innovation per f ormancet+2=µi+a1SHitI(R&D≤γ1) +a2SHitI(γ1<R&D≤γ2) +....
amSHitI(γm−1<R&D≤γm) +...+aMSHitI(γM−1<R&D≤γM) +aM+1SHitI(R&D> γM)+
θ1sizet+θ2knowledgebaset+θ3R&Dt+θ4centralizationt+θ5densityt+εit
(5)
Among these, the knowledge-based network structure hole, R&D investment intensity, and other control variables use current data, and the innovation performance uses lagging second data.
4.2. Threshold Effect Test
Before estimating the threshold effect, it was necessary to determine the threshold type of R&D investment intensity in the impact of a knowledge-based network structure hole on innovation performance. The threshold effect model requires the data type to be balanced panel data; threshold type testing (the test was performed under the assumption of a single threshold, double threshold and triple threshold), threshold value determination and model coefficient estimation were all completed by stata14.0 on balanced panel data of N=269, T=10.
It can be seen from Table3that, in Model 1, the single threshold hypothesis passes the test at a 1% significance, the double threshold hypothesis passes the test at a 10% significance level, and the triple threshold hypothesis failed to be tested at 10% significance level. Therefore, Model 1 should be estimated using a double threshold model. In Model 2, the single threshold hypothesis passes the test at 10% significance, the double threshold hypothesis passes the test at a 1% significance level, and the triple threshold hypothesis failed to be tested at a 10% significance level. Thus, Model 2 should also use a double threshold model for estimation. Therefore, there is a non-linear relationship between the knowledge-based network structure hole and innovation performance, and hypothesis 1 passes the test. At the same time, R&D investment intensity plays a threshold role in the relationship between knowledge-based network and innovation performance, so hypothesis 2a passes the test.
Table 3.Threshold effect type test of Model 1 and Model 2.
Model Test Model F-Value p-Value Critical Value
1% 5% 10%
model1
single threshold 16.523 *** 0.003 11.96 6.702 4.122
double
threshold 6.276 * 0.093 11.58 7.708 5.716
triple threshold 4.245 0.123 13.48 8.424 5.428
model 2
single threshold 5.745 * 0.08 18.19 8.155 5.021
double
threshold 15.331 *** 0 13.76 7.665 5.39
triple threshold 2.1 0.333 12.61 7.634 6.579
Note: the probability, the corresponding criticality value and the F statistic were obtained after ‘free sampling’
(bootstrap 300) simulations. ***, and * are significant at the levels of 1% and 10%.
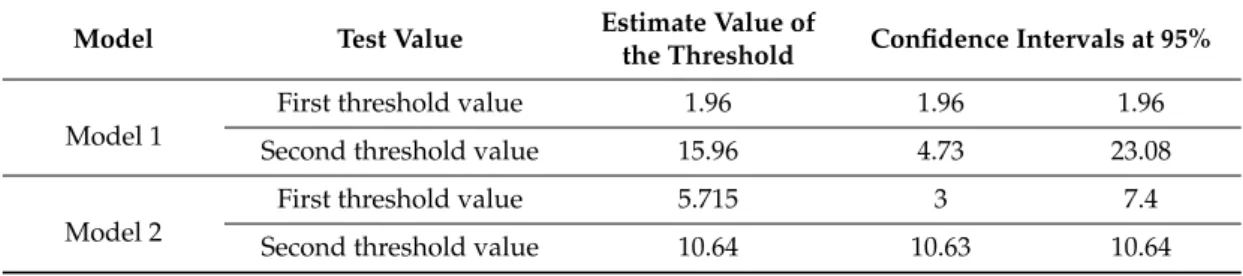
After determining the threshold model, it was necessary to estimate the threshold value of each model. Table4reports the threshold values and 95% confidence intervals for Model 1 and Model 2.
Table 4.Estimates of the values of the threshold and confidence intervals.
Model Test Value Estimate Value of
the Threshold Confidence Intervals at 95%
Model 1
First threshold value 1.96 1.96 1.96
Second threshold value 15.96 4.73 23.08
Model 2
First threshold value 5.715 3 7.4
Second threshold value 10.64 10.63 10.64
Figures2–5are graphs of likelihood ratio functions. The threshold value is the estimated value when the likelihood ratio test statistic LR is zero. The 95% confidence interval of the threshold estimated value is the interval formed by all of the estimated values when the LR value is less than a 5% significance level (the critical value is 7.35). The interval is shown by the area below the dotted line.
Therefore, as is shown from Figures1–4, two threshold estimate values of Model 1 and Model 2 have obvious turning points close to 0 in the confidence interval, and are therefore significant. Based on the threshold estimate values, the sample enterprises were divided into three categories: enterprises with low R&D investment intensity (R&D investment intensity<first threshold), enterprises with medium R&D investment intensity (first threshold<R&D investment intensity<second threshold), and enterprises with high R&D investment intensity (R&D investment intensity>second threshold).
Sustainability 2020, 12, x FOR PEER REVIEW 10 of 17
Table 3. Threshold effect type test of Model 1 and Model 2.
Model Test model F-value P-value Critical value
1% 5% 10%
model1
single threshold 16.523*** 0.003 11.96 6.702 4.122
double threshold 6.276* 0.093 11.58 7.708 5.716
triple threshold 4.245 0.123 13.48 8.424 5.428
model 2
single threshold 5.745* 0.08 18.19 8.155 5.021
double threshold 15.331*** 0 13.76 7.665 5.39
triple threshold 2.1 0.333 12.61 7.634 6.579
Note: the probability, the corresponding criticality value and the F statistic were obtained after ‘free sampling’ (bootstrap 300) simulations. ***, **, and * are significant at the levels of 1%, 5%, and 10%.
After determining the threshold model, it was necessary to estimate the threshold value of each model. Table 4 reports the threshold values and 95% confidence intervals for Model 1 and Model 2.
Table 4. Estimates of the values of the threshold and confidence intervals.
Model Test value estimate value of
the threshold confidence intervals at 95%
Model 1 First threshold value 1.96 1.96 1.96
Second threshold value 15.96 4.73 23.08
Model 2 First threshold value 5.715 3 7.4
Second threshold value 10.64 10.63 10.64
Figures 2 to 5 are graphs of likelihood ratio functions. The threshold value is the estimated value when the likelihood ratio test statistic LR is zero. The 95% confidence interval of the threshold estimated value is the interval formed by all of the estimated values when the LR value is less than a 5% significance level (the critical value is 7.35). The interval is shown by the area below the dotted line. Therefore, as is shown from Figures 1 to 4, two threshold estimate values of Model 1 and Model 2 have obvious turning points close to 0 in the confidence interval, and are therefore significant. Based on the threshold estimate values, the sample enterprises were divided into three categories:
enterprises with low R&D investment intensity (R&D investment intensity < first threshold), enterprises with medium R&D investment intensity (first threshold < R&D investment intensity <
second threshold), and enterprises with high R&D investment intensity (R&D investment intensity >
second threshold).
Figure 2. Estimate value of the first threshold and confidence interval in Model 1. Figure 2.Estimate value of the first threshold and confidence interval in Model 1.
Figure 3. Estimate value of th esecond threshold and confidence interval in Model 1.
Figure 4. Estimate value of the first threshold and confidence interval in Model 2.
Figure 5. Estimate value of the second threshold and confidence interval in Model 2.
4.3.Analysis of the Threshold Model Regression
After determining the threshold values, the Hausman test was required to determine whether to use the fixed-effect model (FE) or the random-effect model (RE). In Model 1, the probability of Prob > chi2 is 0.204, the null hypothesis is rejected, and we should use the fixed-effect model to estimate the impact of the knowledge-based network structure hole on short-term innovation performance. In Model 2, the probability of Prob > chi2 is 0.115, the null hypothesis is rejected, and we should use the fixed-effect model to estimate the impact of the knowledge-based network structure hole on long-term innovation performance. Table 5 reports the estimated coefficients and standard deviations of Model 1 and Model 2 by the fixed-effect model with the robust option.
The regression results of Model 1 show that when the R&D investment intensity is less than 1.96%, the impact of the structural hole on innovation performance is negative at the 10% significance level; when the R&D investment intensity is greater than 1.96% and less than 15.96%, the impact of the structural hole on innovation performance is positive at the 10% significance level; when the R&D
Figure 3.Estimate value of th esecond threshold and confidence interval in Model 1.
Figure 3. Estimate value of th esecond threshold and confidence interval in Model 1.
Figure 4. Estimate value of the first threshold and confidence interval in Model 2.
Figure 5. Estimate value of the second threshold and confidence interval in Model 2.
4.3.Analysis of the Threshold Model Regression
After determining the threshold values, the Hausman test was required to determine whether to use the fixed-effect model (FE) or the random-effect model (RE). In Model 1, the probability of Prob > chi2 is 0.204, the null hypothesis is rejected, and we should use the fixed-effect model to estimate the impact of the knowledge-based network structure hole on short-term innovation performance. In Model 2, the probability of Prob > chi2 is 0.115, the null hypothesis is rejected, and we should use the fixed-effect model to estimate the impact of the knowledge-based network structure hole on long-term innovation performance. Table 5 reports the estimated coefficients and standard deviations of Model 1 and Model 2 by the fixed-effect model with the robust option.
The regression results of Model 1 show that when the R&D investment intensity is less than 1.96%, the impact of the structural hole on innovation performance is negative at the 10% significance level; when the R&D investment intensity is greater than 1.96% and less than 15.96%, the impact of the structural hole on innovation performance is positive at the 10% significance level; when the R&D
Figure 4.Estimate value of the first threshold and confidence interval in Model 2.
Figure 3. Estimate value of th esecond threshold and confidence interval in Model 1.
Figure 4. Estimate value of the first threshold and confidence interval in Model 2.
Figure 5. Estimate value of the second threshold and confidence interval in Model 2.
4.3.Analysis of the Threshold Model Regression
After determining the threshold values, the Hausman test was required to determine whether to use the fixed-effect model (FE) or the random-effect model (RE). In Model 1, the probability of Prob > chi2 is 0.204, the null hypothesis is rejected, and we should use the fixed-effect model to estimate the impact of the knowledge-based network structure hole on short-term innovation performance. In Model 2, the probability of Prob > chi2 is 0.115, the null hypothesis is rejected, and we should use the fixed-effect model to estimate the impact of the knowledge-based network structure hole on long-term innovation performance. Table 5 reports the estimated coefficients and standard deviations of Model 1 and Model 2 by the fixed-effect model with the robust option.
The regression results of Model 1 show that when the R&D investment intensity is less than 1.96%, the impact of the structural hole on innovation performance is negative at the 10% significance level; when the R&D investment intensity is greater than 1.96% and less than 15.96%, the impact of the structural hole on innovation performance is positive at the 10% significance level; when the R&D
Figure 5.Estimate value of the second threshold and confidence interval in Model 2.
4.3. Analysis of the Threshold Model Regression
After determining the threshold values, the Hausman test was required to determine whether to use the fixed-effect model (FE) or the random-effect model (RE). In Model 1, the probability of Prob
>chi2 is 0.204, the null hypothesis is rejected, and we should use the fixed-effect model to estimate the impact of the knowledge-based network structure hole on short-term innovation performance.
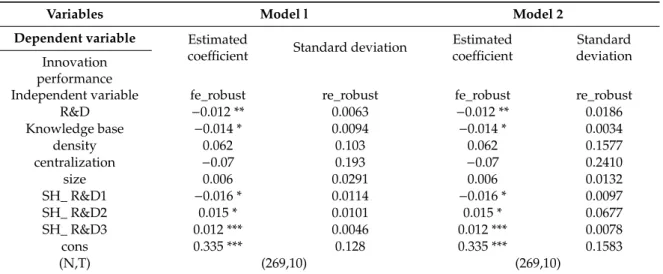
In Model 2, the probability of Prob>chi2 is 0.115, the null hypothesis is rejected, and we should use the fixed-effect model to estimate the impact of the knowledge-based network structure hole on long-term innovation performance. Table5reports the estimated coefficients and standard deviations of Model 1 and Model 2 by the fixed-effect model with the robust option.
The regression results of Model 1 show that when the R&D investment intensity is less than 1.96%, the impact of the structural hole on innovation performance is negative at the 10% significance level;
when the R&D investment intensity is greater than 1.96% and less than 15.96%, the impact of the
structural hole on innovation performance is positive at the 10% significance level; when the R&D investment intensity continues to increase by more than 15.96%, the impact of a structural hole on innovation performance is positive at the 1% significance level.
The regression results of Model 2 show that when the R&D investment intensity is less than 5.715%, the impact of a structural hole on innovation performance is negative at the 10% significance level; when the R&D investment intensity is greater than 5.72% and less than 10.64%, the impact of the structural hole on innovation performance is positive at the 10% significance level; when the R&D investment intensity continues to increase by more than 10.64%, the impact of the structural hole on innovation performance is positive at the 1% significance level.
Table 5.Threshold effect estimation results of Model 1 and Model 2.
Variables Model l Model 2
Dependent variable Estimated
coefficient Standard deviation Estimated coefficient
Standard deviation Innovation
performance
Independent variable fe_robust re_robust fe_robust re_robust
R&D −0.012 ** 0.0063 −0.012 ** 0.0186
Knowledge base −0.014 * 0.0094 −0.014 * 0.0034
density 0.062 0.103 0.062 0.1577
centralization −0.07 0.193 −0.07 0.2410
size 0.006 0.0291 0.006 0.0132
SH_ R&D1 −0.016 * 0.0114 −0.016 * 0.0097
SH_ R&D2 0.015 * 0.0101 0.015 * 0.0677
SH_ R&D3 0.012 *** 0.0046 0.012 *** 0.0078
cons 0.335 *** 0.128 0.335 *** 0.1583
(N,T) (269,10) (269,10)
Note: SH_ R&D1 are the regression coefficients when R&D is less than threshold value 1; SH_ R&D2 are the regression coefficients when R&D is more than threshold value 1 but less than threshold value 2; SH_ R&D3 are the regression coefficients when R&D is more than threshold value2. ***, **, and * are significant at the levels of 1%, 5%, and 10%.
It can be seen from the regression results of Model 1 and Model 2 above that when the R&D investment intensity is less than threshold value 1, the knowledge-based network structure hole has a significant negative impact on both short-term and long-term innovation performance, so hypothesis 2b passes the test; when the R&D investment intensity exceeds threshold value 1 and continues to increase, the knowledge-based network structure hole has a significant positive impact on both short-term and long-term innovation performance. When R&D investment intensity continues to increase beyond threshold value 2, the knowledge-based network structure hole still has a positive impact on both short-term and long-term innovation performance, but the impact is weakened, so hypothesis 2c passes the test.
5. Conclusions
(1) The R&D investment intensities of different enterprises are different, as well as the knowledgebase scale and innovation strategy. The absolute difference value of the maximum and minimum R&D investment intensity is 28.55% and the standard deviation is 8.664%, which indicates that the R&D investment intensity of the sample enterprises is uneven, and the gap is large.
According to the different R&D investment intensities and based on the threshold estimate values, the sample enterprises were divided into three categories: enterprises with low R&D investment intensity, enterprises with medium R&D investment intensity, enterprises with high R&D investment intensity;
the scale of a knowledge base can not only reflect the research base, but also represents the direct output of technological innovation. The absolute difference value of the maximum and minimum scale of the knowledge base is 74, and the standard deviation is 13.070. A larger standard deviation indicates
that there is a significant gap between the sample enterprises in terms of knowledge accumulation and technological innovation capabilities; the larger the knowledge-based network structure hole, the greater the diversified innovation strategy that the enterprises implement. The correlation between technologies is low. The smaller structural hole indicates that the enterprise implements a convergence innovation strategy; that is, there is a high correlation between technological innovations. The absolute difference value of the maximum and minimum of the knowledge-based network structure reaches 49.1, and the standard deviation is 8.664. This shows that the knowledge-based network structures of the sample enterprises are quite different, as well as the innovation development direction of the enterprises.
(2) The optimal interval of R&D investment intensity for long-term performance is included in the optimal interval for short-term performance. That is, the optimal interval of R&D investment intensity for long-term performance is narrower than that of the short-term innovation performance.
To achieve sustainable development, an appropriate knowledge-based network structure hole needs to match the precise R&D investment intensity. The first threshold of R&D investment intensity for short-term performance is 1.96% and the second threshold is 15.96%. The first threshold of R&D investment intensity for long-term performance is 5.72%, and the second threshold is 10.64%.
The first threshold of R&D investment intensity for short-term performance is lower than the first threshold for long-term performance, which shows that a lower R&D investment intensity can make the knowledge-based network structure hole promote short-term performance. If the enterprise wants to make the knowledge-based network structural hole have a positive impact on innovation performance in the long run, the R&D investment intensity should be increased by more than 5.72%. The second threshold of R&D investment intensity for short-term performance is higher than the second threshold for long-term performance, which means that a higher R&D investment intensity can make the knowledge-based network structure hole have a positive impact on short-term innovation performance, but the knowledge-based network structure hole can maintain a high positive effect on innovation performance in the long run, and the R&D investment intensity should not exceed 10.64%. Compared with the determination of the threshold interval of R&D investment intensity from the perspective of high-tech and low-tech levels [24], we determined the threshold interval of R&D investment intensity from the perspective of long-term performance and short-term performance, which broadens the research category of how R&D investment intensity impacts innovation performance.
(3) For both short-term innovation performance and long-term innovation performance, under the threshold effect of R&D investment intensity, the overall trend of the impact of the knowledge-based network structure hole on innovation performance was from negative to positive. When the knowledge-based network structure hole is small, the enterprise cannot use the ‘bridge’ function of the knowledge-based network structure to create new knowledge, which will have a negative impact on innovation performance. With the increase of R&D investment and the optimization of the knowledge-based network structure, enterprises can make full use of the ‘bridge’ function of the structural hole to create new knowledge. Currently, the knowledge-based network structure has the largest positive effect on innovation performance. When the R&D investment intensity exceeds the optimal interval, the knowledge-based network structure hole has a positive effect on short-term and long-term innovation performance. In the short term, the first threshold of R&D investment intensity is low, and the increase of R&D investment can make the knowledge-based network structure hole have a positive impact on innovation performance. If the R&D investment intensity exceeds 1.96%, the estimated coefficient of the knowledge-based network structure hole changes from−0.016 to 0.015, and the impact of the knowledge-based network structure hole on innovation performance changes from negative to positive. When the R&D investment intensity exceeds the second threshold, the estimated coefficient of the knowledge-based network structure hole becomes 0.012. Although the knowledge-based network structure hole still has a positive effect on innovation performance, the effect is reduced. In the long run, only when the R&D investment intensity exceeds 5.715% does the estimated coefficient of the knowledge-based network structure hole change from−0.016 to 0.015, and the impact
on innovation performance change from negative to positive. When the R&D investment intensity exceeds the second threshold, the estimated coefficient of the knowledge-based network structure hole becomes 0.012. Although the structure hole has a positive effect on innovation performance, its effect is reduced. Compared with the research on the regulation and intermediary role of R&D investment intensity [53,54], this article studied the threshold effect of R&D investment intensity when the knowledge-based network structure hole has an impact on innovation performance; thus, the indirect role of R&D investment intensity was analyzed more in-depth. Besides this, compared with the research on how the knowledge-based network structure hole impacts innovation performance [34,35], in this article, we can know the interval in which the knowledge-based network structure hole has a positive impact on innovation performance, and we examined the more clear nonlinear relationship between the knowledge-based network structure hole and innovation performance.
6. Arguments and Discussion
The conclusions have important implications for the optimization of the knowledge-based structure and the improvement of enterprise innovation performance.
Because different enterprises carry out different development strategies, R&D investment intensities are different. For enterprises with low R&D investment intensity, only when the R&D investment intensity reaches the first threshold can the knowledge-based network structure hole have a positive impact on short-term innovation performance and long-term innovation performance.
For enterprises with medium R&D investment intensity, increasing the R&D investment intensity cannot bring about an increase in short-term and long-term innovation performance. Overly high R&D investment intensity will increase the burden on other aspects of an enterprise, which will harm innovation performance. Enterprises with high R&D investment intensity should reduce R&D investment intensity to maximize the positive effect of the knowledge-based network structure hole on innovation performance. Therefore, enterprises should dynamically adjust their knowledge-based network structure and R&D investment according to the enterprise’s strategic objectives in order to meet the needs of the short-term and long-term performance, so that the enterprise can achieve sustainable development.
We studied the role of R&D investment intensity in the impact of the knowledge-based network structure hole on innovation performance, and we found that, in different R&D investment intensity intervals, the knowledge-based network structure hole had different effects on short-term and long-term innovation performance, which provides a reference for enterprises to make short-term and long-term innovation plans.
In this paper, the samples were manufacturing enterprises listed on the mainboard, which were relatively mature. However, compared with enterprises listed on the mainboard, manufacturing enterprises listed on the Small and Medium-sized Enterprise Board (SME Board) and a new third board implement different innovative development strategies, so the impact of the knowledge base network structure hole on innovation performance may be different for manufacturing enterprises listed on the SME Board and the new third board. Therefore, in future research, we will take manufacturing enterprises listed on the SME Board and the new third board as samples and consider the impact of the knowledge base network structure on short-term and long-term innovation performance. We will also continue to study the role of R&D investment. At the same time, the knowledge-base network is not static; it is of great significance to study the influence of the dynamic knowledge base network structure on the long-term and short-term performance of enterprises in the future.
Author Contributions:Conceptualization, C.L. and M.A.; methodology, J.H.; software, R.Y.; data curation, J.H.
and R.Y.; writing—original draft preparation, C.L. and M.A.; writing—review and editing, J.H., M.A.K. and J.O.
All authors have read and agreed to the published version of the manuscript’
Funding:This research was funded by Major research projects of the humanities and social sciences of the HeBei provincial department of education funding, grant number ZD201904, and was supported by the János Bolyai Research Scholarship of the Hungarian Academy of Sciences. This research was funded by the National Research,
Development and Innovation Fund of Hungary. Project no. 130377 has been implemented with the support provided by the National Research, Development and Innovation Fund of Hungary, financed under the KH_18 funding scheme.
Acknowledgments: We acknowledge the Editors in Chief, Managing Editor, Sustainbility, and anonymous referees for their useful comments to improve the manuscript.
Conflicts of Interest:“The authors declare no conflict of interest”.
References
1. Cheng, G.D. The evolution of the concept of carrying capacity and the application framework of the carrying capacity of water resources in northwest China.Glacier Permafr.2002,04, 361–367.
2. Wu, N.; Fu, Z.Q.; Xie, Y.Y.; She, P.; Gao, B.; Li, L. Review on research progress of industrial layout optimization based on ecological carrying capacity.Ecol. Econ.2015,31, 21–25.
3. Zhang, L.B.Research on the Theory and Method of Urban Ecological Carrying Capacity—A Case Study of Shenzhen;
China Environmental Science Press: Beijing, China, 2009.
4. Shapira, P.; Youtie, J.; Yogeesvaran, K.; Jaafar, Z. Knowledge economy measurement: Methods, results and insights from the Malaysian Knowledge Content Study.Res. Policy2006,35, 1522–1537. [CrossRef]
5. Clancy, M.S. Combinations of technology in US patents, 1926–2009: A weakening base for future innovation?
Econ. Innov. New Technol.2018,27, 770–785. [CrossRef]
6. Cohen, W.M.; Levinthal, D.A. Absorptive capacity: A new perspective on learning and innovation.
Adm. Sci. Q.1990,35, 128–152. [CrossRef]
7. Dedeurwaerdere, T.; Melindi-Ghidi, P.; Sas, W. Networked innovation and coalition formation: The effect of group-based social preferences.Econ. Innov. New Technol.2018,27, 577–593. [CrossRef]
8. Cohen, J.F.; Olsen, K. Knowledge management capabilities and firm performance: A test of universalistic, contingency and complementarity perspectives.Expert Syst. Appl.2015,42, 1178–1188. [CrossRef]
9. Guerrero, M.; Herrera, F.; Urbano, D. Strategic knowledge management within subsidised entrepreneurial university-industry partnerships.Manag. Decis.2019,57, 3280–3300. [CrossRef]
10. Sun, Y.; Liu, J.; Ding, Y. Analysis of the relationship between open innovation, knowledge management capability and dual innovation.Technol. Anal. Strateg. Manag.2019,32, 15–28. [CrossRef]
11. Grant, R.M. Toward a knowledge-based theory of the firm.Strat. Manag. J.1996,17, 109–122. [CrossRef]
12. Kogut, B.; Zander, U. Knowledge of the firm, combinative capabilities, and the replication of technology.
Organ. Sci.1992,3, 83–397. [CrossRef]
13. Pan, L.P.; Chi, R.Y. Research on enterprise knowledge structure and innovation from the perspective of internal network—Divergence is the king, or convergence wins?Res. Sci. Sci.2008,36, 288–295.
14. Xu, L.Y.; Zeng, D.M.; Li, J. The influence of knowledge network centrality and knowledge diversification on enterprise binary innovation performance.J. Manag.2017,14, 221–228.
15. Yao, Y.H.; Li, Y.F. Research on the matching of enterprise innovation strategy and knowledge structure.
Sci. Sci. Technol. Manag.2014,10, 150–158.
16. Zeng, D.M.; Zhou, T. Research on the relationship between enterprise knowledge infrastructure and technological innovation performance—A new perspective of the relationship between knowledge elements.
Sci. Sci. Technol. Manag.2015,36, 80–88.
17. Shen, W.S.; Zhang, H.; Zou, C.X.Research on Regional Ecological Carrying Capacity and Ecological Security; China Environmental Science Press: Beijing, China, 2010.
18. Wang, J.J.; Yao, X.H.; Li, J.R. Estimation of ecological carrying capacity in Heihe River Basin.Environ. Sci. Res.
2000,2, 44–48.
19. Harris, J.M.; Kennedy, S. Carrying capacity in agriculture: Global and regional issues.Ecol. Econ.1999,29, 443–461. [CrossRef]
20. Gao, J.X.Theoretical Exploration of Sustainable Development—Theories, Methods and Methods of Ecological Carrying Capacity Application; China Environmental Science Press: Beijing, China, 2002.
21. Wu, F.; Wu, H.; Zhang, X. How does innovation activity affect firm export behavior? Evidence from China.
Emerg. Mark. Financ. Trade2019,56, 1730–1751. [CrossRef]
22. Cantner, U.; Meder, A.; Ter Wal, A.L. Innovator networks and regional knowledge base.Technovation2008, 30, 496–507. [CrossRef]