2693
Who Pays for the Minimum Wage?
†By Peter Harasztosi and Attila Lindner*
This paper provides a comprehensive assessment of the margins along which firms responded to a large and persistent minimum wage increase in Hungary. We show that employment elasticities are negative but small even four years after the reform; that around 75 percent of the minimum wage increase was paid by consumers and 25 percent by firm owners; that firms responded to the minimum wage by substituting labor with capital; and that disemployment effects were greater in industries where passing the wage costs to consumers is more difficult. We estimate a model with monopolistic competition to explain these findings. (JEL J23, J24, J31, J38, L13)
Despite several decades of microeconometric evidence, the minimum wage remains a highly controversial policy. On the one hand, opponents argue that the minimum wage makes low-skilled workers worse off as many of them lose their jobs (e.g., Stigler 1946, Neumark and Wascher 2010). On the other hand, propo- nents insist that the minimum wage has no discernible effect on employment and sometimes has a positive effect on it (e.g., Card and Krueger 1995; Dube, Lester, and Reich 2010). In addition to debating the sign and the size of the employment effects, there is also disagreement on whether the minimum wage is passed on to consumers through higher prices, or whether it is paid by firm owners through lower profits (see, e.g., Aaronson and French 2007 on prices and Draca, Machin, and Van Reenen 2011 on profits).
* Harasztosi: European Commission, Joint Research Centre (JRC), Via Fermi 2749, 21027 Ispra, Italy (email:
peter.harasztosi@ec.europa.eu); Lindner: University College London, 30 Gordon Street, London, WC1H 0AX, United Kingdom, and CEP, IFS, IZA, MTA KTI (email: a.lindner@ucl.ac.uk). Thomas Lemieux was the coeditor for this article. We thank David Card, Patrick Kline, and Emmanuel Saez for their continuous guidance through- out the project. We are grateful to three anonymous referees and to Alan Auerbach, Tamás Bátyi, Katalin Bodnár, Michael Best, Stefano DellaVigna, Eric French, Hedvig Horváth, Hilary Hoynes, Larry Katz, János Köll˝o, Gábor Kézdi, Gábor K˝orösi, Alan Manning, John Mondragon, Carl Nadler, Steve Machin, Balázs Muraközy, Suphanit Piyapromdee, Michael Reich, Balázs Reizer, Ana Rocca, Jesse Rothstein, David Silver, Isaac Sorkin, Peter Spittal, Ferenc Sz˝ucs, Álmos Telegdy, Chris Walters, Danny Yagan, Owen Zidar, and participants in seminars at Bocconi University, Collegio Alberto, Chicago Booth, Duke University, Harris School of Public Policy, Syracuse University, University of Oslo, UC Berkeley, Tinbergen Institute, University of Utah, and in conferences at AEA, Royal Academy of Science, IAB in Nuremberg, IZA in Bonn, for very helpful comments. We also thank the Hungarian Central Statistical Office and IE CERS HAS for their support. Financial support from the Center for Equitable Growth at UC Berkeley, from the European Research Council (ERC-2015-CoG-682349), from the NKFI-125101 grant “Employment of the Low-Skilled in Hungary” and from “Firms, Strategy and Performance Lendület” grant of the Hungarian Academy of Sciences is gratefully acknowledged. All errors are our own. The views expressed are that of the authors only and do not imply a policy position of the European Commission. The authors declare that they have no relevant or material financial interests that relate to the research described in this paper.
† Go to https://doi.org/10.1257/aer.20171445 to visit the article page for additional materials and author disclosure statements.
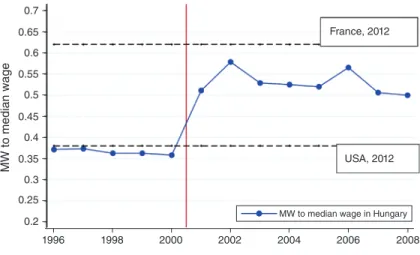
In this paper, we present new evidence on the employment effect and the inci- dence of the minimum wage by exploiting a very large and persistent increase in the minimum wage in Hungary. Figure 1 shows the remarkable recent history of the minimum wage in Hungary. Prior to 2000, the ratio of the minimum wage to the median wage in the country was around 35 percent, comparable to the current ratio in the United States, while two years later the minimum wage rose to 55 percent, a level only slightly below the current minimum wage in France. The apparent size and permanence of this unique policy change allow us to examine responses to a minimum wage increase in a context where firms have strong incentives to restruc- ture their production process or exit the market as soon as possible because the loss in profit from inaction is significant.
We estimate the employment and wage effects of this unique minimum wage increase by exploiting administrative data on firms filing balance sheet statements to the tax authority. We estimate the firm-level relationship between the fraction of workers who earned below the new minimum wage before the reform and the per- centage change in employment relative to year 2000, the last year before the min- imum wage hike. We find that firms employing only minimum wage workers had 10 percent lower employment four years after the minimum wage hike than firms with no minimum wage workers. This implies that 1 out of 10 low wage workers lost their job as a result of the reform. The divergence in employment between firms with different levels of exposure emerged only after the minimum wage hike, which underlines that the employment changes are driven by the reform and not something else.
At the same time, the average wage at the highly exposed firms increased by 54 percent more than the average wage at firms with no exposure to the minimum wage.
Therefore, the employment responses relative to the wage effects are small even for sizable changes in the minimum wage and so the average earnings of low-wage
Figure 1. Minimum Wage in Hungary
Notes: This figure shows the ratio of the minimum wage to median wage in the private sector for Hungary between 1996 and 2008 (own calculations). The two dashed lines depict the ratio of the minimum wage to the median wage for France and the United States in 2012 (OECD).
1996
MW to median wage
1998 2000 2002 2004 2006 2008
0.2 0.25 0.3 0.35 0.4 0.45 0.5 0.55 0.6 0.7 0.65
MW to median wage in Hungary USA, 2012 France, 2012
workers increased considerably. The implied employment elasticity with respect to the workers’ own wage is −0.18 (SE 0.03), which is at the lower end of the esti- mates in the literature.
The administrative data combined with the very large minimum wage shock allow us to examine various other margins of adjustment and to assess the inci- dence of the minimum wage directly. We find a strong positive relationship between changes in total revenue (relative to year 2000) and minimum wage exposure after the reform, while no such relationship was present beforehand. A similar analysis reveals a slight drop in profits after the reform. We calculate that around 25 percent of the increased cost of labor is covered by lower profits, and so paid by the firm owners, and around 75 percent is paid by consumers in the form of higher revenue.
Therefore, understanding revenue responses is crucial for the incidence analysis.
The change in total revenue is the product of changes in quantity and prices. To provide direct evidence on the role of price changes, we exploit unique firm-product level data for the manufacturing sector and document that firm-level price indices increased considerably in response to the minimum wage. We also find substantial heterogeneity in responses to the minimum wage across sectors consistent with the role of price pass-through. We show that the revenue effects are smaller (and the disemployment effects are larger) in the tradable, in the manufacturing, and in the exporting sectors. In these sectors, Hungarian firms are more likely to face foreign competitors which are not hit by the minimum wage shock. Thus, the price increase of Hungarian firms leads to a competitive disadvantage and a large fall in output. On the contrary, the minimum wage increased revenue more (and the disemployment effects were smaller) in the non-tradable sector. In this sector, all firms were hit by the minimum wage shock meaning that individual firms could raise their prices without a loss in competitive advantage or a large fall in output.
Understanding responses at various margins also allows us to shed new light on how firms absorbed the minimum wage shock. The main explanations in the litera- ture for the near-zero effect on employment emphasize the importance of labor mar- ket frictions (e.g., Dube, Lester, and Reich 2016; Flinn 2010; Bhaskar, Manning, and To 2002; Van Den Berg 2003; Rebitzer and Taylor 1995). However, the increase in prices and the seemingly important role for product market competition high- light the importance of the channels predicted by the standard labor demand model (Aaronson and French 2007). We also document a large increase in capital stock, which suggests that capital-labor substitution, another important margin of adjust- ment in the standard labor demand model, plays a crucial role.1
We propose a simple partial equilibrium model that incorporates these channels of adjustment. To capture the importance of the structure of output market we devi- ate from the standard labor demand model, which assumes perfect competition, and we introduce market imperfection in the output market. In particular, we assume that monopolistically competitive firms are selling differentiated goods. The mod- el’s key predictions are in line with the Hicks-Marshall rule of derived demand
1 The relatively fast and sizable adjustment also underscores that the minimum wage hike was so radical that firms adjusted their production processes quickly. Since the change in capital stock mainly occurred at firms which existed before the minimum wage hike, such a large response in capital stock is inconsistent with the Putty-Clay model (see Aaronson et al. 2018).
(Hamermesh 1993), which suggests that firm-level responses to the minimum wage depend on (i) the cost share of different factors in production (labor, capital, inter- mediate goods); (ii) the substitution elasticity between labor and other factors (capi- tal and intermediate goods); and (iii) the relevant output demand elasticity that firms face after a minimum wage hike. However, this latter channel depends on the market structure in our model. In markets where only one firm is hit by the minimum wage shock (e.g., exporting markets), the relevant output demand is the firm-level one which tends to be highly elastic. Alternatively, in markets where all firms are hit by the minimum wage shock, the relevant output demand is the market-level one which tends to be less elastic.
We evaluate the model quantitatively by matching the model predictions to our empirical estimates on the effects of the minimum wage increase on labor, capital, revenue, and materials (intermediate goods and services). The model performs well in explaining the key moments in the data, especially when we allow the underlying parameters to vary by sector. The best fitting model matches the employment and capital responses very closely. Moreover, the predicted price effects in the manu- facturing sector are also very close to their empirical counterparts even though we do not use these moments in the estimation. However, the model fit is not perfect.
In some cases we over-predict revenue responses and under-predict responses on materials, which underlines some limitations of this arguably simplistic framework.
Nevertheless, finding the best fitting parameters allows us to translate our reduced- form estimates at various margins to easily interpretable structural parameters. We uncover three structural parameters. The substitution elasticity between capital and low wage workers is quite high: it is 3.35 (SE 0.62) four years after the reform.
However, this large substitution elasticity has only a limited effect on employment, because the share of capital expenses in firm-level production is only around 8 per- cent. The second structural parameter is the substitution elasticity between materials and labor, which we estimate to be close to zero (0.03, SE 0.06) even in the medium run. Given that the spending on materials accounts for 74 percent of an average firm’s costs, a low level of this elasticity is required for the employment responses to be low.
The output demand elasticity is close to zero (0.11, SE 0.22) in the medium term (four years after the reform). Moreover, there is considerable variation in the esti- mates across sectors. The output demand is more elastic in the manufacturing and in the tradable sector, where the relevant output demand elasticity is the firm-level one. For instance, in the exporting sector, we find that the output demand elasticity is 3.64 (SE 0.98).2 By contrast, in the non-tradable sector we find near-zero output elasticities even in the medium run. This suggests that firms in these sectors can pass the minimum wage to consumers because output demand is inelastic.
This paper contributes to several strands of the minimum wage literature. First, we contribute to the extensive literature on the employment effects of the minimum wage (e.g., see the surveys by Neumark and Wascher 2010 and Card and Krueger 1995). Many papers in this literature find that the effect of the minimum wage is
2 The output demand elasticity in the exporting sectors identifies the Armington elasticity, i.e., the elasticity of substitution between products of different countries. Our estimates are in line with the findings in the trade literature which have found that the Armington elasticity is close to 1.4 in the short run and to 6.2 in the long run (Ruhl 2008).
close to zero (Doucouliagos and Stanley 2009, CBO 2014). However, these papers are criticized on the basis that they rely on small and temporary shocks for identi- fication (Sorkin 2015, Aaronson et al. 2018) and study only short-term responses (Baker, Benjamin, and Stanger 1999), and so the lack of immediate responses might simply reflect adjustment costs or inertia (Chetty et al. 2011). In this paper, we address these critiques by examining an unusually large and persistent increase in the minimum wage, where costs of inaction or delaying responses are substantial, and show that the effect of the minimum wage is small even for such a large mini- mum wage change.3
This paper also contributes to the literature investigating margins of adjustment to the minimum wage. Previous literature has examined the effect on firm profitability and revenue (Mayneris, Poncet, and Zhang 2018; Hau, Huang, and Wang 2016;
Riley and Bondibene 2018; Draca, Machin, and Van Reenen 2011; Allegretto and Reich 2018), on the stock-market value (Card and Krueger 1995, Bell and Machin 2018), on capital stock (Hau, Huang, and Wang 2016), and on output prices in the local service sector (see Lemos 2008 and MaCurdy 2015 for a review). Here we provide a comprehensive study of the different margins adjustment, both across the whole economy and separately by sector. Thanks to the large permanent increase in the minimum wage we have the statistical power to look at the margins of adjust- ment in sectors where the labor share is low and so a smaller shock to the mini- mum wage would have only modest impacts on firms (e.g., in the retail sector, see Ganapati and Weaver 2017) or where a smaller minimum wage shock would not be binding (e.g., in the exporting and in the manufacturing sector).
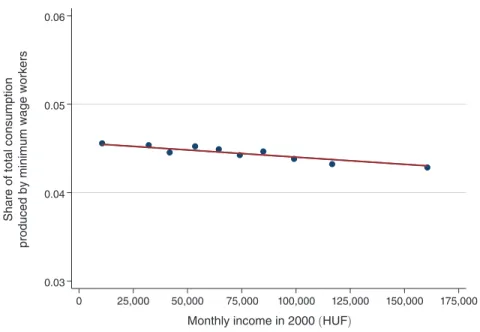
Finally, our paper also contributes to the scant literature on the incidence of the minimum wage. MaCurdy (2015) examines the incidence of the minimum wage in a general equilibrium framework under the assumption that there is no employment effect and the increase in wage cost is fully passed through to the consumers as higher prices. Our estimates suggest that this assumption is inaccurate as only 75 percent of the minimum wage is passed through to consumers, while 25 percent is paid by firm owners. Similarly to MaCurdy (2015), we also examine the consump- tion of households to better understand who buys the goods produced by minimum wage workers but, contrary to him, we find that rich and poor households spend a very similar fraction of their income on goods produced by minimum wage workers.
The paper proceeds as follows. In Section I, we describe the institutional context of the minimum wage increase and our data. In Section II we present evidence on the employment and wage effects of the minimum wage. In Section III, we estimate various margins of adjustment by firms. In Section IV we present a labor demand model with monopolistic competition on the output market and estimate the key parameters of the model. In Section V we present robustness checks and address the potential threats to identification, and we conclude in Section VI.
3 Some other studies have exploited very large minimum wage shocks. Reynolds and Gregory (1965) and Castillo-Freeman and Freeman (1990) study the impacts of imposing the US federal minimum wage on Puerto Rico, which was relatively large but occurred over several years. Moreover, Kertesi and Köll˝o (2004) studied the employment effects of the 2001 raise in the minimum wage in Hungary. Although they use different methods and datasets, many of their estimates are close to ours. Recently, Jardim et al. (2017) examine the short-term impact of the $13 minimum wage in Seattle.
I. Institutional Context and Data
A. Institutional Context
The minimum wage in Hungary is negotiated annually by a national-level tripar- tite council, a consultative body that consists of unions, employers’ associations, and the government.4 If the tripartite council fails to agree, the government is autho- rized to decide unilaterally.
Before 2000, the minimum wage was typically increased by slightly more than the inflation rate each year. However, on April 6, 2000 the right-wing government announced (and later decided unilaterally) that it would raise the minimum wage from 25,500 HUF to 40,000 HUF in January 2001 and also pledged to increase the minimum wage further to 50,000 HUF in 2002.5 This announcement was rather unexpected, since the radical increase of the minimum wage had not previously been part of the political discourse.6 For instance, the unions were demanding a 13 percent increase in minimum wage at the pre-negotiations, so a government pro- posal to double the nominal minimum wage in two years was above all expectations (Tóth 2001). In fact both unions and employers strongly opposed such a radical change to the minimum wage as they were afraid of the negative consequences for jobs.
Government officials stated that the main objectives of the minimum wage increase were to alleviate income differences, to increase government revenue, and to diminish tax evasion (Cserpes and Papp 2008). Political commentators, on the other hand, argued that the real purpose of such a salient and radical change in min- imum wage was to “set the political agenda” and to boost party support.
The main opposition parties did not oppose raising the minimum wage, and so the increase was not reversed after the right-wing government lost the 2002 election.
This is highlighted in Figure 1, which summarizes the evolution of the minimum wage in relation to the median wage in the private sector between 1996 and 2008. It is clear that the large increase in the minimum wage between 2001 and 2002 repre- sented a permanent regime-shift.
The Hungarian economy was performing well and there were no dramatic macro- economic shocks around the time of the reform (see online Appendix Figure A2 for the details). Real per capita GDP growth was around 4 percent before and after the reform. In line with the positive growth rate, aggregate labor market conditions were gradually improving: the employment to population rate increased by 0.5 percent each year between 1997 and 2004 and the unemployment rate fell to 5 percent by 2001 and then remained at this low level. Inflation (CPI) was relatively high (around
4 The council sets the minimum monthly base earnings (total earnings net of overtime pay, shift pay, and bonuses) for a full-time worker. For part-timers, accounting for only 5 percent of all employees in Hungary, the minimum is proportionally lower.
5 The exchange rate was 280 HUF/US$ on January 1, 2001, so the monthly base earnings was increased from
$91 to $179.
6 In the previous general election in 1998, none of the major political parties campaigned for increasing the min- imum wage. However, by the next general election in 2002, all major parties described their positions on minimum wage in their election manifesto. The increased prominence of minimum wage policies highlight that the governing right-wing parties were successful in setting the political agenda with its radical minimum wage policy.
10 percent in 2000) and it was slowly declining. The exchange rate was also stable around the time of the reform.
Other changes in the policy environment could potentially contaminate our results. While our reading of the evidence is that there were no significant changes that could alter our conclusions significantly, we list all relevant policy changes that we are aware of in online Appendix Section A.6 and discuss their potential effects on our results. These policy changes are the following: the expansion of higher education from 1996, small minimum wage compensation schemes in 2001 and 2002, exemption of the minimum wage from personal income taxes in 2002, and a 50 percent increase in public sector base wages in 2002 (see Telegdy 2018). Moreover, throughout the paper we assume that the estimated effects we report are real responses. However, in the presence of tax evasion, some of the estimated effects may reflect only reporting behavior (Elek et al. 2011). In online Appendix Section A.6.5 we present various robustness checks which suggest that our estimates are unlikely to be driven by changes in reporting behavior.
Finally, it is unlikely that firing and hiring restrictions substantially prevented firms from responding to the increased minimum wage: in the period we examine, the strength of employment protection in Hungary was in the bottom third of OECD countries, at a level similar to Switzerland or Japan (OECD 2004).
B. Data and Descriptive Statistics
The main data source in the paper is the Hungarian Corporate Income Tax Data (CIT) that covers the universe of firms with double book-keeping. The data con- tain information on employment, firms’ balance-sheet, and income statements. This panel dataset allows us to follow employment, revenue, profitability, and the cost structure of firms over time. But it does not contain information on worker-level wages.
We observe individual worker-level information for the subset of firms which are in the Hungarian Structure of Earnings Survey (SES).7 The SES collects detailed information on worker-level wages, job characteristics, and demographic charac- teristics. For small firms in the survey (with 5 to 20 employees) we observe all workers, while for larger firms (more than 20 employees) we only observe a random sample of workers. Using individual-level wage information, we calculate the firm- level fraction of the workers below the 2002 minimum wage (adjusted by inflation and GDP growth) for the subset of firms with at least five workers in the SES. We say that these workers were directly affected by the increase in the minimum wage.
To maximize the sample size in our analysis we also predict the fraction of work- ers affected by the increased minimum wage for the firms not in the SES. We extend our sample in the following steps. First, we estimate the relationship between the fraction of workers affected by the minimum wage (observed in the SES) and the average cost of labor (observed in CIT) for the subset of firms included in both datasets. Second, we calculate the predicted fraction of workers affected by the new minimum wage for all firms in the CIT data using the average cost of labor
7 The survey includes 26 percent of all firms in Hungary, representing 70 percent of all workers as larger firms are over-sampled (see online Appendix Section A.5.2 about the sample design).
(observed in the CIT) and the estimated relationship. Third, to reduce noise in the predicted values, we calculate the predicted fraction affected every year between 1997 and 2000 and then we take the average across years.
Our main analysis focuses on the manufacturing, service, and construction sec- tors. We omit the public sector; agriculture; heavily regulated industries (energy, pharmaceuticals); industries where balance sheet items are hard to interpret (finance and insurance); and industries with special excise tax (oil and tobacco), since our revenue measure includes excise taxes. We focus on firms that existed between 1997 and 2000, and we drop firms with the top 1 percent and bottom 1 percent growth rate between 1997 and 2006. We also drop firms where the average wage per worker is less than 90 percent of the minimum wage in any year between 1997 and 2000.
None of these restrictions are crucial, but they reduce the impact of outliers on our estimates. Moreover, in our benchmark specification we omit firms with less than 5 employees.8 In the final sample we have 19,950 firms, representing around one million workers (or one-third of the total workforce in Hungary).
In Table 1 we report the means of some firm-level characteristics in 2000 by sec- tor. An average firm in our sample employs 47 workers, 10 percent of its revenue is earned from exports, and its profitability is 3.2 percent of total revenue. The labor
8 We exclude these micro-enterprises from our analysis for two reasons. First, the relationship between firm- level fraction affected and average cost of labor was estimated on a sample of firms with at least 5 employees, since the SES does not cover smaller firms. Therefore, the prediction of fraction affected for micro-enterprises might be biased. Second, the CIT data are less reliable for the smallest firms because of tax evasion.
Table 1—Summary Statistics of Firm-Level Characteristics in 2000
All Manufacturing Tradable Non-tradable Exporting
(1) (2) (3) (4) (5)
Average wage (1,000 HUF) Mean 847 841 845 679 1,090
Average cost of labor (1,000 HUF) Mean 1,358 1,313 1,316 1,099 1,845
Number of workers Mean 47.1 78.7 80.7 34.9 145
Revenue (1,000 HUF)/labor Mean 17,637 11,047 10,327 20,178 18,110
Capital (1,000 HUF)/labor Mean 3,801 3,560 3,348 3,678 4,659
Export share (export/revenue) Mean 0.10 0.21 0.25 0.06 0.71
Profitability (profit/revenue) Mean 0.032 0.032 0.039 0.021 0.047
Depreciation share (depr/revenue) Mean 0.026 0.038 0.025 0.023 0.027
Labor share (labor cost/revenue) Mean 0.18 0.23 0.25 0.12 0.26
Material share (material/revenue) Mean 0.74 0.69 0.67 0.81 0.64
GAP Mean 0.16 0.14 0.13 0.21 0.090
Fraction affected Mean 0.43 0.39 0.38 0.54 0.25
SD 0.36 0.35 0.34 0.35 0.29
p5 0 0 0 0 0
p25 0.07 0.05 0.20 0.05 0
p50 0.37 0.31 0.56 0.30 0.14
p75 0.77 0.69 0.89 0.66 0.40
p95 1 1 1 1 0.89
Observations 19,485 6,312 4,557 6,196 2,000
Notes: This table shows some summary statistics of the firms in our benchmark sample. All characteristics are eval- uated in 2000 (one year before the minimum wage hike). Tradable and non-tradable sectors are defined as in Mian and Sufi (2014). The exporting sector compromises firms that export at least 40 percent of their total revenue. All statistics are weighted by the logarithm of revenue to be consistent with the regression analyses presented in the paper. The GAP measures the increase in average wage needed to comply to the 2002 minimum wage.
share in total production is 18 percent, while the share of materials (intermediate goods and services) is around 74 percent.9 The fraction of workers affected by the increased minimum wage for an average firm is 43 percent, while the median is 37 percent. The large exposure to the minimum wage is driven by smaller firms where the average cost of labor is often close to the minimum wage. The employment weighted average fraction affected is around 20 percent in our sample. The table also highlights some sectoral differences. Firms in the manufacturing, in the export- ing and in the tradable sectors employ more workers on average, have higher labor share in production, and are also less exposed to the minimum wage than those in the non-tradable sectors.
For a subset of manufacturing firms in the CIT data we also have information on product-level prices from the Hungarian Annual Survey of Industrial Production (ASIP). We use these data to calculate firm-level Laspeyres price indices.
II. Employment Effects of the Minimum Wage
Identification Strategy.—We estimate the employment effects of the minimum wage by comparing the evolution of key outcome variables at firms with many work- ers affected by the minimum wage increase to those firms with few affected work- ers. We closely follow Machin, Manning, and Rahman (2003) and Draca, Machin, and Van Reenen (2011) and estimate regression models of the following form:
(1) _yit − yi2000yi2000 = α t + β t FAi + γ t Xit + ε it ,
where the left-hand side is the percentage change in outcome y between year 2000, the final full calendar year before the minimum wage increase, and year t .10 This specification allows time effects and the impact of firm characteristics, γ t , to vary flexibly over time.
We winsorize the percentage changes, (yit − yi2000 ) / yi2000 , to take values between the first and the ninety-ninth percentile in each year. We include firms that shut down in the analysis as they experienced a 100 percent decline in their employment (and other outcomes). In the main analysis, we measure exposure to the minimum wage, FAi , by calculating the fraction of workers for whom the 2002 minimum wage binds, while in Section VI we explore robustness to alternative measures of exposure such as the “wage gap” measure. As we describe in the data section, we predict FAi from the average cost of labor (observed in CIT) before the minimum wage hike. The regression specification above assumes a linear relationship between exposure to the minimum wage and various outcomes. In online Appendix Figures A5 and A8 we show that nonparametric estimates of the responses we present here are indeed approximately linear.
9 Such a large role for intermediate goods and services at the firm-level is not unusual in European countries (see online Appendix Table A1).
10 The minimum wage hikes were announced in year 2000, so it is possible that outcomes in 2000 were already affected. However, we do not detect any unusual changes in year 2000 and so any anticipation effects must be small.
We restrict our sample to firms that existed between 1997 and 2000. We estimate robust standard errors11 and we use the logarithm of the revenue in 2000 as weights in our regressions.12 In our benchmark regression we control for firm age, the legal form of organization (e.g., limited liability company, publicly traded, etc.), and the following variables and their squares: average export share between 1997 and 2000;
average profitability between 1997 and 2000; the average share of labor between 1997 and 2000; average depreciation rate between 1997 and 2000; the average share of wage cost in total labor cost between 1997 and 2000; and the average industry level import exposure between 1997 and 2000. In Section V we also explore includ- ing three-digit NACE industry dummies.
The key identification assumption in this difference-in-differences type of regres- sion is that changes at firms with fewer minimum wage workers are a valid estimate of the counterfactual for firms with many affected workers and so these firms would follow a parallel trend in the absence of the minimum wage increase. While this assumption cannot be tested directly, we test whether the parallel trends assumption holds before the minimum wage hike. Reassuringly, we cannot reject the presence of differential trends in most specifications.
There are various limitations of the approach presented here. First, β t identifies responses relative to the untreated firms (which requires the Stable Unit Treatment Value Assumption (SUTVA)). Second, equation (1) only shows the effect on exist- ing firms. In Section V we return to these issues and show that these shortcomings are unlikely to affect our key results.
Employment Effects.—The estimates for employment from regressions of equa- tion (1) are summarized in panel A of Table 2. Columns 1 and 2 show the effects of the minimum wage two years after the minimum wage hike. The point estimate in column 1 indicates that the employment declines by 7.8 percent (SE 0.8 percent) more at firms where 100 percent of the workforce is directly affected by the mini- mum wage relative to firms where there are no exposed workers. Remember, in our analysis we also include firms which shut down. Therefore, the results presented here reflect firms’ decisions on both the extensive margin (closing) and intensive margin (layoffs). The estimated employment loss is slightly smaller (7.6 percent, SE 1.0 percent) if we control for the rich set of observable characteristics described above (see column 2).
In columns 3 and 4 we examine the “medium-term” employment effects by estimating employment changes between 2000 and 2004. The specification with controls shows that employment is around 10.0 percent (SE 1.2 percent) lower at firms with 100 percent exposure relative to a firm with no exposure. This highlights
11 Using the predicted FAi instead of the actual FAi can potentially bias the estimates of our the standard errors.
In online Appendix Section A.5.3 we show that the bias from predicting FAi is negligible.
12 Most papers in the minimum wage literature do not use weights in firm-level regressions (Machin, Manning, and Rahman 2003; Draca, Machin, and Van Reenen 2011; Hau, Huang, and Wang 2016; Kertesi and Köll˝o 2004; Mayneris, Poncet, and Zhang 2018). A notable exception is Card and Krueger (1994) who report estimates from regressions using employment weights. In our case, using the level of employment or the level of revenue as weights would be problematic as the distributions of these variables are highly skewed (e.g., the employment has a Pareto tail with α = 1.5 ) and so the mean and the variance of the weights are not finite. Therefore, the central limit theorem does not hold in the level-weighted regressions. To avoid using highly skewed weights we use the logarithm of revenue as weights.
that the medium-term employment effects are somewhat larger than the short-term effects (10.0 percent versus 7.6 percent), but 76 percent of the total employment loss occurred within two years of the minimum wage hike. This pattern is also underscored in panel A of Figure 2, where we plot the evolution of the relationship between fraction affected and the change in employment over time.
How do these estimates relate to the previous literature? In panel A of Table 2 we report the employment elasticity with respect to the minimum wage for the
Table 2—Employment and Wage Effects Main
changes between 2000 and 2002
Main changes between
2000 and 2004
Placebo changes between
2000 and 1998
(1) (2) (3) (4) (5) (6)
Panel A. Change in firm-level employment
Fraction affected −0.078 −0.076 −0.093 −0.100 −0.003 0.002
(0.008) (0.010) (0.012) (0.012) (0.008) (0.009)
Constant −0.050 −0.105 0.046
(0.005) (0.007) (0.005)
Observations 19,485 19,485 19,485 19,485 19,485 19,485
Employment elasticity with −0.11 −0.10 −0.15 −0.15 respect to MW (directly affected) (0.01) (0.01) (0.02) (0.02) Panel B. Change in firm-level average wage
Fraction affected 0.53 0.58 0.48 0.54 −0.02 −0.03
(0.01) (0.01) (0.01) (0.01) (0.003) (0.01)
Constant 0.08 0.16 −0.08
(0.002) (0.01) (0.001)
Observations 18,415 18,415 16,980 16,980 19,485 19,485
Employment elasticity −0.15 −0.13 −0.20 −0.18
with respect to wage (0.02) (0.02) (0.03) (0.03) Panel C. Change in firm-level average cost of labor
Fraction affected 0.47 0.49 0.41 0.43 −0.03 −0.04
(0.01) (0.01) (0.01) (0.01) (0.003) (0.01)
Constant 0.04 0.10 −0.04
(0.001) (0.002) (0.001)
Observations 18,415 18,415 16,980 16,980 19,485 19,485
Employment elasticity −0.17 −0.16 −0.22 −0.23
with respect to cost of labor (0.02) (0.02) (0.03) (0.03)
Controls No Yes No Yes No Yes
Notes: This table shows the firm-level relationship between the fraction of workers exposed to the minimum wage and the change in employment (panel A), the change in average wage (panel B), and the change in average cost of labor (panel C). The cost of labor includes wages, social security contributions, and non-wage labor expenses. The estimates are based on equation (1). The employment changes include both extensive margin (closing) and inten- sive margin (layoff) decisions. Columns 1 and 2 show the short-term effects (the change between 2000 and 2002), columns 3 and 4 the medium-term changes (changes between 2000 and 2004). Columns 5 and 6 test for the pres- ence of preexisting trends by looking at the effect on “placebo” changes, which equal to the year 1998 outcome minus the year 2000 outcome. Columns 1, 3, and 5 show the raw correlations, while columns 2, 4, and 6 show the estimates when we control for firm age, the legal form of organization (e.g., limited liability company, publicly traded, etc.), and the following variables and their squares: average export share between 1997 and 2000; average profitability between 1997 and 2000; the average share of labor between 1997 and 2000; average depreciation rate between 1997 and 2000; the average share of wage cost in total labor cost between 1997 and 2000; and the average industry level import exposure between 1997 and 2000. We winsorized all outcome variables at 1 percent and 99 percent levels for each year. Robust standard errors are reported in parentheses.
directly affected workers ( %ΔEmp/%ΔMW ). To compare these estimates to the ones reported in existing literature, we need to take into account that elasticities are often reported for a particular group of workers (e.g., teenagers or restaurant work- ers). As a result, we need to multiply our estimates for the directly affected workers by the fraction of workers directly affected in that particular group. For instance, to compare our results to the estimates in the US literature that mainly focus on teenage workers, we need to multiply our estimates by 0.25, which is the share of directly affected teenagers in the United States in 2012. Therefore, our estimates in panel A imply that the teen employment elasticity is between −0.02 and −0.04 depending on the specification considered. These employment elasticities are an order of magnitude smaller than the range of −0.1 to −0.3 suggested by Neumark
Figure 2. Effect on Employment and on Wages
Notes: This figure shows the relationship between changes in different outcome variables and the fraction of work- ers affected by the minimum wage hike over time (beta coefficients with its 95 percent confidence intervals from equation (1)). Panel A shows the effects on changes in employment. The employment changes include both exten- sive margin (closing) and intensive margin (layoff) decisions. Panel B shows the effect on firm-level average wage (total wage bill per worker) and average labor cost (total labor cost per worker). The cost of labor includes wages, social security contributions, and non-wage labor expenses. The ratio of panel A and panel B determines the employment elasticity. Controls are included in the regressions.
−0.3
−0.2
−0.1 0 0.1 0.2 0.3 0.4 0.5 0.6
Effect on employment
1997 1998 1999 2000 2001 2002 2003 2004
1997 1998 1999 2000 2001 2002 2003 2004
Panel A. Effect on employment
−0.3
−0.2
−0.1 0 0.1 0.2 0.3 0.4 0.5 0.6
Effect on labor cost per worker
Labor cost (wage + non-wage expenses) per worker Average wage
Panel B. Effect on average labor cost
and Wascher (2010) or Brown (1999), but are in line with some recent meta-anal- yses in the literature (Belman and Wolfson 2014, CBO 2014, Doucouliagos and Stanley 2009, MaCurdy 2015).
Two points should be noted. First, columns 5 and 6 in Table 2 and panel A of Figure 2 show the relationship between exposure to the minimum wage and employment preceding the minimum wage hike. Consistent with a causal interpre- tation of our estimates, the pre-reform changes in employment are close to zero and the negative relationship emerged exactly at the timing of the reform.
Second, as we mentioned before, we show in online Appendix Figure A5 that the nonparametric relationship between employment changes and exposure to the minimum wage is linear. Notice that such a linear relationship is hard to reconcile with the presence of imperfect competition and monopsony power in the labor mar- ket. If firms face upward-sloping labor supply curves, we would expect that small minimum wage shocks would have a small or even positive effect on employment, but for large shocks the effect should be negative (Manning 2003). Therefore, the presence of monopsonistic competition would predict that the relationship between minimum wage exposure and the disemployment effects should be nonlinear, con- trary to our empirical findings.
Effects on Wages and the Cost of Labor.—The size of the employment effect should be compared to the wage effects (Machin, Manning, and Rahman 2003). We investigate the effect on wages by estimating the firm-level relationship between fraction of affected workers and the percentage change in the wage for an average worker using equation (1). Since we can only calculate wage changes for the firms that survived, we restrict the sample to those.13
We use two concepts of remuneration in this section: wages and cost of labor. This latter differs from the former because it does not only include wages, but employer’s social security contributions and non-cash employment benefits as well. In panel B of Table 2 we report the effect of the minimum wage on wages. This is what most papers in the literature estimate and so it is useful for comparing our results to exist- ing studies. In panel C of Table 2 we report estimates on the average cost of labor.
This measure is what firms take into account when they make their firing and hiring decisions.
Columns 1 and 2 in panel B of Table 2 highlight that the minimum wage had a very large and statistically significant effect on average wages in the short run. For instance, column 2 in panel B shows that firms with 100 percent fraction affected experienced a 58 percent (SE 1 percent) increase in their average wage relative to those with no affected workers in 2002. The increase in cost of labor was around 15 percent less at 49 percent (see panel C). The lower impact on labor cost simply reflects that the wage increase is compared to a higher base which includes social security contributions and non-cash benefits. We find no indication that firms tried to offset the wage increase by cutting non-wage benefits.
13 Firms’ closure might not occur at random. In online Appendix Table A2 we report estimates in which we correct for nonrandom exit by following Johnson, Kitamura, and Neal (2000). The results are very similar to those presented here.
Columns 3 and 4 of Table 2 show that the effect on average wage is slightly lower in the medium term, because the real value of minimum wage was somewhat lower in 2004 than in 2002 (see Figure 1). For instance, the wage effects are 54 percent (SE 1 percent) in the medium term. Panel B in Figure 2 shows the evolution of wage effects and cost of labor effects over time. Two points should be noted. First, before the reform there is no clear relationship between fraction affected and the change in either the wage or the cost of labor, while both the wage and the cost of labor increased dramatically at highly exposed firms after the reform. Second, the time pattern of the wage increase (with the effect highest in 2002 before dropping slightly in 2003) closely resembles the evolution of the minimum wage in Figure 1.
This implies that the changes in wages are likely to be related to the minimum wage change and not to something else.
Figure 2 also highlights the size of the wage and cost of labor effects (panel B) relative to the employment effects (panel A). To make these two comparable, we use the same scale in both panels. The large differences in the percentage changes in wage and employment highlight that the wage effect of the minimum wage dominates the employment responses. This is also reflected in the employ- ment elasticities with respect to the wage, i.e., ratios of the (estimated) percentage change in employment and the (estimated) percentage change in wages that we report in panel B of Table 2, and the employment elasticities with respect to the cost of labor that we report in panel C. The short-run elasticity for wages is around
−0.13 (SE 0.02), while the medium-run is slightly higher (−0.18, SE 0.03). The employment elasticity with respect to labor cost is slightly higher (in absolute terms) at −0.16 (SE 0.02) two years after, and −0.23 (SE 0.03) four years after the minimum wage hike. These elasticities are at the lower end of the literature but lie within the 95 percent confidence intervals of most previous estimates.14 Moreover, the precision of our estimates is an order of magnitude smaller than previous estimates, even though many papers in the literature do not calculate robust standard errors. The relatively small standard errors are the consequence of the uniquely large and persistent minimum wage shock considered here. The mag- nitude of the reform delivers a large and precisely estimated effect on wages (e.g., 58 percent with 1 percent SE in 2002). When we divide the employment effects by this precisely estimated wage effect, the standard errors on our employment elasticities remain small.
It is also worth mentioning that, while the employment elasticities gradually increase (in absolute value) up to 2003, they stabilize after. The employment elas- ticity with respect to labor cost is −0.22 in 2003, which is almost the same as the 2004 estimates (−0.23). This suggests that the medium-term employment elas- ticity also reflects long-term responses. Moreover, the quick convergence in the elasticities underscores that firms responded quickly to the radical change in the minimum wage.
14 In online Appendix Figure A7 we contrast our employment elasticities with the findings in the previous literature.
III. Firms’ Margins of Adjustment and the Incidence of the Minimum Wage The previous section shows that the minimum wage increase had a large positive effect on real wages and a small negative effect on employment. The simple conse- quence of this finding is that the income of low wage workers increased in response to the minimum wage. However, this income gain must be paid for by others in the economy. In this section we examine behavioral responses of firms at various mar- gins in order to better understand who bears the incidence of the minimum wage.
A. Firms’ Margins of Adjustment
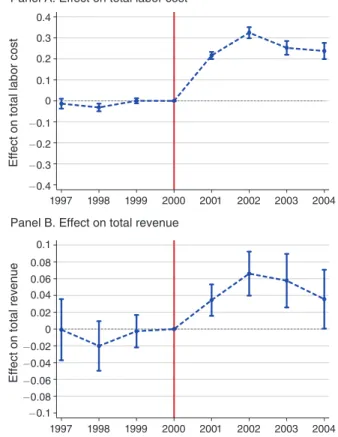
Labor Cost.—We first document the effect of the minimum wage on total labor cost, which is a proxy for total income collected by workers. Again we estimate the relationship between the fraction of workers affected by the minimum wage and the change in total labor cost four years before and four years after the minimum wage increase using equation (1). Panel A of Table 3 shows the estimated coefficients, while Figure 3 plots them over time. Figure 3 (and also column 3 of Table 3) shows that firms with different levels of minimum wage exposure follow a parallel trend before the minimum wage hike. However, this trend broke exactly in 2001, when the minimum wage was raised. The increase in labor cost at firms where 100 per- cent of the workers earned below the new minimum wage was 32.5 percent (SE 1.3 percent) and 23.8 percent (SE 2.0 percent) higher two and four years after the minimum wage hike relative to a firm with no workers below the new minimum.
This large increase in firms’ labor cost is in line with our previous findings on wages and employment.
Revenue.—We examine the effect on revenue in panel B of Table 3 and in panel B of Figure 3. The relationship between the minimum wage and revenue exhibits a similar pattern to the labor cost. Highly exposed and less exposed firms follow a par- allel trend before the reform, but this trend breaks exactly at the time of the reform.
Total revenue increased by 6.6 percent (SE 1.3 percent) more at highly exposed firms two years after the hike and by 3.6 percent (SE 1.8 percent) four years after.
The considerable increase in revenue suggests that a part of the labor cost increase was financed by consumers.
Price.—Is the increase in revenue caused by higher output or by higher prices?
We examine the effect of the minimum wage on prices in the manufacturing sector where we have access to firm-product level price data for a large sample, cover- ing around 50 percent of firms. We construct a firm-level Laspeyres price index by weighting product-level price changes by the product’s revenue share in the firm’s output portfolio, and then we estimate the effect of the minimum wage on this price index using equation (1).15 Column 1 of Table 4 shows the raw correlation between fraction affected and the change in output prices. The estimates show that prices increased by 7.4 percent (SE 2.4 percent) in the short term and by 13.4 percent (SE
15 See online Appendix Section A.5.5 for further details on how we construct our price index.
4.5 percent) in the medium term. Controlling for observable characteristics (column 2) slightly decreases the estimates to 4.3 percent (SE 2.8 percent) in the short term and 10.8 percent (SE 4.8 percent) in the medium term. Panel C also reports the rela- tionship between exposure to the minimum wage and prices in the periods before the minimum wage reform, and we do not find evidence for preexisting trends.16
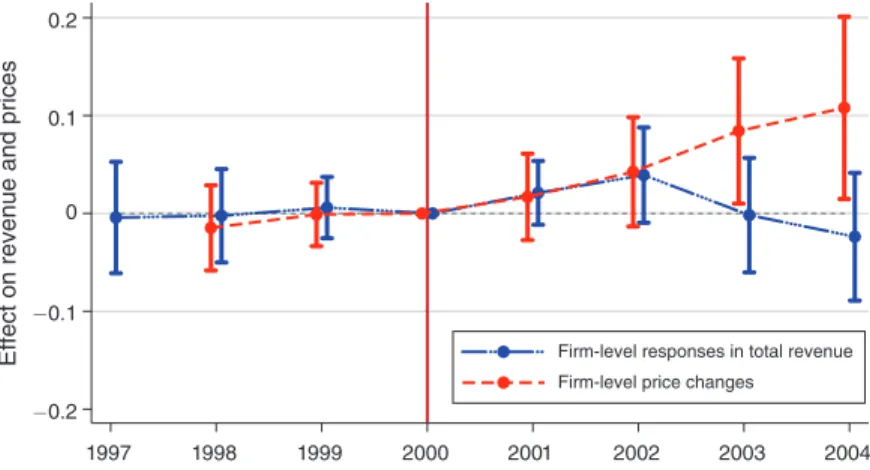
The red dashed line in Figure 4 plots the estimated coefficients from column 2 of Table 4 over time. The graph provides further support for the findings in Table 4. It demonstrates the absence of a relationship between the minimum wage and price changes before the reform and the emergence of a large and significant positive price effect after the minimum wage hike. The figure also suggests that the price
16 Raising prices is likely to be the hardest in the manufacturing sectors, where firms face foreign competition.
Therefore, even though we cannot assess the price effects outside of manufacturing, it is likely that price increase played a key role in other sectors as well.
Table 3—Firms’ Margins of Adjustment Main
changes between 2000 and 2002
Main changes between
2000 and 2004
Placebo changes between
2000 and 1998
(1) (2) (3)
Panel A. Change in total labor cost
Fraction affected 0.325 0.238 −0.031
(0.013) (0.020) (0.009)
Panel B. Change in revenue
Fraction affected 0.066 0.036 −0.020
(0.013) (0.018) (0.015)
Panel C. Change in materials
Fraction affected 0.049 0.021 -0.008
(0.014) (0.019) (0.019)
Panel D. Change in capital
Fraction affected 0.148 0.270 −0.006
(0.034) (0.054) (0.015)
Panel E. Change in profits (relative to revenue in 2000)
Fraction affected −0.011 −0.008 0.006
(0.003) (0.004) (0.004)
Observations 19,485 19,485 19,485
Controls Yes Yes Yes
Notes: This table shows the firm-level relationship between the fraction of affected work- ers and the percentage change in various outcomes (see equation (1)). The first two columns show our main results by looking at changes between 2000 and 2002 (short-term) and changes between 2000 and 2004 (medium-term). The output changes include both intensive margin and firm closure responses. Column 3 tests for the presence of preexisting trends by looking at the effect on “placebo” changes, which equal to the year 1998 outcome minus the year 2000 outcome. Regressions are weighted by the logarithm of revenue in 2000. We control for firm age, the legal form of organization (e.g., limited liability company, publicly traded, etc.), and the following variables and their squares: average export share between 1997 and 2000; aver- age profitability between 1997 and 2000; the average share of labor between 1997 and 2000;
average depreciation rate between 1997 and 2000; the average share of wage cost in total labor cost between 1997 and 2000; and the average industry level import exposure between 1997 and 2000. We winsorized all outcome variables at 1 percent and 99 percent levels for each year.
Robust standard errors are reported in parentheses.
responses to the minimum wage occur gradually as it takes time for firms to adjust their prices.
We also explore further robustness checks related to the price effects in Table 4. In the short term, we have more firms with price data than in the medium term (3,252 in 2002 and 2,541 in 2004), because some firms shut down or otherwise leave the survey over time. In columns 3 and 4 we examine whether the differential short- and long-term price changes are caused by changes in the sample composition and we find no indication for that.
What is the effect on quantity sold? The blue solid line in Figure 4 plots the size of the revenue effects in the manufacturing sector. The figure highlights that the revenue change, which measures the change in the product of price and quantity, is lower than the price change after 2002. This implies that the quantity fell in response to the minimum wage after 2002. Such a drop in output and increase in prices are not in line with the basic predictions of the monopsony model (Aaronson and French 2007), since in those models a minimum wage induces firms to hire more, which eventually leads to higher output and lower prices.
Figure 3. Effect on Total Labor Cost and on Revenue
Notes: This figure shows the relationship between changes in different outcome variables and the fraction of work- ers affected by the minimum wage hike over time (beta coefficients with its 95 percent confidence intervals from equation (1)). Panel A shows the effects on changes in total labor cost, while panel B on changes in total revenue.
Both panel A and panel B show regression results which include firms’ extensive (firm closure) and intensive mar- gin responses. Controls are also included in the regressions.
−0.4
−0.3
−0.2
−0.1 0 0.1 0.2 0.3 0.4
Effect on total labor cost
1997 1998 1999 2000 2001 2002 2003 2004 Panel A. Effect on total labor cost
−0.1
−0.08
−0.06
−0.04
−0.02 0 0.02 0.04 0.06 0.08 0.1
Effect on total revenue
1997 1998 1999 2000 2001 2002 2003 2004 Panel B. Effect on total revenue