CERS-IE WORKING PAPERS | KRTK-KTI MŰHELYTANULMÁNYOK
INSTITUTE OF ECONOMICS, CENTRE FOR ECONOMIC AND REGIONAL STUDIES,
Tax Evasion and the Minimum Wage
ANIKÓ BÍRÓ – DÁNIEL PRINZ – LÁSZLÓ SÁNDOR
CERS-IE WP – 2020/43
October 2020
https://www.mtakti.hu/wp-content/uploads/2020/10/CERSIEWP202043.pdf
CERS-IE Working Papers are circulated to promote discussion and provoque comments, they have not been peer-reviewed.
Any references to discussion papers should clearly state that the paper is preliminary.
Materials published in this series may be subject to further publication.
ABSTRACT
Exploiting a change in reporting defaults and the implied audit threat in Hungary, we demonstrate that a substantial portion of employees and the self-employed reporting to earn the minimum wage have much higher earnings in reality. This can be seen from their sharp but temporary jump to the new reporting default, a twofold increase in reported earnings. Consistent with misreporting, the response is concentrated both spatially and by employer and the distribution of covariates around the threshold exhibits anomalies. Requiring individuals reporting to earn the minimum wage to pay higher taxes or ask for explicit exceptions increases reported earnings for some and decreases formal employment for others, suggesting a trade-off for taxation. We formalize the empirical findings in a model of minimum wage taxation where earnings underreporting around the minimum wage would justify a move towards higher taxation of those earnings, more aligned with a prevalent international practice.
JEL codes: H26, J31
Keywords: minimum wage, tax evasion, audit, Hungary
Anikó Bíró
Health and Population Lendület Research Group, Centre for Economic and Regional Studies
e-mail: biro.aniko@krtk.mta.hu
Dániel Prinz
Harvard University
e-mail: dprinz@g.harvard.edu
László Sándor
University of Luxembourg
e-mail: laszlo.sandor@uni.lu
Adócsalás és a Minimálbér
BÍRÓ ANIKÓ – PRINZ DÁNIEL – SÁNDOR LÁSZLÓ
ÖSSZEFOGLALÓ
Kihasználva az adórendszer és adóellenőrzés változásait, tanulmányunkban bemutatjuk, hogy a magánszektorban alkalmazottak és az egyéni vállalkozók körében a minimálbérre bejelentett dolgozók jelentős része valójában lényegesen többet keres.
Ezt onnan látjuk, hogy a kétszeres minimálbérszabály bevezetésekor a korábban minimálbért jelentők jelentős részének a keresete átmenetileg a minimálbér kétszeresére ugrott fel. Az adócsalásra utal, hogy a kétszeres minimálbérszabályra való reakció mind térben, mind a foglalkoztatók között koncentrált, valamint egyéb megfigyelt egyéni jellemzők is anomáliákat mutatnak a kétszeres minimálbér szintje körül. A minimálbért jelentők magasabb adóztatása vagy a magasabb adózás alóli mentességnek az adóhivatalnál való kérelmezésének a megkövetelése azt eredményezi, hogy a bejelentett keresetek emelkedése mellett, ellentételező hatásként, a formális foglalkoztatás aránya is csökken. Az empirikus eredményeket egy munkakeresleti és adókerülési modell keretébe illesztjük. Modellünk fő eredménye, hogy a magasabb (adóztatott) minimálbér helyettesítője a hatékonyabb adóbehajtásnak, összhangban a nemzetközi gyakorlattal.
JEL: H26, J31
Kulcsszavak: minimálbér, adócsalás, adóellenőrzés
Tax Evasion and the Minimum Wage
∗Anikó Bíró
Centre for Economic and Regional Studies, Health and Population “Lendület” Research Group
Dániel Prinz Harvard University
László Sándor University of Luxembourg
October 2020
Abstract
Exploiting a change in reporting defaults and the implied audit threat in Hungary, we demonstrate that a substantial portion of employees and the self-employed reporting to earn the minimum wage have much higher earnings in reality. This can be seen from their sharp but temporary jump to the new reporting default, a twofold increase in reported earnings.
Consistent with misreporting, the response is concentrated both spatially and by employer and the distribution of covariates around the threshold exhibits anomalies. Requiring individuals reporting to earn the minimum wage to pay higher taxes or ask for explicit exceptions increases reported earnings for some and decreases formal employment for others, suggesting a trade-off for taxation. We formalize the empirical findings in a model of minimum wage taxation where earnings underreporting around the minimum wage would justify a move towards higher taxation of those earnings, more aligned with a prevalent international practice.
∗Bíró: biro.aniko@krtk.mta.hu. Prinz: dprinz@g.harvard.edu. Sándor: laszlo.sandor@uni.lu Anikó Bíró was supported by the “Lendület” program of the Hungarian Academy of Sciences (grant number: LP2018-2/2018). We thank Dóra Benedek, István Boza, Enrico Di Gregorio, Győző Gyöngyösi, Steve Hamilton, Nathan Hendren, Herwig Immervoll, Anders Jensen, Yunan Ji, Gábor Kertesi, Judit Krekó, Frina Lin, Attila Lindner, Juliana Londoño-Vélez, Krisztina Orbán, Matteo Paradisi, Balázs Reizer, Ágota Scharle, Stefanie Stantcheva, Lajos Szabó, Matt Weinzierl, and participants at the Harvard Kennedy School Applied Microeconomics Seminar, the NBER Aging and Health Trainee Seminar, the Szirák Labor Market Conference, the University of Edinburgh, the Hungarian Economic Association Annual Conference, the Centre for Economic and Regional Studies, the ZEW – Leibniz Centre for European Economic Research, the World Bank Tax Conference, and the Harvard Graduate Student Workshop in Public Economics and Fiscal Policy for helpful comments. Attila Sárkány provided excellent research assistance. The data used in this paper is under the ownership of the Central Administration of National Pension Insurance, the National Health Insurance Fund Administration, the Educational Authority, the National Tax and Customs Administration, the National Labor Office, and the Pension Payment Directorate of Hungary. The data was processed by the Institute of Economics,
1 Introduction
Why would we tax the minimum wage? Gross minimum wages can be twice as high as the net in some countries. Even with quite inelastic labor demand, one would think that a lower tax burden could boost employment with the same take-home pay. This paper presents evidence for one potential justification for high and taxed minimum wages: they recover some tax revenue from higher earners who underreport their income.
As long as firms can hire some of their workers informally, the minimum wage is a critical threshold: the least reported pay registered employees can get away with. Registration lowers firms’
risk of getting caught relative to having unreported employees. It is also the lowest wage that a worker can legally report and still qualify for social security benefits or health insurance. This suggests that firms and workers may collude in substantial underreporting of earnings specifically at the minimum wage and that many workers who declare the minimum wage may be making more.
In this paper, we demonstrate that misreporting is an empirically relevant phenomenon even in a high-income country, with implications for the optimal taxation of the minimum wage. We do so by exploiting a unique policy in Hungary that introduced a new audit threshold at twice the amount of the monthly minimum wage. Between late 2006 and 2010, firms were required to pay social security contributions based on at least twice the amount of the monthly minimum wage or ask for an exception. In the latter case, they understood to face higher probabilities of audit from tax authorities. We examine how firms’ reporting behavior and the employment of affected workers changed. In our panel, we can track workers over time, and examine at the individual level whether someone was moved by this regulation, the so-called “double minimum wage rule.”
We find that firms responded to the new threshold in ways that are consistent with substantial underreporting of earnings precisely at the minimum wage. Specifically, we find that 10.5% of private-sector employees and 19.2% of the self-employed who declared the minimum wage before the reform reported monthly earnings exactly twice the minimum soon after. This phenomenon suggests that they earned extra off the books prior to the reform. In the years after the initial introduction of the new threshold, the concentration of earnings at the threshold decreases, most likely because of firms’ changing perception of the audit threat.
We document other patterns consistent with previous underreporting. First, there is no response
by public sector employees to the introduction of the new threshold. Second, the response is more pronounced in the industries most prone to tax evasion. Third, the response is concentrated in small and domestic companies and is larger for less productive companies. Fourth, individuals who respond look very different from individuals who report just below or just above the threshold on a variety of measures. Fifth, the response is concentrated within firms. Sixth, the response is concentrated within specific geographic areas.
After describing changes in wage reporting consistent with previous underreporting, we show that in response to the policy some workers exit formal employment. Specifically, we show that when the government introduced the reform, workers who reported earning the minimum wage were more likely to leave formal employment than workers who reported low earnings above the minimum wage. We find that around 2% of private sector employees exit formal employment as a consequence of the reform. This exit response leads to a loss in tax revenue, in contrast with the higher tax revenue from those who “comply” by reporting higher earnings than before. This implies a trade-off for governments taxing these low incomes: a broader tax base as some workers and firms formalize more of their income but also a concurrent loss as others go entirely informal.
In the last part of the paper, we formalize this observed trade-off in our model. Abstracting away from the labor supply decision, surplus producing jobs will legitimately bunch at the minimum wage and thus mask misreporting also constrained by the coinciding enforcement threshold. The value of raising the minimum wage is a function of the density of the skill distribution as well as social welfare weights. However, weaker enforcement, a lower audit probability above the minimum wage, raises the value of a minimum wage hike under fairly general conditions. Enforcement, which is presumably costly, is thus a substitute for a higher minimum wage.1
Related Literature. Our work contributes to the literature on tax compliance and evasion, including recent work on audit threats (Kleven et al.,2011;Best,2014;De Andrade, Bruhn and McKenzie,2014;Hashimzade, Myles and Rablen,2016;Bérgolo et al., 2017;Almunia and Lopez- Rodriguez,2018;Di Gregorio and Paradisi,2019;Choudhary and Gupta,2019) and other policies
1Strictly speaking, governments usually tax annual income and not wages or even earnings, and we do not mean to use these words interchangeably. That said, in countries with individual taxation, stable incomes throughout calendar years, and few deductions or credits, many minimum wage earners pay similar and predictable taxes after their labor income. Some countries routinely report net minimum wages from these implied taxes, which we also report in our Table1.
that encourage formalization and compliance (de Mel, McKenzie and Woodruff,2013;Pomeranz, 2015;Naritomi,2019; Kumler, Verhoogen and Frías, 2020).2 We provide evidence on a policy, a mixture of presumptive taxation and a targeted audit threat, that can recover some tax revenue lost to misreporting when various considerations limit the set of possible policies and targeting tools.
We also contribute to the literature on informal employment and taxation (Kuehn, 2014;Meghir, Narita and Robin,2015;Gerard and Gonzaga,2016;Rocha, Ulyssea and Rachter,2018;Ulyssea, 2018).3 Using population-wide administrative data, we are able to track workers as they reported earnings increase, but also when they exit from formal employment. Our work suggests that tax enforcement may generate trade-offs for informality: it can formalize the earnings of some workers, while other workers’ earnings will become entirely informal.
Our results on reporting responses to the double minimum wage rule allow us to measure underreporting around the minimum wage (Reizer, 2011;Elek, Köllő, Reizer and Szabó,2012).4 Our results indicate that in addition to increases in reported earnings by some workers previously reporting the minimum wage, other workers may opt out of formal employment. All this builds towards a pragmatic evaluation of minimum wage levels and the tax treatment of corresponding earnings.5 The well-known result of Lee and Saez (2012) is that under perfect competition and efficient rationing of jobs the coexistence of a minimum wage with a positive tax rate on low-skilled work is Pareto inefficient.6 At the same time, a substantial tax burden falls on minimum wage earners in many OECD countries (OECD,2007). Our findings suggest that the revenue recovered from higher earners who misreport their earnings could partly rationalize taxing the minimum wage.7
The remainder of this paper proceeds as follows. We begin in Section2by providing background on the Hungarian tax system and the double minimum wage rule. Section 3 reviews bunching at
2SeeAndreoni, Erard and Feinstein(1998) andSlemrod(2019) for comprehensive reviews of the literature on tax compliance and enforcement.
3The informal economy and pay misreporting is sizable not only in low- and middle-income countries but in the high-income countries of Central and Eastern Europe, where some estimates put the size of the informal economy to 20% of GDP. (Williams and Padmore,2013;Williams,2013;Paulus,2015).
4Informal employment can also evade the minimum wage regulation itself. Clemens and Strain(2020) argue that subminimum wage payments are prevalent even in the American low-wage labor market.
5For recent evidence on the effects of minimum wage increases, seeBossavie, Acar and Makovec(2019),Cengiz, Dube, Lindner and Zipperer(2019),Harasztosi and Lindner(2019), andDustmann et al.(2020).
6Lavecchia(2020) motivates minimum wages accompanying optimal but second-best non-linear income taxes as a relief on low-skilled labor market tightness above socially optimal levels because of a search congestion externality or constrained optimal redistribution in the tax system.
7SeeTonin(2011) andTonin(2013) for earlier work on the minimum wage and tax evasion.
enforcement thresholds, motivating our empirical strategy. In Section4, we describe the data used.
Section5summarizes our methods and empirical framework. Section6 presents our results. Section 7presents a model of taxation of the minimum wage when underreporting is a concern at this point in the wage distribution. Finally, Section 8concludes.
2 Background
2.1 Institutional Context
Hungary has long had a legal minimum wage. The minimum wage is mostly discussed as the monthly minimum for full-time workers, but proportional amounts are set for weekly and hourly pay as well.
After a large 2001 raise, the gross minimum wage remained relatively stable, while the net minimum wage fluctuated along with changes in the tax system. In real dollar terms, the net minimum wage rose 3.4% per year on average over this period. Income is taxed on an annual basis throughout the period, so our discussion of the tax treatment of the minimum wage assumes full-time, full-year employment at the prevailing minimum wage. We also abstract from tax deductions and credits.
Gross and net monthly minimum wages and the Guaranteed Minimum Wage for skilled jobs assumed to require a high school diploma introduced in 2006 are tabulated in Table1.
Labor income is taxed heavily in Hungary. Between 2003 and 2011, the years covered by our data, the average tax wedge varied between 46% an 55%, without any major reforms in the taxation of labor income. In 2006 for instance, Hungary had the third largest average tax wedge among 36 OECD countries (OECD,2019). Labor income taxes include a payroll tax (in 2006, 18% on the first 1,550,000 HUF, 36% above), social security contributions paid by the employee (15.5% in 2006), and social security contributions paid by the employer (altogether 30% in 2006). In Hungary, the tax wedge on minimum wage earners is high and close to the average tax wedge. Table 2shows the payroll tax and social security contribution rates by year.
Two major forms of informal employment have been documented in Hungary. The first is undeclared work, when no employment relationship is reported to the tax authority, and consequently neither the employer, nor the employee pays any taxes. Based on discrepancies between pension fund microdata and survey evidence, in the early 2000s 16-17% of employees were undeclared (Elek, Scharle, Szabó and Szabó,2009b;Benedek, Elek and Köllő,2013). The second form is wage
underreporting, when an employment relationship is reported to the tax authority but reported earnings are substantially lower than true earnings. Since some taxes are paid on this work, this form of employment is more costly than undeclared work, but it also offers certain advantages for both employers and employees. Employers may appear more legitimate to the tax authority and they may be able to rely more on their employees since a formal employment contract exists.
Employees can also enjoy some protections of a formal work contract and reporting some earnings qualifies them for a wide set of benefits, including public health insurance, disability insurance, unemployment insurance, and pensions. A common form of “grey” employment in Hungary is the reporting of wages at the minimum wage while supplementing earnings in cash (Elek, Scharle, Szabó and Szabó,2009a;Elek, Köllő, Reizer and Szabó,2012).8
2.2 Double Minimum Wage Rule
In order to reduce wage underreporting, Hungary introduced a so-called “double minimum wage rule” in 2006. This rule required employers to pay social security contributions on at least twice the minimum wage for an employee. Employers could ask for an exemption from this rule on a special form if their true wages were lower than twice the amount of the minimum wage, indicating the exact amount of wages. This could then increase the probability of a tax audit. If the reported wage was below twice the the amount of the minimum wage but no exemption was requested then the employer had to pay the employers’ social security contributions based on twice the amount of the minimum wage, plus also had to pay the employees’ social security contributions for the difference between the reported wage and twice the amount of the minimum wage. This rule incentivized employers to either request an exemption from the rule or to report at least twice the amount of the minimum wage towards tax authorities. The double minimum wage rule applied to both private sector employees and the self-employed. The rule was in effect between September 1, 2006 and December 31, 2010.
The double minimum wage rule can be considered presumptive taxation. A presumed tax base is a substitute for a desired tax base; the presumed tax base is derived from items that are easier to monitor. Presumptive taxation exists whenever the legislator is using one tax base in order to approximate another (Slemrod and Yitzhaki,1994; Yitzhaki,2007). The double minimum wage
8We discuss some reported audit statistics of the Tax Authority in AppendixB.
rule does not rely on additional observable items, but it “presumes” that the taxpayer’s earning is no less than twice the minimum wage, unless the taxpayer proves otherwise.9
3 Bunching at Enforcement Thresholds
This section introduces a model of labor demand that generates bunching both at enforcement thresholds (from inframarginal evasion) and the minimum wage (from supramarginal efficiency wages).
Employer Optimization In partial equilibrium, firms post, create, fill each job to maximize their profit.10 Abstracting away from the demand curve and input supply curves the firms face, employers (or the self-employed) will set a worker’s efficiency wage w,11 and evasion level e to maximize profit V(w, e|θ).
maxw,e V(w, e|θ) =f(w|θ)−w−τ · (w−e)
| {z }
Declared Earnings
− ρ·p·τ ·e
| {z }
Expected Audit Cost
− g(e)
Manipulation Cost|{z}
(1)
where f()is the production fuction for a firm (job), eis the amount of manipulation in earnings,θ is a productivity parameter,p is the audit probability the firm faces,τ is the tax wedge on declared earnings, andρ is the recovery rate on misreported earnings if caught.
The production function defines input demand by the first-order conditions
fw(w|θ) = (1 +τ), (2)
τ(1−ρp) =g0(e). (3)
For a well-behaved f, these also define the implicit function for∂w/∂θ.
Assumption 1. For the production and evasion cost functions, assume continuous twice differ- entiability with f00 < 0 and g00 > 0, for decreasing marginal product and increasing marginal
9Bulgaria introduced a similar rule in 2003, called the minimum insurance income thresholds, to curb the widespread practices of insuring employees at the level of the statutory minimum monthly wage instead of the actual wage (Pashev, 2006).
10This framework neglects labor-labor substitution in larger firms.
11We do not distinguish between prices and quantities of output and labor (effective hours), everything could be isomorphic between different compositions ofp(y)·yandw(l)·l.
costs.
Without loss of generality, order the productivity types such that the (unconstrained) marginal value product of labor is strictly increasing in productivityθ: ∂2f/∂w∂θ >0.
Furthermore, assume that g(0) = 0 andg0(0) = 0, thus a little evasion is always worth it unless other constraints forbid it.
3.1 Static Bunching at Enforcement Thresholds
This environment generates an excess mass of employment at reported income levels where enforce- ment changes discontinuously, as inframarginal evaders end up reporting the threshold amount for a range of jobs.
Assume pdropping from p0 to p1< p0 at some declared earnings thresholdw−e=D. So audit probability pis decreasing, i.e.
p=
p0 ifw−e < D p1 ifw−e≥D
(4)
For unconstrained cases, equation (3) defines optimal evasion by inverting a well-behaved (and strictly increasing) g0 function, which we can label asE(), which is also strictly increasing.
Then for low productivity firms far from D,eis constant atE(τ −ρp0τ), and production is at its unconstrained optimum as long as
w−E(τ −ρp0τ)≤D. (5)
As the (unconstrained) marginal value product of labor is strictly increasing in productivity θ, this is satisfied for allθ < θ0 if there exists a level θ0 for which
w(θ0)−E(τ−ρp0τ) =D. (6)
Here we let a univariate w()denote the dependence of the unconstrained solution of equation (2) on productivity only.
For firms with high enough productivity,e=E(τ −ρp1τ)as long as (by the same monotonicity)
θ1< θ where
w(θ1)−E(τ−ρp1τ) =D. (7)
In between, for θ∈[θ0, θ1]the firm will produce and evade just enough thatw−e=D. The exact mix of suboptimal production and intermediate evasion depends on the marginal cost of each.12
For a continuous distribution of θ with c.d.f. H(θ), this implies the mass of H(θ1)−H(θ0) bunching at the enforcement thresholdD. This is the mass missing from the left of the threshold D in a world without frictions and noise.
We can check for consistency in θ0 < θ1, which again follows from the (arbitrary) ordering of the marginal value product of labor to increase in θ, as w(θ0)−E(τ −ρp0τ) =w(θ1)−E(τ−ρp1τ) and E(τ −ρp0τ)< E(τ −ρp1τ) andw(θ0)< w(θ1).
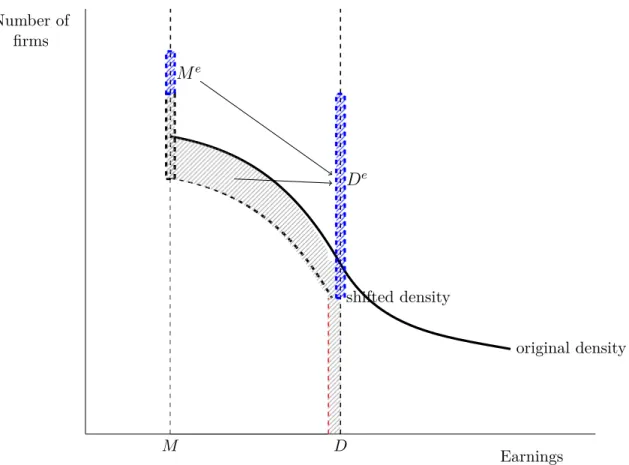
3.2 Shifts in Bunching
We can easily extend the situation to two thresholds, an extremely well enforced lower thresholdM and an initially ineffective new thresholdD.
Initially, p0 =p1 but for reported earnings below someM < D, pM p0 (and ifpM ≤1would bind, allow forρM ρ as additional punitive fines). Analogously to the previous argument, only firms withθ > θM will report earnings aboveM, where
w(θM)−E(τ−ρp1τ) =M. (11)
If p0 rises for reported earnings in[M, D], the bunch appears as under the previous point and
12If the shadow price of relaxing thew−e=D constraint is the Lagrange multiplierλ, the following first-order conditions characterize the constrained optimum when this condition binds:
fw(w|θ)−(1 +τ) +λ= 0, (8)
−τ(1−ρp)−g0(e)−λ= 0. (9) This links the marginal value product of labor (MVPL) to the tax rate and the costs of evasion:
fw(w|θ) = 1 + 2τ−ρpτ+g0(e). (10)
the bunching at M becomes smaller. Some evaders are pushed off M with a new productivity cutoff
w(θM0 )−E(τ−ρp0τ) =M. (12) Again, for a higherp, the lower impliedenecessitates a lower θM0 with the lower marginal value.
Assumption 2. M is high enough to leave θM to the right of the mode of its (assumed) unimodal distributionH.
Proposition 1. Equilibrium evasion (shading) is lower with a higher probability of getting caught, E(τ −ρp0τ) =e0< E(τ−ρp1τ) =e1. Thus the real earnings behind any specific reported earnings
˜
w=w−e0 ∈[M, D] is higher than before with stricter enforcement (with w(θ) = ˜w+e1 for the same w˜). Thus the density of those observed earnings changes to the density of higher productivity.
The density h(θ) is strictly decreasing over θ ∈ [M, D] already, and densities fall after stricter enforcement (p0 > p1) comes into effect. Also, the observed density of reported earnings will drop to 0 below D, for productivities higher than the new marginal buncher θ0.
Would the extra mass at Dbe a lower bound on the prior extra mass atM? Not surprisingly, this is somewhat ambiguous — with very harsh enforcement (ρ0p0 ρ1p1,e0 e1) and a large DM, much of the bunching atD would come from the mass previously spread out betweenM andDand not necessarily bunching at M. Figure 1 illustrates the impact of stricter enforcement over[M, D].
3.3 Bunching at a Threshold that is also the Minimum Wage
In practice, M is a well-enforced threshold on enforcement as it is also a legal minimum on remuneration. We can make both constraint (M ≤w)13 and the participation constraint (V ≤0) explicit (with respective shadow prices µand ν).
In Appendix Section A.1, we derive how these constraints partition the parameter space into unconstrained evaders (Θ1), bunching evaders (Θ2) and bunching true minimum wage employers (Θ3), as illustrated in Figure2. The cutoff levels of productivity, whose shifts are key to the welfare
13Thew−e≥M enforcement constraint is equivalent to non-negative evasion (e≥0) with an effective minimum wage. With neither constraint, you get bunching atM without enforcement reasons, but not purely from the distorted efficiency wage decision but also people overreporting pay. Instead of this unrealistic scenario, we only discuss the minimum wage as two constraints in one.
analyses in Section 7, are denoted by the corresponding lower-case letters: θ4, θ32, and θ21. For the intuitive and empirically relevant ordering of these cases, the derivation makes use of the following additional assumption.
Assumption 3. For the sake of empirical relevance, assume that the marginal firm with zero profit is one that barely pays the minimum wage without shading (or would pay even worse than the minimum and misreport better pay if this were allowed). This assures that evaders and truthful reporters both bunch at the reported minimum wage, which we consider both empirically relevant and more interesting for enforcement (otherwise all bunchers would reveal themselves to evade with no need for elaborate research designs).
4 Data and Sample
We use an administrative panel dataset that brings together information on earnings, occupations, benefit receipt, healthcare spending, and other domains for a random 50% sample of the Hungarian population for years 2003–2011.14 Since our focus is on the working age population, we restrict the sample to individuals aged 18–65.
4.1 Employment and Worker Characteristics
We observe monthly employment and earnings at the individual-firm level, as well as monthly data on benefit take-up. The earnings and labor market status indicators originate from the pension authority. These records are in effect used in the calculation of pension benefits after retirement.
An individual is defined to be formally employed if the pension authority records any type of employment or self-employment on the 15th of the given month. Although labor market status and earnings are observed at the monthly level, due to data limitations (some of the earnings are smoothed within a job spell), we keep data from only a representative month (March) for each year.
We drop person-year observations for which an individual holds multiple jobs. We observe gross earnings, which include all earnings that enter pension benefit calculations. We do not observe
14The dataset was constructed by selecting a random 50% sample (for privacy reasons) of the Hungarian population aged 5–74 in 2003 and following this initial sample until 2011. Inclusion in the dataset is effectively random as individuals with certain days of birth are included. Sample attrition might arise from emigration or death, the latter of which we record directly, but neither is particularly relevant for our study sample.
actual taxes paid by firms or workers, nor capital income.
We use several individual-specific variables, including age, gender, initial residence, social security benefits received (if any) and soccupation. Age, gender and residence come from a 2003 snapshot of the health insurance fund data; all labor market data come from the pension administration.
From occupations, we impute skill levels by imputing the median education level of employees of the same occupation code as observed in the Labor Force Survey of the Central Statistical Office of Hungary. Area of residence is observed only in 2003, and not updated.15 The data originating from the pension administration allow us to separate employment by sector; we divide workers into three groups: private sector employees, public sector employees, and the self-employed.16 We restrict the group of the self-employed to individuals whom we observe to work in firms with observed size of one (70% of all self-employed). Thus, our analysis excludes freelancers and contractors who are not employees at a firm but who work in a firm which has two or more observed workers. Table3shows summary statistics for our sample of workers by sector.
An important limitation of our data is that earnings are smoothed within employment spells and calendar years. Specifically, employment spells are cut into calendar years and average within-spell, within-year earnings are reported. For example, if an individual remained in the same job throughout the year, then we observe her total annual earnings in that job divided by 12. If she remained in the job for several years, then we observe this measure specifically for each year. If she changed jobs within the year, then we observe separate spells for her jobs.17 Because of this smoothing and the double minimum wage rule coming into effect in September 2006, people shifting from the minimum wage to its double are observed to earn between the two (the weighted average) throughout 2006 (including in March, the representative month we use). This data limitation guides our decision to exclude 2006 from most of our analyses, and instead focus on wage distributions in 2005 and 2007 and transitions between the minimum wage and the double minimum wage between 2005 and 2007.
15Cross-county migration can be approximated from 10-year census data. Over the 10-year period between 2001 and 2011, approximately 15% of the population moved between counties (Lakatos, L. Rédei and Kapitány,2015).
16These sector definitions are consistent over years 2003-2009, less so for years 2010-2011, due to changes of definitions in the baseline data. We exclude from the group of private sector employees those who work at firms in which the ownership rate of the government is above 50% or where we observe in any year more than 10 public sector employees. Public sector employees are public servants whose earnings are regulated by the government, including teachers, physicians and civil servants, among others.
17We also observe separate records for contemporaneous employment spells with multiple employers, but exclude workers who have more than one employer at the same time.
4.2 Firm Characteristics
Tax authority data on firm-specific indicators are available only for larger firms (with double-entry bookkeeping).18 Based on this, we see ownership (foreign versus domestic), sector and industry, firm size, net revenues, the total wage bill, gross value added, tangible assets and material costs.
The revenue and cost indicators are annual measures, corresponding to a calendar year. Using these indicators, we calculate total factor productivity (TFP) as the sum of fixed effects and residuals from a firm level regression of the log of net revenue regressed on log costs of labor, capital and materials.
Since the calculated TFP is based on the tax authority’s firm-level records, it is not affected by sampling noise in our 50% sample. For our analyses, we use the observed number of workers in a firm because this can be calculated for all firms, regardless of the availability of firm-specific indicators from the tax authority. By our definition, self-employed individuals work in firms with observed size of one. Table4 shows summary statistics for private-sector firm characteristics.19
5 Empirical Framework
In our analyses, we use the introduction of the double minimum wage rule in 2006 to provide evidence on the underreporting of earnings at the minimum wage, and to estimate the impact of the rule on reported earnings and formal employment. In this section, we discuss our empirical strategy.
5.1 Wage Bin Definitions
Throughout our analyses, we use two bin definitions to partition the earnings distribution. Where possible, we define absolute bins of size 5,000 HUF (≈$17). The advantage of these bins is that they are transparent and have the same absolute magnitude in each year. We also view them as relatively narrow: 5,000 HUF corresponds to 6-10% of the minimum wage in this period.20 In order to facilitate cross-year comparison though, we also define relative wage bins. The lower end of
18Double-entry bookkeeping is compulsory for firms with annual income above 50 million HUF (approximately $160 thousand).
19In our matched employer-employee data, to each worker a firm identifier is attached. When analysing firm-level characteristics in the private sector, we first restrict the sample to the private sector employees (thus exclude the self-employed, freelancers and contractors) and then do the analysis on the so remaining subsample of firms. Therefore, those firms are excluded which do not employ any private sector employees.
20In Section 6.3, we also examine the robustness of our main results about wage reporting around the double minimum wage using a relative band of 95-105% around the annual level of the double minimum wage.
the first bin is the monthly minimum wage, the upper end of the first bin is 110% of the monthly minimum wage in years 2003-2005 (before the introduction of the guaranteed wage minimum), and the guaranteed wage minimum in years 2006-2011. Bins 2-6 are of equal width, the top of bin 6 equals the double minimum wage. Thus, the width of a bin equals around 18% of the monthly minimum wage. Bins 7-11 have the same width, the lower end of bin 7 equals the double minimum wage. Intervals 1-11 are left-closed and right-open. Finally, bin 12 is open ended, including all earnings at or above around three times the monthly minimum wage. The advantage of using relative wage bins is that they allow for cross-year comparison in a way that makes the wage bins follow the minimum wage. Fixed-width bins would lead to substantial narrowing over time in relative terms, since the gross minimum wage was 56% percent higher in 2011 than in 2003.
We do not observe hours worked, therefore part-time workers appear to have monthly earnings below the monthly minimum wage. We do not exclude them because we are unable to exclude part-time workers earning above the minimum wage.
5.2 Underreporting of Earnings at the Minimum Wage
Descriptive Evidence. The first set of analyses we present relies on the cross-sectional distribu- tion of earnings before and after the introduction of the double minimum wage. We divide monthly earnings into 5,000 HUF (≈$17) bins and show histograms of the earnings distribution before (2005) and after (2007) the introduction of the double minimum wage rule, separately for private sector employees, the self-employed, and public sector employees. We start the bins at zero and censor the distribution at 300,000 HUF (≈$1,000) which is almost five times the minimum wage. In addition to this cross-sectional evidence, we exploit the panel nature of the data to directly analyze transitions of workers between different wage levels. We estimate two-year transition probabilities between each pair of wage bins.21
In our heterogeneity analyses, we focus on transitions from reporting earnings at the minimum wage in 2005 to reporting double the minimum wage in 2007. We calculate the percent of workers who transition by worker characteristics (gender, age, and skill level), firm characteristics (ownership, size, and industry), and total factor productivity as a measure of firm quality. We also break down
21We analyze two-year transition probabilities to account for the problem of smoothed earnings in 2006 discussed in Section4.1.
these transition rates by 174 districts of Hungary, weighted by population, and analyse the relation between the district-specific transitions among private sector employees and the self-employed.
Regression Framework. Building on our descriptive results, we estimate event study regressions which describe the evolution over time of the probability of earning at the double minimum wage (DMW) among private sector employees and the self-employed, relative to public sector employees.
Our estimating equation is
DM Wit=β0+ X
t6=2006
β1tP Eit+ X
t6=2006
β2tSEit+αE+τt+εit (13)
where i indexes workers, P Eit is an indicator for private sector employees, SEit is an indicator for the self-employed,αE are sector fixed effects (public-sector employee, private-sector employee, or self-employed), and τt are year fixed effects. The coefficients of interest are β1t and β2t, the differential change between private sector employees or the self-employed and public sector employees in the likelihood of reporting earning the double minimum by year. In all our regressions, we cluster standard errors at the firm level.
In addition, we also estimate a constant treatment effect difference-in-differences version of this regression, essentially pooling all years before and after treatment:
DM Wit=β0+β1P Eit×P ostt+β2SEit×P ostt+αE+τt+εit (14) where we use the same notation as in equation (13) andP ostt is an indicator for the post-period (years 2007-2010). We exclude year 2011 from this regression because the double minimum wage rule was no longer in effect by then. The coefficients of interest areβ1 andβ2, the differential change between private sector employees or the self-employed and public sector employees in the likelihood of reporting earning double the minimum between the pre and post period.
Identification. Our estimation relies on standard difference-in-differences assumptions. For the β1t(β2t) to represent a valid estimator of the impact of the double minimum wage rule on the share of private sector employees (the self-employed) who report earning the double minimum wage, we require that the evolution of the share of public sector employees who report earning the double
minimum wage be a valid counterfactual for the share of private sector employees and self-employed who report earning the double minimum wage, absent the introduction of the double minimum wage rule.
The only other contemporaneous policy change that we are aware of that would affect the overall distribution of wages in the sectors differently is the introduction of the guaranteed minimum wage for skilled jobs assumed to require a high school diploma. But we are not aware of any changes that would affect the distribution of wages specifically at the double minimum wage, including policies that would affect the three sectors diferentially. There are also unlikely to be any spurious wage dynamics that would affect the distribution of wages specifically at this point differentially in the three sectors.
We provide several pieces of evidence that suggest that share of public sector employees who report earning the double minimum wage would be a good counterfactual for the same shares in the private sector and among the self-employed, absent the introduction of the double minimum wage rule. First, in Figure3, we observe no bunching at the double minimum wage or at any other point in the wage distribution among public sector employees either before or after the introduction of the double minimum wage rule. Second, when we move from the cross-section to tracking people as they move between different wage bins in Figure 4, we find that the two-year earnings dynamics of public sector employees appears fairly symmetric (moving from binito bin j has about the same probability as moving from binj to bini) both before and after the reform. Indeed, both before and after the reform, most public sector workers’ earnings are stable on a two-year time horizon.
Third, looking at trends in the share of public sector workers reporting to earn the double minimum wage in Figure 5, there are no changes in the share of public sector employees who report earning the double minimum wage either before or after the introduction of the double minimum wage rule. Fourth, looking at the observable characteristics of workers who report earning the double minimum wage in Figure 7, there are no anomalies in public sector workers’ wage distribution at the double minimum wage, either before or after the introduction of the double minimum wage rule. Fifth, addressing the concern that the double minimum wage rule could have affected wage dynamics among public sector employees through exits from formal employment (another outcome we examine below), Figure 10shows that the introduction of the double minimum wage rule was not associated with any changes in exit from formal employment among public sector workers.
5.3 Impact on Formal Employment
Descriptive Evidence. The first approach we take to analyzing the impact of the reform on formal employment shows the evolution over time of the probability of leaving formal employment for workers earning the minimum wage and for workers in the three relative wage bins (Bins 2-4) immediately above the minimum wage, separately for private sector employees and public sector employees. For this analysis, comparisons across relative wage bins are necessary because macroeconomic trends have a considerable impact on employment as it is apparent during the Great Recession in our figures and this impact is differential across sectors. There are very few self-employed in wage bins 2-4, therefore we cannot include the self-employed in this analysis.
Since in this analysis, we compare workers reporting their earnings, we need to account for a specific problem caused by the smoothing of wages within job spells and calendar years discussed in Section 4.1. Recall that due to this smoothing and the double minimum wage rule coming into effect in September 2006, people shifting from the minimum wage to its double are observed to earn between the two (the weighted average) throughout 2006. This means that people who change their reported earnings from the minimum wage to the double minimum wage in September (or any other months during 2006) are not included among the observed minimum wage earners in March 2006. The problem for our analysis is that long-employed people shifting from the early-2006 minimum wage to its late-2006 double are likely to have a lower counterfactual probability of leaving their steady job by March 2007 than those who report the minimum wage throughout the year.
This means that indepently from the double minimum wage rule, those observed to report the minimum wage for their entire spell in 2006 (whenever it ended) are much more likely to leave formal employment by next spring than those observed to report earning above the minimum wage.
Hence, our naive estimates of the impact of the double minimum wage rule on exit from formal employment among observed minimum wage earners would likely overstate the effect.
To get around this issue, we estimate the impact of the double minimum wage rule on formal employment using earnings in December of yeart, and looking at the rate of formal employment in January of yeart+ 2(i.e. 13 months later). Thus our estimates are not biased by our differential mismeasurement of earnings in 2006 as we analyze the probability of leaving formal employment between December 2005 and January 2007 by reported wage bin in December 2005. This approach
likely underestimates the true annual effect because we miss spells starting in 2006.22
Regression Framework. Building on our descriptive results, we estimate event study regressions which describe the evolution over time of the probability of leaving formal employment among those earning the minimum wage 13 months before relative to those earning in one of the relative wage bins just above, separately for private-sector employees, and public-sector employees. We cannot conduct this analysis for the self-employed because of the very low number of self-employed reporting earnings above the minimum wage bin. Our estimating equation is
Exitit =β0+ X
t6=2006
βtM Wi,t−1+αB+τt+εit, (15)
where i indexes workers, M Wi,t−1 is an indicator for being in the minimum wage bin (vs. the control wage bin) 13 months before, αB are wage bin fixed effects (minimum wage vs. control), and τt are year fixed effects. The coefficients of interest are βt, the differential change between workers reporting to earn the minimum wage and workers reporting to earn just above the minimum wage in the likelihood of exiting formal employment by year.23
We also examine heterogeneous responses, re-estimating Equation (15) and splitting the sample by worker characteristics (gender, age, and skill level), firm characteristics (ownership, size, and industry), and a measure of firm quality (total factor productivity).
Identification. Our estimation again relies on standard difference-in-differences assumptions. For theβtto represent a valid estimator of the impact of the double minimum wage rule on the share of private sector employees who leave formal employment, we require that the evolution of the share of employees in higher wage bins be a valid counterfactual for workers who report earning at the minimum wage. Pre-trends in this case are more challenging to examine with only two years of data on exits prior to the double minimum wage rule. Nevertheless, the lack of pre-trends in this
22An alternative would be to analyze formal employment responses over a two-year time horizon, as we do in much of our analysis of reporting responses. The downside of this approach would be that we additionally miss spells starting between March and December 2005.
23Unlike in our estimation strategy for reporting responses discussed in Section5.2, we do not estimate a constant treatment effect version (the analogue of Equation (14)), because over time the composition of workers reporting to earn the minimum wage and reporting to earn in the wage bins just above changes due to our measured employment response. The Great Recession also appears to have had disparate impacts on workers in different parts of the wage distribution and in different sectors.
time period provides suggestive evidence on the validity of our assumptions. Further, we show that there is no effect among public sector employees who can act as a placebo group for this analysis.
Another concern is the potential effect of the double minimum wage rule on the wage bins that we use as controls in this analysis. We do not observe any change in the pre-period or immediately following the introduction of the double minimum wage rule among the control wage bins, but again, our pre-period is short for this analysis. In a robustness analysis, we examine wage bins that are above the double minimum wage (rather than between the minimum wage and the double minimum wage). The advantage of using these higher wage bins is that they are not affected by the double minimum wage rule. The disadvantage is that workers in these wage bins are likely different from workers who honestly report earning the minimum wage.
6 Results
In this section, we use the introduction of the double minimum wage rule at the end of 2006 to provide evidence on the underreporting of earnings at the minimum wage. We start by providing cross-sectional evidence on the distribution of earnings prior to the introduction of the double minimum wage rule (in 2005) and after the introduction of the double minimum wage rule (2007).
A spike appears in the distribution at double the minimum wage in 2007 among private-sector employees and the self-employed. We then exploit the panel structure of our data to provide evidence on transitions between different wage levels over time and show that a substantial fraction of workers report to have doubled their earnings after earning just the minimum in 2005. In addition, our findings on transitions by industry, firm size, ownership, and measures of firm quality suggest these responses are larger where prior evasion was more likely. Observable characteristics of workers concentrated at the new threshold show an anomaly at the reporting thresholds; using the distribution of observables characteristics can provide a useful methodology when only cross-sectional data is available. When we analyze the concentration of the reporting effect across firms, we find that workers who reported earning the minimum wage and responded to the double minimum wage rule were likely to be pooled in the same firms with other such workers. The geographic concentration of the reporting response suggests that either local economic factors were important in determining evasion behavior or the double minimum wage rule had different salience in different
areas.
6.1 Main Results
Figure3shows the distribution of monthly earnings in 2005 (in blue) and 2007 (in red) separately for private sector employees in Panel (a), the self-employed in Panel (b), and public sector employees in Panel (c). In 2005, all three groups show some excess mass at the amount of the monthly minimum wage, though it is much larger for the private sector than for the public sector and it is especially large for the self-employed. 19.9% of private sector employees, 68.5% of the self-employed, and 1.1% of public sector employees report earnings at the monthly minimum wage in 2005. After the introduction of the double minimum wage rule, in 2007, the amount of excess mass at the minimum wage decreases for private sector employees and the self-employed, though it is still substantial in these sectors. The amount of excess mass remains the same for public sector employees. 5.8%
of private sector employees, 30.9% of the self-employed, and 1.1% of public sector employees are reported to earn the minimum wage in March 2007. A new excess mass point appears in the distribution of earnings for private sector employees and the self-employed, but not for public sector employees. In 2007, 5.4% (up from 1.9% in 2005, a 2.8-fold increase) of private sector employees and 16.3% (up from 0.3%, a 54-fold increase) of the self-employed report earning double the minimum wage. The share of public sector employees earning double the minimum wage remains virtually unchanged at 2.51% in 2007 (2.57% in 2005), as we could expect from a group that is least likely to evade taxes by underreporting their earnings.
Making use of the panel structure of our data, Figure 4 shows transitions over time between different wage levels separately for private sector employees in Panels (a) and (b), the self-employed in Panels (c) and (d), and public sector employees in Panels (e) and (f). For each sector, the first panel displays the percentage of employees who transition between 2003 (on the x-axis) and 2005 (on the y-axis) between each of the wage bins, and the second panel displays the percentage of employees who transition between 2005 (on the x-axis) and 2007 (on the y-axis) between each of the wage bins. Consistent with the cross-sectional figures (Figure3) the first panel for each sector shows some concentration of earnings at the minimum wage and also shows that wages are quite stable across years (39%, 82% and 38% of earnings remain in the same earnings bin relative to the minimum wage among the private sector employees, self-employed and public sector workers,
respectively). The second panel shows that while wage dynamics do not change in the public sector between the 2003–2005 and 2005–2007 periods, the introduction of the double minimum wage rule is associated with a substantial share of workers reporting the minimum wage transitioning to reporting double the minimum wage among private employees. We find that 10.5% of private sector employees reporting the minimum wage in 2005 report at the double minimum wage in 2007. This means that around 2% of all workers in the private sector report at the minimum wage in 2005 and at the double minimum wage in 2007. An even stronger transition response is observed among the self-employed, for whom it might have been the easiest to evade taxes before the new rule but also to report the minimum which they think lowers their chance to be audited. We find that 19.2% of the self-employed reporting at the minimum wage in 2005 report at the double minimum wage in 2007. This means that 10% of all the self-employed report at the minimum wage in 2005 and at the double minimum wage in 2007, suggesting a large fraction of prior minimum wage earners falsely reporting the lowest possible earnings and paying the corresponding taxes.
To estimate changes in reported earnings in a formal regression, Panels (b) and (c) of Figure 5 collect coefficients from event study estimates of the share of workers reporting to earn double the minimum wage, comparing private-sector employees (in Panel (b)) and the self-employed (in Panel (c)) to public-sector employees, based on Equation (13). We show results with no additional controls (in blue) and controlling for gender, age group, and 2003 residence (in red). Panel (b) shows that prior to the introduction of the double minimum wage rule, the difference between the share of workers reporting earning at the double minimum wage in the public and private sectors was stable.
(Panel (a) shows that not only was the difference stable, but the level was stable in both sectors.) Among private sector employees, the share of workers reporting earning at the double minimum wage increased by 3.7 percentage points relative to public sector employees in 2007. Panel (c) shows that prior to the introduction of the double minimum wage rule, the difference between the share of workers reporting at the double minimum wage in the public sector and among the self-employed was stable. (Panel (a) shows that not only was the difference stable, but the level was stable in both sectors.) Among the self-employed, the share of workers reporting this amount increased by 16 percentage points relative to public sector employees in 2007.
Table 5 shows our estimates after pooling the years prior to the reform (2003-2006) and after (2007-2010), based on Equation (14). We estimate that relative to public sector employees, the share
of private sector employees reporting double the minimum wage was 2.3% higher and and the share of the self-employed reporting double the minimum wage was 11.4% higher after the introduction of the double minimum wage rule. These pooled estimates are lower than the event study estimates comparing 2006 and 2007 because after 2007, the share of workers reporting earning double the minimum wage falls. We discuss these dynamics in more detail below in Section 6.3.
6.2 Heterogeneous Effects
We examine heterogeneous responses along various characteristics of private-sector employees who remain formally employed in 2007. Panel (a) of Figure6 shows the share of minimum wage earners in 2005 who transition to the double minimum wage in 2007 by gender, age, and skill level. Men who earned at the minimum in 2005 are 3.5 percentage points (43%) more likely to report earning double the minimum wage than women. The likelihood of transitioning between the minimum wage in 2005 and its double in 2007 is approximately the same by age group. Differences are starkest by skill. 4.6% of workers in an occupation with mostly primary education who reported earning the minimum wage in 2005 report earning its double in 2007, similar to workers in occupations with mostly lower secondary education or less, whose transition probability is 7%. By contrast, the transition probability is much higher among workers in more high-skilled jobs: 15.1% among those with mostly upper secondary education and 24.9% among those with mostly tertiary education prevalent in their occupation. These patterns are consistent with the interpretation that among more highly skilled workers those that reported the minimum wage prior were more likely to be earning at (much) higher levels in effect than their less skilled counterparts. (Appendix Figure A1shows the evolution of the share of private sector employees who report earning at the double minimum wage by worker characteristics, including gender, age, and skill level, over our entire time period.)
Tax evasion might be less feasible in more prominent businesses. Panel (b) of Figure 6 shows the share of minimum wage earners in 2005 who transition to the double minimum wage in 2007 by ownership, firm size, and industry. It is apparent that the overall 10.5% transition rate of 2005 minimum wage earners to double the minimum wage in 2007 (among those who remain formally employed) masks substantial heterogeneity along all three dimensions. Domestic firms have a 5.0 percentage point (75%) higher transition rate than foreign-owned firms, who are likely to have
different internal systems and culture around truthful reporting. Workers in smaller firms also have much higher transition rates than workers in larger firms: firms of observed size 1–5 have a transition rate of 13.8%, while firms of observed size 6–50 have 8.2%, and those of 51–125 have 3.5%.
Among the largest firms, with observed size above 125, only around 3.3% transitioned between the minimum wage and its double during the 2005–2007 period, no higher than in other years, as we show in Appendix Figure A2. Again, larger firms might have been much more conducive to honest reporting all along, if some collusion to evade is harder to coordinate in larger groups (Kleven, Kreiner and Saez, 2016). Construction, Trade, and Transportation have much higher transition rates (13.1%, 11.5%, and 11.8%, respectively) than Agriculture, Mining and Manufacturing, and Accommodation and Food (7.3%, 7.3%, and 6.2%, respectively). All three of these findings on heterogeneity by ownership, firm size, and industry are qualitatively consistent with studies that use other data sources, including surveys, and other methodologies to directly estimate tax evasion in Hungary (Elek, Scharle, Szabó and Szabó, 2009a; Elek and Köllő, 2019). (Appendix Figure A2shows the evolution of the share of private sector employees who report earning at the double minimum wage by firm characteristics, including ownership, firm size, and industry, over our entire time period.)
Lower-quality firms might not be able to afford the full tax bill on their labor, though evaders might look more productive on paper (employing more labor off the books). In addition to standard firm characteristics, we also examine heterogeneity in total factor productivity as a proxy for “firm quality”. Panel (c) of Figure6 shows transitions by TFP quartiles. There is a negative association between TFP and transitions from the minimum wage to the double minimum wage. We interpret this finding to suggest that firms that are more productive are less likely to underreport worker earnings. (Appendix Figure A3shows the evolution of the share of private sector employees who report earning at the double minimum wage by total factor productivity over our entire time period.) 6.3 Additional Evidence
Observables at the Double Minimum Wage. So far, we have used the panel structure of our data to observe individual workers moving from the minimum wage to the new double minimum wage audit threshold to argue that these patterns are consistent with previous underreporting at the minimum wage. This method can deliver relatively precise individual-level and firm-level estimates
of underreporting. An alternative approach makes use of the richness of the administrative data available and the distribution of various worker characteristics throughout the earnings distribution.
The advantage of this approach is that it only requires a single year of data, with the obvious disadvantage that it can only help us document the extent of likely underreporting but not its individual (or corporate) source. This approach is in some sense similar in flavor to the “unused observables” approach ofFinkelstein and Poterba(2014). There the authors show that residential location is correlated in the U.K. with both the demand for annuities and mortality, but remains unused for the purpose of pricing annuities, demonstrating the presence of asymmetric information.
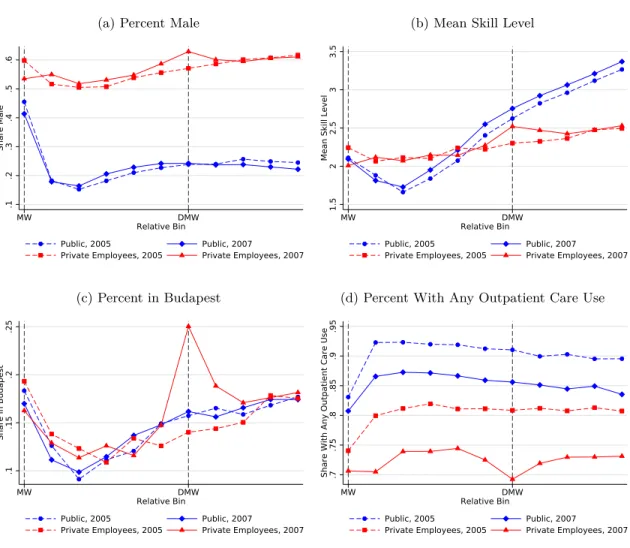
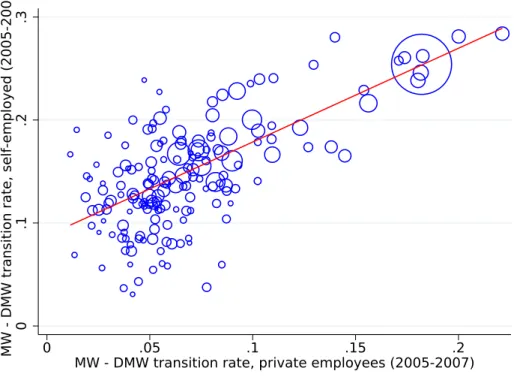
In our context, we show that a variety of variables that are not used by tax authorities for audits and even variables that would not appear to be related to taxation at all have excess mass in their distributions at the double minimum wage threshold after the reform. Figure7 demonstrates this phenomenon for four covariates: gender, skill level, residing in the capital (in 2003), and utilizing any outpatient care in a year. All four variables have smooth distributions around the double minimum wage threshold among public sector employees both before and after the introduction of the double minimum wage rule and among private sector employees before the introduction of the double minimum wage rule. However, after the introduction of the double minimum wage rule, all four variables shows spikes among private sector employees at the double minimum wage threshold.24 Geographic Concentration. We also find the transition rates from the minimum wage to the double minimum wage between 2005 and 2007 by districts of Hungary closely move together for private sector employees and the self-employed. Figure 8shows this rate to vary between 1% and 22% among private sector employees, with a wider dispersion (3-28%) for the self-employed. We see a strong positive association in the district-specific transition rates between the two sectors (the slope of the regression line 0.92). This suggests strong spatial clustering of tax evasion or in the perception of the double minimum wage rule. The self-employed face different institutions for wage bargaining and somewhat different incentives to avoid or evade labor taxes, but their behavior is a good measure of local salience of the rules and prevalance of prior evasion (Chetty, Friedman and Saez,2013). It is reassuring to see that in areas where only a small share of the self-employed reacted to the double minimum wage rule, transition rates were similarly low among private sector
24Choudhary and Gupta(2019) analyze other outcomes in the context of a more conventional bunching response.
employees; this suggests that there are no confounding reasons for reporting at the double minimum wage in 2007.
Cross-Firm Concentration. An important conceptual question for understanding tax evasion around the minimum wage is whether this is primarily a firm-side or worker-side phenomenon. With third-party reporting, the worker cannot underreport on their own (Kleven et al.,2011), but they could have a deciding say in an agreement with their employer about their reported earnings. While the reform is too short-lived to track workers moving between employers with different response rates, it is still instructive to look into correlated behavior without breaking the reflection problem (Manski,1993). We relate responses to the double minimum wage rule measured at the level of individual workers to responses measured for other employees of the same private-sector employer.
Figure 9shows response rates of workers by the average response rate of their peers in the company.
Panel (a) suggests that at lower levels of firm response, when less than half of coworkers moves from the minimum wage in 2005 to double the minimum wage in 2007 (among those who remain employed there), there is an overall positive association between individual and peer behavior. At higher levels of firm response, when more than half of others respond, individual responses are less closely associated to peers’, 70-80% of workers respond on average. Panel (b) shows something similar for exits (foreshadowing Section 6.4), where we bin firms by differential relative exit rates of 2005 minimum wage workers compared to those earnings slightly more. Workers reporting to earn the minimum in 2005 are often less likely to leave than coworkers who are paid more, and for this group we see a tightly estimated 18% propensity to leave irrespective of peers’ relative propensity (the slope being zero has a p-value of .19). At firms where others on the minimum wage are more likely to leave than higher earners, we do see the individual exit rates moving with peers’ (with a slope of .69), which suggests the exits are concentrated only when firms let go disproportionately many minimum wage workers, consistent with this phenomenon being less of an organic feature of the labor market and more about collusion, the salience of the policy, and the extent of prior evasion.
These patterns are consistent with our understanding of market power of employers in wage setting. However, the concentrated responses might also bolster the story that these are responses to the tax rules by employers who previously underreported earnings, similarly to how the geographic