LABOUR MARKET IN 2016
Tamás Bakó & Judit Lakatos
In 2016 the Hungarian GDP increased by 2 percent compared to the previ- ous year,1 which however was the lowest among the Visegrad countries. In addition to the external demand2 domestic demand – mainly consisting of the consumption expenditures of households – was a main factor in this im- provement. The volume of the domestic demand has increased by 4.9 percent mainly due to the improving labour market environment and the real wage growth. In 2016 the gross fixed capital formation was 15 percent lower than in the previous year, primarily as a result of the diminished EU development resources. The decrease was the most significant (63 percent) in the public sector investment demand. Next years’ growth prospects are weakened by an 8.9 percent decrease of the investment performance of enterprises with at least 50 employees and by a 6.6 percent decrease of the investment volume in machinery and equipment – as the most important item within financial and technical investments. While per capita labour productivity has started to increase permanently in other Visegrad countries there has been no sub- stantial increase in Hungary – except in the years 2010–2011. Consequently labour productivity has still not reached the pre-crisis level (Hungarian Cen- tral Bank, 2017).
LABOUR FORCE SUPPLY AND EMPLOYMENT
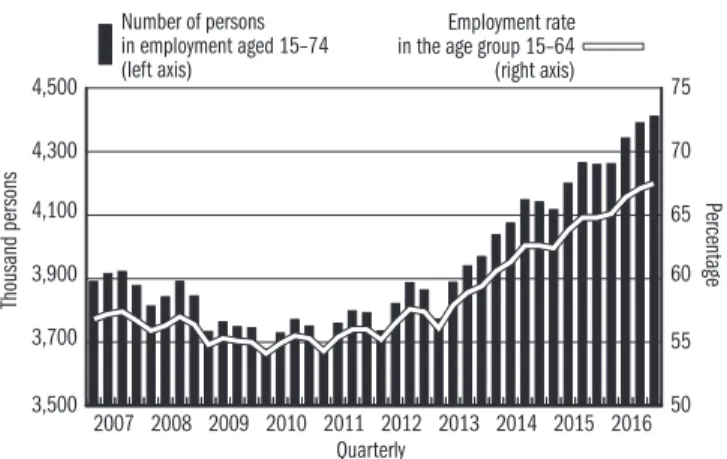
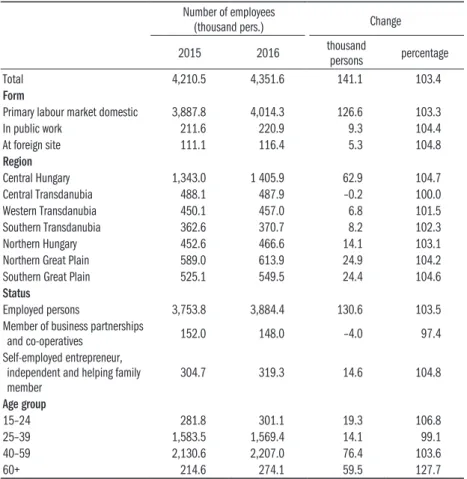
According to the results of the representative data collection of the Hungar- ian Central Statistical Office (the Labour Force Survey) the number of em- ployed increased to 4 million 352 thousand in 2016, which represents the highest value since the survey was introduced in 1992 (Table 1).3 Labour supply though was substantively influenced by several factors during the past two and a half decades.
• The retirement age has been gradually increasing from the former 55 years for women and 60 years for men to a uniform level of 65 years. The actu- al retirement age was 63 years in 2016. At the same time early retirement opportunities were cut back dramatically. (All types of early retirement schemes were abolished with the exception of the ‘Women40’ for women who had spent at least 40 years in employment. Simultaneously the classi- fication conditions of the invalidity pension have been restricted).
• The extended upper working age limit compensates for the decreasing la- bour supply of the younger generations, which was further reduced by the extended time spent in education. Within secondary education the propor- tion of students participating in four-year long training increased signifi- cantly. During the early 1990s half of the primary school graduates who
1 At the same time, as a result of the decline of the popula- tion, gross domestic product per capita was 3.4 percent higher than in 2015.
2 In 2016 the economic per- formance of Germany – as the largest economy within the EU and the most important export market of Hungary –increased by 1.9% (HCSO, 2017a, p. 122).
3 Employed is a person who worked at least one hour dur- ing the reference week, or was temporarily absent from a job.
Maternity leave means tem- porary absence however in the current accounting scheme only those persons are classified as employees in this group who effectively carry out gainful activity in addition to the use of maternity benefit – indepen- dently from the fact of whether or not they have a job.
3,500 3,700 3,900 4,100 4,300 4,500
Number of persons in employment aged 15–74 (left axis)
2016 2015 2014 2013 2012 2011 2010 2009 2008
2007 50
55 60 65 70 75 Employment rate
in the age group 15–64 (right axis)
Thousand persons Percentage
Quarterly
attended further education chose vocational training schools and anoth- er half technical college (which provides a secondary school leaving exam (the‘matura’)). Nowadays, this proportion has changed to 1:3 and the rate of successful applications to higher education institutions following the secondary school leaving exam (‘matura’) has doubled.
• A further factor which – to a small extent – also contributes to the increase of the labour supply is that the average length of absence due to childcare has shortened. The reason for this – in addition to the low number of births – was the introduction of measures encouraging employment during parental leave as well as promoting early return to the labour market.
• Population movement trends (including demography and migration) have a negative influence on labour market supply. The large age cohorts of the fifties are currently replaced by the generation of the 1990s but the size of this latter group is only the half of the generation leaving the labour market. (In 2016 206 thousand persons who were born in 1953 – a year when the number of births was the third largest in the post-war period – entered into retirement. At the same time the number of persons born in 1997 or following is only 100 thousand.) In addition to the demographic turndown since the beginning of the 2010s the increasing negative balance of international migration has further tightened labour supply.
The natural labour force replacement – similarly to international migration – affects labour supply both in quantitative and structural terms. Labour de- mand is the strongest towards those employees – including skilled industrial and construction workers, nurses, commercial, hotel, restaurant and catering workers – who are overrepresented among individuals currently entered into retirement and among those who work abroad.
Figure 1: The number of persons employed and the employment rate of the age group 15–64
Source: Hungarian Central Statistical Office (HCSO) (2017b) p. 1.
The favourable labour market situation – as a theoretical consequence of the high number of employed – is considerably less positive if we take into account the fact that nearly 5 percent of the 4 million 352 thousand employees namely 220 thousand persons were hired in the framework of public works, a special form of tackling unemployment. In addition to this, 117 thousand persons reported that the location of their daily work is outside Hungary.4 Without these groups the employment growth in the primary labour market was 400 thousand and at the same time the number of the age group 15–64 (who represent the base of the employment rate) also decreased by 250 thousand between 2010 and 2016.
In 2016 employment growth was special from the respect that almost the whole of the 141 thousand new jobs have been realized almost exclusively in the primary labour market and within the business sector. The number of public workers increased only slightly in 2016 moreover, the reform policy package on public works of 2017 already envisages decreasing the number of public workers. After the dynamic growth trends in recent years the number of those Hungarians who work abroad and subject to the labour force survey as a special segment was stagnating in 2016. This trend is probably relevant for the total population working abroad including those who are not covered by the LFS. The reason for this – in addition to the improving labour market situation in Hungary – was the declaration of the exit of the United King- dom – the third favourite target country of Hungarians – from the Europe- an Union. According to statistics based on the administrative registers of the Central Statistical Office 29.4 thousand Hungarians moved abroad last year, which is almost 10 percent less than in 2015. At the same time the number of returning emigrants was 17 thousand. Although a quite unfavourable as- pect of this was that three-quarters of the emigrants were below the age of 40 and probably had a more dynamic attitude than average. Significant territo- rial differences in employment within Hungary have hardly been moderated even if employment in the best performing regions of Central- and Western- Transdanubia did not increase due to the lack of the potential labour force.
In 2016 employment growth – both in relative and absolute terms – was the most significant in Central Hungary but the labour market situation in the two Transdanubia regions was quite favourable as well.
Over the last few years the expansion of public works contributed signifi- cantly to the employment growth in disadvantaged regions but in 2016 no further improvement was achieved through this measure. An important rea- son behind the low geographical mobility is that in areas with higher wage levels housing costs are also high therefore after paying housing costs the re- maining part of the wage is significantly lower than the wage one could earn abroad.5 Although the age group above 60 years is still not present in the la- bour market to a large extent, their number increased by almost 60 thousand
4 According to the labour force surveys of other EU Member States the number of Hungar- ians residing and working in the given country for more than one year is 2–2.5 times higher than in the Hungarian register.
Information in the Hungarian labour force survey contains in- formation only regarding those individuals working abroad of whom – as of household mem- bers –the visited households provided data. The number of those Hungarians who work abroad but are not covered by the labour force survey cannot be taken into account addition- ally because the adjusted popu- lation model – as the framework of the weighting of the LFS – could only take into account that element of Hungarians working abroad which is revealed in ad- ministrative databases, i.e. the population that should be used for multiplication could been already counted into the number of Hungarians working abroad.
5 In order to support geographi- cal mobility the amount of em- ployees’ housing compensation was increased in 2017.
compared to the previous year thus the relative employment growth was the highest in this group. The main reason for the increase is the gradual increase of the retirement age however labour shortage could have been a further fac- tor which enabled older age groups to find a job easier than before. Students’
work is an important factor in the economy6 and this is reflected in the growing labour market participation of young people. From a future perspective a less favourable phenomenon is that labour market participation of young adults has decreased partly because this age group is the most affected in terms of international migration.
Table 1: The number of employees Number of employees
(thousand pers.) Change
2015 2016 thousand
persons percentage
Total 4,210.5 4,351.6 141.1 103.4
Form
Primary labour market domestic 3,887.8 4,014.3 126.6 103.3
In public work 211.6 220.9 9.3 104.4
At foreign site 111.1 116.4 5.3 104.8
Region
Central Hungary 1,343.0 1 405.9 62.9 104.7
Central Transdanubia 488.1 487.9 –0.2 100.0
Western Transdanubia 450.1 457.0 6.8 101.5
Southern Transdanubia 362.6 370.7 8.2 102.3
Northern Hungary 452.6 466.6 14.1 103.1
Northern Great Plain 589.0 613.9 24.9 104.2
Southern Great Plain 525.1 549.5 24.4 104.6
Status
Employed persons 3,753.8 3,884.4 130.6 103.5
Member of business partnerships
and co-operatives 152.0 148.0 –4.0 97.4
Self-employed entrepreneur, independent and helping family
member 304.7 319.3 14.6 104.8
Age group
15–24 281.8 301.1 19.3 106.8
25–39 1,583.5 1,569.4 14.1 99.1
40–59 2,130.6 2,207.0 76.4 103.6
60+ 214.6 274.1 59.5 127.7
Source: Labour force survey, HCSO.
According to the institutional labour statistics the number of employed (at en- terprises and non-profit organisations with at least 5 employees and at public institutions) increased by 2.9 percent in 2016. Employment in the business sec- tor hiring in total 1 million 985 thousand employees (including the 11 thou- sand public workers) increased by 3.4 percent which translates to nearly 70
6 Although labour force survey underestimates the number of employed students compared to the estimations of other sources it indicates the dynamics prop- erly.
thousand new jobs.7 In 2016 the number of employees in this sector exceeded already the pre-crisis level while the number of employees in the public sec- tor – without public workers – has somewhat decreased. The 3.3 percentage increase in the number of full-time employees was accompanied by a 0.7 per- centage decrease in the number of part-time workers. Therefore the average number of employees in full-time employment was 2,690 thousand while in part-time employment 288 thousand in the group observed. As regards the most important economic sectors in industry the employment growth was 2.9 percent while the increase in the commercial and vehicle mechanics sec- tor was 3.8 percent.
In 2016 the employment rate of the age group 15–64 increased to 66.5 percent on an annual basis and reached its peak at 67.5 percent in the fourth quarter of the year. The latter, compared to the same period of the previous year represents an improvement of 2.7 percentage points, out of which how- ever, 0.5 percentage point is a result of the shrinking number of the working age population forming the denominator of the employment rate. The em- ployment rate of men exceeded the EU average whilst the employment rate of women converges to it. (If those women who have a job and receive child- care benefit based on their previous wage were to be counted into the number of the employed – and which counting method is not against methodologi- cal arrangements in principle – the female employment rate would be above the EU average too.)
LABOUR DEMAND AND LABOUR FORCE POTENTIAL
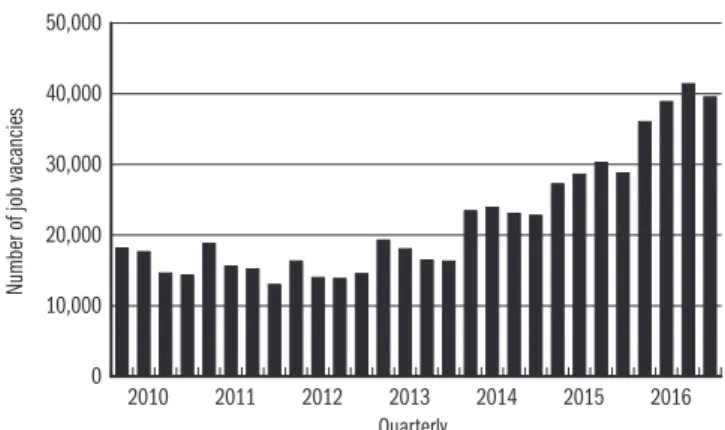
Though statistical data sources are not able to provide exact information on the number of additional employees required in the economy it is obvious that labour demand of enterprises has significantly increased compared to the pre- vious year. According to the institutional statistics on job vacancies enterprises with at least 5 employees reported 36 thousand existing or forthcoming job vacancies in connection with which they have already taken steps to find an employee as soon as possible in the first quarter of 2016. This number was 39 thousand in the second, 41 thousand in the third and nearly 40 thousand in the fourth quarter of 2016 (Figure 2). Therefore, the annual average number of job vacancies was 36 percent higher than in the previous year.
Within the private sector the number of job vacancies was the highest in the ICT sector namely 1.5 times higher than the sectoral average (1.9% in Q4) in 2016. Enterprises in the manufacturing sector reported 15 thousand vacancies in the last quarter of the year, equalling to 2.2 percent of the num- ber of jobs in manufacturing. The number of reported job vacancies was 4.1 thousand in the commercial sector which hires the second largest number of employees in the national economy. Within manufacturing industry the
7 This is a sample-survey and the selection rate is complete only regarding entities with 50+ em- ployees. Multiplication is based on the number of entities in the register. The review regarding the employee headcount cat- egory is carried out once a year and its impact is the so called register impact.
0 10,000 20,000 30,000 40,000 50,000
2016 2015 2014 2013 2012 2011 2010
Number of job vacancies
Quarterly
number of job vacancies was exceptionally high at pharmaceutical production firms where 4 out of 100 positions were unfilled in the fourth quarter of 2016.
This was followed by firms producing computer, electronic and optical goods with a proportion of 3.7 percent. As regards the number of job vacancies in an EU context Hungary is middle-ranked however there are relatively big dif- ferences among member states. In the fourth quarter of 2016 the vacancy rate was the highest in the Czech Republic (at 3 percent) while in Greece – at the other end of the scale – it was only 0.3 percent. The number of job vacancies is mainly determined by the economic situation but the statistically assessed (nominal) value is not entirely independent from the data reporting disci- pline of the given country.8
Figure 2: Number of job vacancies in the business sector
Source: Number and proportion of job vacancies. HCSO, Stadat.
Besides the statistics on job vacancies in line with EU requirements trends in labour demand are also indicated by the data collection of the National Employment Service (PES) based on the continuous reporting of employers.
Employers generally have an interest when reporting job opportunities which ones they would like to fill with foreign workers or for which ones they intend to request wage support. Additionally, labour demand is reported in connec- tion with lower skilled jobs as in this case the potential labour force is much more likely to be available amongst registered job-seekers. This is underlined by the fact that in 2016 76 percent of the 48.4 thousand reported job vacan- cies were jobs which employers wanted to fill on a supported manner. As re- gards the number of reported job vacancies this means an annual increase of 15 percent while at the same time the number of job vacancies with a request for wage support has slightly decreased. In December 2016 the number of the registered vacant positions in the PES database was 138.6 thousand out of which 89.8 thousand could not be filled in that month. In the previous year these figures were 117.8 thousand and 59.4 thousand respectively. Therefore,
8 The number of domestic job vacancies is certainly underesti- mated as many reporting entities do not send the report at all or leave the section on the number on job vacancies blank.
not only the number of the registered job vacancies increased, but the prob- ability that these being filled decreased as well.
According to the EU definition the labour force potential includes certain groups of all the three main labour market categories (the employed, the un- employed and the inactive). Within the employed category the so called ‘un- deremployed’ belong to this group i.e. those persons who work involuntarily in part-time employment due to the reason they were not able to find a full- time job. As the proportion of part-time employees is substantially low in Hungary – in 2016 only 228 thousand persons out of the 4 million 352 thou- sand employees were hired in part-time work – this group is considered to be relatively small. In 2016 only 25 thousand men and 37 thousand women reported that they wanted to work full-time instead of part-time and many of this group were working pensioners. Although the classical definition of the labour force potential does not cover the small group of those who work part-time due to child care or other dependent care responsibilities a certain part of them definitely could work full-time if they received more help from the care system in fulfilling their duties.
Public workers – although according to the Hungarian statistics belonging to the employed category – form a special and large segment of the potential labour force. The form of public work in this case is a special but not optimal solution substituting ‘normal’ employment on the one hand and the precon- dition of the eligibility for job-seekers benefit – and from this respect part of the active labour market policy measures – on the other hand. The govern- mental attitude on public work changed in 2016 by explicitly expressing the goal to speed up the transition to the primary labour market through admin- istrative measures and incentives i.e. the growing wage gap between the public employment wage and the minimal wage.
The results of these measures however are still not reflected in the number of public workers in 2016. Based on the administrative data collection9 of the Ministry of the Interior – as the responsible institution for public work – in 2016 the monthly average number of public workers was 223.5 thousand – nearly 15.3 thousand more than in the previous year. (This, both of the order of magnitude and dynamics is equal to the LSF number of those who reported themselves as public workers.) As regards the total annual data the number of public workers was 353.7 thousand in 2016. This number includes those persons who participated in public works for at least one day in the course of the year. The number of PW participants was the lowest (183.0 thousand) in March while it reached its peak during August with 246.5 thousand pub- lic workers. There are significant territorial differences in the scale of public work; in disadvantaged counties its role within employment is well above the national average. Accordingly, the number of individuals entered into a public
work contract in December 2016 was exceptionally high in Borsod-Abaúj- 9 Monthly report on the public works scheme.
2.5 0.5
1.3 1.0
2.0
2.4
2.9
4.2
8.8 5.2
9.9
4.6
4.1 8.3
10.8 6.4
10.6
14.4
16.2
9.8
– 1.3 1.4 – 2.9 3.0 – 6.4 6.5 – 10.8 10.9 –
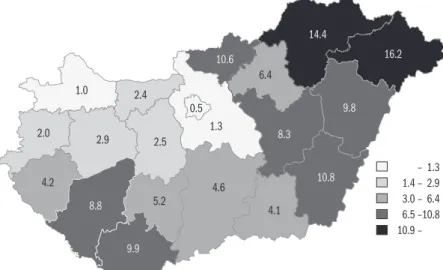
Zemplén county (34.4 thousand) and in Szabolcs-Szatmár-Bereg county (34.7 thousand). This means, that two-thirds of PW contracts were concluded in these two counties. At the other end of the scale the number of PW contracts remained below 3 thousand in Győr-Moson-Sopron, Komárom-Esztergom and Vas counties.
Figure 3: The calculated rate of public workers aged 15–64 within the employed (percentage), 2016
Source: Public workers: Communication of Ministry of Interior on public work. Em- ployed: HCSO, labour force survey.
The composition of PW participants by educational background was consid- erably more unfavourable than the national average. According to the data of Q4 2016 9 percent of the participants did not even finish primary school and a further 46 percent had primary school as their highest qualification.
Compared to the previous year the composition of the participants by skill level has worsened as only the proportion of participants with a primary school education has risen. At the same time the proportion of participants with a secondary vocational qualification has decreased. This data indicates that only the more qualified public workers could benefit from the growing chance of the transition. In addition to the low educational background and the lack of qualification another main factor in public work participation was the place of residence – it was much more likely for someone to enter into public work in settlements situated far from places with higher labour demand or/and where transport opportunities were underdeveloped (which characterizes especially settlements with a very low population).
The most obvious segment of the potential labour force is the unemployed, which covers those who although not working and not having a job from which they are temporary absent are seeking a job and are available to start
40 43 46 49 52
The share of long-term jobseekers (left axis)
2016 2015 2014 2013 2012 2011 2010 2009 2008 2007
2006 15
16 17 18 19 Average lenght
of job search (right axis)
Percentage Month
working when they find an appropriate one. In 2016 the number of the so called ILO unemployed decreased from 307.8 thousand to 234.6 thousand compared to the previous year and it was especially low in the fourth quar- ter of 2016 when the number of the unemployed diminished to around 200 thousand. The unemployment rate both for women and men has improved to an annual average of 5.1 percent and with this value Hungary joined that one-fifth of EU countries where the unemployment rate is the lowest. In prin- ciple the return into employment is easier when labour demand is increasing (and the (in an EU context) extremely short period of unemployment benefit in Hungary could further encourage job-search). In spite of this, more than 48 percent of job-seekers were long-term job-seekers in 2016 and the average time spent in unemployment was 18.4 months (Figure 4).
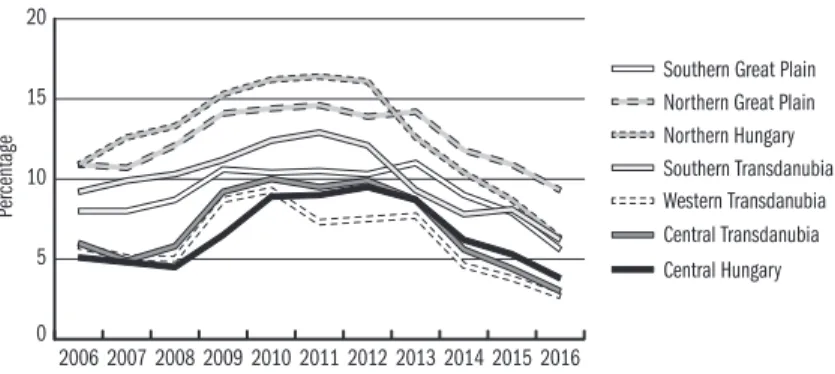
The unemployment rate has decreased in all regions (Figure 5) but territorial disparities are still considerable in spite of the compensatory role of the public work. (The unemployment rate was the lowest in the Western Transdanubia region at 2.1 percent while it was the highest in the North Great Plain region at 8.0 percent in the fourth quarter of 2016.)
Figure 4: The average length of job search (month, right axis) and the share of long-term jobseekers (percentage, left axis)
Source: HCSO, labour force survey.
Another important information source on the number of unemployed is the administrative register of job-seekers. A certain element of the unemployed do not search for a job effectively (however through the registration the client declares that he/she is ready to accept a job opportunity offered by the labour office), and therefore do not belong under the category of the unemployed ac- cording to the labour force survey based on the ILO definition. Furthermore, another smaller portion of the jobseekers carry out some kind of income-gen- erating activity and therefore is considered to be employed. Hence the number of registered job-seekers is highly dependent on the national characteristics
0 5 10 15 20
Southern Great Plain Northern Great Plain Northern Hungary Southern Transdanubia Western Transdanubia Central Transdanubia Central Hungary
2016 2015 2014 2013 2012 2011 2010 2009 2008 2007 2006
Percentage
of the benefit system so this definition is clearly not suitable for international comparison nor is it used to determinate the potential labour force. Howev- er, having an exact knowledge on this group is inevitable in understanding the domestic labour market situation and establishing the appropriate set of measures for tackling unemployment. In 2016 the number of registered job seekers also decreased but the change was somewhat more moderate than ac- cording to the definition of the labour force survey or according to the num- ber of those who reported themselves as unemployed. The very probable rea- son behind this is that the status of a significant section of public workers is regularly changing between registered job-seeker and public worker. The an- nual average number of registered job-seekers was 313.8 thousand out of 35.8 thousand career-starters. (In the previous year the number of job-seekers was 378.2 thousand.) It is worthwhile to examine the trends on job-search inten- sity of job-seekers over recent years (Figure 6).
Figure 5: Unemployment in the regions of Hungary, 2006–2016
Source: HCSO, labour force survey.
As outlined in Figure 6 job search intensity reached its maximum level only two years after the peak of the unemployment rate and only started to de- crease – to a smaller extent – when the unemployment rate started to shrink.
The reason for the different increase and decrease rate between the search in- tensity and the unemployment rate could be the reform of the unemployment benefit system effective from 1st September 2011 when the eligibility period for unemployment benefit was cut back significantly while the maximum amount of the benefit was reduced10 in order to encourage the return to work.
Unemployment benefit – with the shortest eligibility period (90 days) in the EU and with its maximized amount at the level of the current minimum wage – was provided in total to 60.2 thousand persons in 2016. The major- ity of the registered unemployed – 51 percent – were granted the employ- ment substitution support with an amount of 22 800 HUF which remained unchanged for years. According to the EU recommendation those inactive persons who do not search a job effectively but were intending to work and
10 According to the new rules ef- fective from 1st September 2011 recipients have to spend a mini- mum of 360 days in employment within a 3 years period instead of the former 5 years period.
Additionally, the length of the eligibility period was shortened significantly to a minimum of 36 and a maximum of 90 days therefore one day of eligibility equals to ten days of employ- ment instead of the former five days. The maximum amount of the benefit – similarly to the former regulations – is 60% of the labour market contribution base but its upper threshold was modified to 100% of the mini- mum wage and the former lower threshold was abolished.
4 6 8 10 12
Unemployment rate (ILO) (left axis)
2016 2015 2014 2013 2012 2011 2010 2009
2008 3
4 5 The average search intensity
(right axis)
Percentage
in the event of an appropriate job offer were able to start within two weeks also belong to the potential labour force. In 2016 128 thousand persons be- longed to this category. In addition to this, those inactive persons who carry out job search activities but are not able to start to work (for example because they are currently engaged in studies) are also part of the labour potential.
The size of this latter group however is negligible as only 7 thousand persons met these criteria in 2016 (in addition to a sampling-error of 3.7 thousand regarding this data).
Figure 6: Evolution of unemployment and average search intensity*
* In line with recent studies the definition of job search intensity was the number of different search methods used in a given period. During the accumulation of the search methods two activities in connection with starting a business (debit and administration of license and search for land, settlement) and two passive search activities of the previous period (‘application made waiting for answer’, and ‘waiting for the notification of the labour office’) were not taken into consideration.
Source: HCSO, labour force survey, own calculation.
Table 2: The number of employed and the potential labour force (thousand persons)
Category 2010 2015 2016 Change
2016–2015
Total employed 3,732.4 4,210.5 4,351.6 141.1
Out of – underemployed 59.2 74.6 51.0 –3.6
– public worker 87.3 211.6 220.9 9.3
Unemployed 469.4 307.8 234.6 –73.2
Out of inactive: wants to work but is not
disposable 10.3 8.5 6.9 –1.6
Out of inactive: wants to work and is
disposable 200.8 144.5 128.5 –16.0
Source: HCSO, labour force survey.
In 2016 420.5 thousand people belonged to the category of the potential ad- ditional labour force as defined by the EU (this excludes those in public works programme), which is 115 thousand less than a year before. Similarly to previ-
ous years this group, especially unemployed people, provided the main source of employment growth in addition to the surplus resulting from the increase of the retirement age.
Beyond the classical definition of the labour force potential Hungarians working abroad as well as temporary foreign workers in Hungary could be taken into account as further potential labour force. The dynamics of migra- tion and the number of returning emigrants cannot be estimated in advance.
At the same time foreign labour supply remained low as Hungary is not a target country for EU migrants: labour mobility tends towards countries with a sig- nificantly higher wage level; and the admission of non-EU migrants is not an option for the government even in the case of a more serious labour short- age in the future. The employment conditions of Ukrainian workers were eased in order to broaden the potential labour force through facilitating in- ward labour migration. In this case however it has taken into consideration that other countries – e.g. Poland – facing similar challenges mean a serious concurrence for Hungary from this respect. The ending of the opportunity for women to enter into retirement after 40 years of employment – which is even not under consideration – could further increase the labour reserve. Ac- cording to the data of the pension insurance institution nearly 180 thousand women have already chosen this option and the scheme is still very popular.
In 2016 those women who had a secondary school leaving exam (‘matura’) but did not carry out studies as a regular student and had a more or less con- tinuous employment relation could obtain five years of ‘pre-pension’ period.
Its abolition therefore – besides financial reasons – could be justified by its discriminative nature as it does not pay regard to men and additionally does not take into account the fact that physical and mental conditions as well as working ability depend rather on age than purely on the length of time spent in employment. Consequently, it would be fairer and more tailor-made if the individual – within not too wide limits – could take the decision on the time of his/her own retirement and in return for the earlier exit would relin- quish a certain percentage of their pension.
Taking into consideration the current (targeted) retirement age of 65 years – and the general health condition of the population – there is no significant labour force potential in the higher age segment of the working age popula- tion. In addition to this, later generations are not expected to spend a short- er time in education and as a consequence will not spend longer periods in employment either.
EARNINGS
In 2016 wage increase – in addition to the favourable economic situation in general – was influenced by the enhanced competition for workforce. This
0 50 100 150 200 250 300
Public sector without public workers Private sector
2016 2015 2014 2013 2012 2011 2010 2009 2008
Thousand HUF
extra cost not only occurred in connection with new employees but was also necessary to fulfil – at least partially – the wage increase request of the ex- isting employees in order to retain a skilled workforce. The willingness over the retention of the labour force through higher wages did not character- ize exclusively the business sector as such initiatives were also important el- ements of the governmental strategy in the public sector in 2016. The gross wage in the national economy has increased significantly – and to a greater extent than in previous years – in total by 6.1 percent to 263,200 HUF in 2016. Net wage was 7.8 percent higher than in the previous year, which tak- ing into account the permanently low level of consumer price index at 0.4 percent meant a 7.5 percent increase in regard to real wages. In 2016 unlike previous years the wage of public workers11 – representing nearly 8 percent of the national wage statistics record – did not change. Therefore without this group the total wage growth in the national economy was 0.4 percent higher and the gross nominal wage was 15,000 HUF higher.
Gross earnings in the public sector (without public employment wage) in- creased by 9.6 percent while gross earnings at private sector enterprises with at least 5 employees increased by 5.4 percent compared to the previous year.
At the same time gross wages in the non-profit sector increased by 5.7 percent.
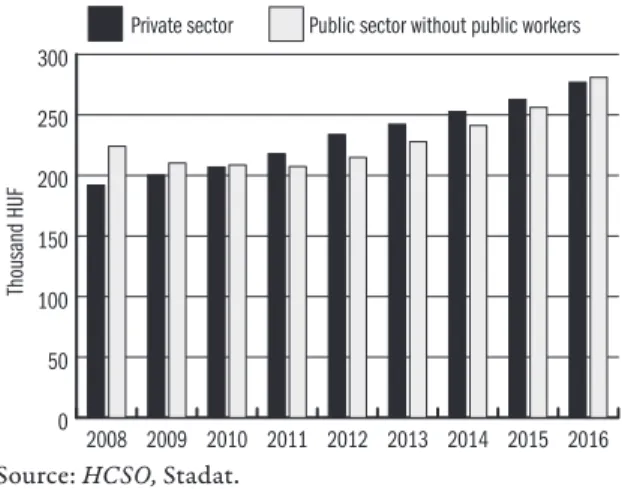
(The non-profit sector due to its low share in employment has only a mod- erate impact at the level of the national economy.) The largely different pace of wage growth in the public and the private sector contributed to the phe- nomenon that – for the first time after long years – the gross average wage in the public sector (not including public workers) exceeded the gross average wage in the private sector.12
Figure 7: The evolution of per capita monthly gross earnings (thousand HUF)
Source: HCSO, Stadat.
Wage developments in the private and public sectors followed a different growth pattern since the start of the economic crisis. Business sector wages
11 Gross salary data published by the Central Statistical Of- fice on a regular basis is applied to full-time employees hired at business sector companies with a minimum of five employ- ees, public sector institutions and non-profit organisations assigned on the basis of employ- ment aspects.
12 This statement is only valid for the average value and for those belonging to physical oc- cupational groups. In the public sector the wage of white-collar workers – which means three- quarters of the total number of employees – was still lagging behind by 27% in 2017.
have constantly increased – however at annually different paces – while the nominal wage in the public sector has decreased due to the abolition of the 13th month salary in 2009 and of the supplementary support – as a partial compensation for low earners – in 2010. Since 2013 wages in the public sec- tor started to increase more dynamically than in the private sector as a result of the introduction of the several important wage correction mechanisms which affected a large number of employees – albeit this increase was more uneven than in the private sector.
The government – over and above its direct impact on wage trends in the public sector (and at public owned organisations in the private sector) – could influence the evolution of gross salaries through the setting of the minimum wage (which is – at least theoretically – the result of a tripartite consulta- tion). The government could initiate a certain minimum wage growth based on different reasons in the given year. Apparently if the pace of the minimum wage growth exceeds the increase in the average wage that could affect the liv- ing standards of low income people positively and also contribute to legalize unofficial incomes. An additional reason for the increase – which becomes more and more important with the growing labour shortage and which was among the reasons of the significant minimum wage increase of January 2017 – is that the growing gap between the public employment wage and the mini- mum wage could further encourage public workers to enter into the primary labour market.
An argument against minimum wage increase is its possible contribution to the labour market exclusion of low productivity workers (and firms with low profitability). This is undoubtedly a more important factor in the case of the presence of a large scale labour reserve. According to the conclusion of Harasztosi–Lindner (2017) the significant (nearly 60 percent in real terms) increase of the minimum wage had only a moderate impact on employment – only 10 percent of minimum wage earners lost their jobs – and nearly 80 percent of the wage increase was paid by consumers (in the form of higher prices) who bought goods produced by minimum wage workers; and only 20 percent by the owners of the company.
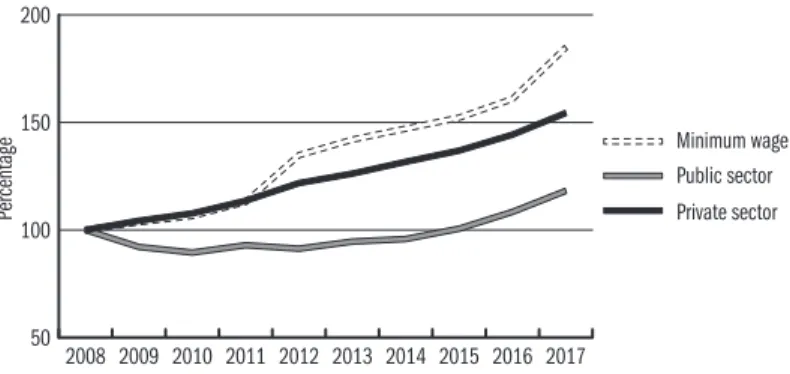
Minimum wage and gross average wage in the private sector has increased at a similar pace since 2010 – except for 2012 and from 2017 onwards (Figure 8). In 2016 the 5.7 percent minimum wage growth (and similarly the skilled minimum wage) exceeded the average gross wage growth in the private sec- tor only by 0.3 percent. The minimum wage of 111,000 HUF was equivalent to 42 percent of the average wage of the national economy and 52 percent of the wage of the manual workers in the manufacturing industry – which is the sector hiring the largest number of employees. At the same time this amount equalled to 60 percent of the guaranteed minimum wage for skilled workers, while the wage of public workers was 71 percent of the minimum wage. (By
50 100 150 200
Minimum wage Public sector Private sector
2017 2016 2015 2014 2013 2012 2011 2010 2009 2008
Percentage
the introduction of the public employment wage this proportion was still 77 percent.) In 2017 the minimum wage increased by 15 percent; and the guar- anteed wage minimum by 25 percent. According to preliminary annual data the gap between the growth rate of the average wage and the minimum wage is expected to increase again.
Figure 8: The evolution of gross earnings and the minimum wage* (2008 = 100 percent)
* Preliminary data of 2017 except for minimum wage.
Source: HCSO, Information database.
In 2016 the wage gap between manual and non-manual workers in the busi- ness sector has decreased as gross earnings of manual workers increased by 5.9 percent while that of intellectual workers increased only by 4.5%. The change of this rate was highly influenced by the fact that three-fifths of the manual workers are hired in the manufacturing and commercial sectors within the private sector.
In the commercial sector the former rule on the Sunday closure of retail shops – introduced a year before – has been repealed. As a result the weight of the weekend compensations increased. In addition to this, bigger shopping chains – in order to maintain their workforce – tried to compensate employees with higher salaries for the growing workload due to the increased turnover in respect to the strengthened public purchasing power as well as for the longer working week. Thus in the second half of the year numerous wage develop- ment agreements were concluded – occasionally even containing a double- digit salary increase. Due to this forward looking perspective the increase in the minimum wage and the guaranteed minimum wage in January 2017 did not cause major difficulties in this group of businesses. However smaller retail shops with fewer employees – similarly to other economic entities carrying out activities at a lower profit level – could implement the compulsory minimum wage increase only by the cutting back of non-wage benefits or by reducing the working time or eventually by dismissals. The competition for a skilled labour force stimulated the wage increase in the manufacturing industry but
the so called calendar impact (the number of working days in the given year) contributed to the stronger dynamics too.13
The ranking of wage-levels of different sectors in the national economy – within the business sector clearly dominant – remained unchanged for years.
Similarly to previous years, the gross salary was the highest in the financial and insurance sector with a monthly average of 519,000 HUF in 2016. This was followed by a monthly average wage of 479,600 HUF in the ICT sector; and by 454,400 HUF in the electricity, gas, steam and air conditioning industries.
Within manufacturing – where the average wage was HUF 279,300 – workers in coke and refined petroleum industry (by 690,000 HUF); and in pharma- ceuticals production (by 451,300 HUF) obtained the highest monthly wage.
Reported wage was the lowest in the accommodation, restaurant and cater- ing sectors where the amount of the gross wage – 166,000 HUF – was only 5,000 HUF higher than the guaranteed minimum wage for skilled workers since January 2017. According to the ranking of wages this was followed by the forestry industry with less than 14 thousand employees (including a few hundred public workers) with 169,100 HUF. Within manufacturing the av- erage wage was the lowest (167,100 HUF) in the clothing, textile and leather production industry group where women are highly overrepresented.
The last overall wage increase for the nearly 700 thousand employees of the public sector14 has been carried out in 2008. Then in 2013 with the introduc- tion of the life career-model a gradual transition to a different wage system has started and this initiative affected several professional areas in the public sector in 2016. Instead of a sectoral approach the life career-model relates to professions and professional-groups (mainly those which according to policy makers have key importance in the given field). Therefore it could happen that employees involved in the life career-model earned much more than others at the same workplace that stayed in the original public service system and received only occasional wage supplements in order to ease wage pressure.
The pace of the wage increase was implemented according to a similar ap- proach: the significant and concentrated wage increase in the first year was followed by smaller-scaled increases in the next three-four years when the re- maining amount was distributed. Therefore, even the primarily introduced pedagogue life career-model affected the evolution of earnings in 2016. Par- allel with the transition to the new wage system the number of salary bonus items has been decreased significantly. As a result, average wage increase in reality could lag behind the one declared. In 2016 and even in 2017 there are certain groups of public sector employees who have not been subject to any positive wage development tools since 2008 and as the previous advance- ment system counted with a much lower retirement age those who will enter into retirement will receive a pension that is based on the unchanged salary level of the past nearly 10 years. (Life-career model already considers the ex-
13 In 2016 the number of work- ing days was 255 compared to 254 in 2015. However, in 2017 the number of working days will be only 252 partly because fewer holidays will fall on weekends and partly because Good Fri- day became an additional paid holiday.
14 The analysed data of the pub- lic sector do not include public workers.
tended retirement age. However the developers of the life-career model could not take into account the projected impact of the minimum wage increase of 2017 on which a significant part of the budget of the planned wage increase of 2017–2018 will be spent and additionally the negative impact of the wage increment at the lower end of the wage scale have to be compensated from this money as well.)
In 2016 the wage of the 255 thousand full time employees in the predomi- nant fields of the public sector (public administration, defence and compul- sory social insurance) rose by 10.3 percent – slightly stronger than the average wage increase in the public sector as a whole (9.8 percent).
The most important part of the wage development – in addition to meas- ures affecting smaller groups of employees – was the wage arrangement of the 64 thousand employees in the field of defence (soldiers, police officers, fire- fighters). Out of the total increase of 50 percent 30 percent was scheduled to July 2015 that – through the basis value – had an impact on the wage index of 2016 and which will be followed by an annual 5 percent increase over the next four years. Public sector employees in these professional fields did not belong under the scope of this increase and they only will partake in a mod- erate wage increase of 10 percent in 2017. As from June 2016 wages of the district offices and the National Tax and Customs Office were rearranged.
From October 2016 the salary of the judges increased by 5 percent and will be further increased in 2017 and 2018.
The life-career model of pedagogues in public education was set up in 2013 and this, after the initial wage increase of 34 percent ensured an annual in- crease of 3.5 percent each year until 2017. Those teacher-care assistants who work in public education but do not have a qualification in pedagogy were provided with a wage supplement of 70,000 HUF in two parts and could ex- pect a differentiated increase of 10 percent in 2017. The wage arrangement of lecturers and researchers in higher education was carried out in the fourth quarter of 2016. The intensity of the wage growth was 15 percent and a further annual increase of 5 percent is expected. In total the wage of the 168 thou- sand full-time employees in the education sector increased on average by 6.4 percent – by 4.6 percent in the public education sector and by 13 percent in the higher education sector.
As the first serious labour shortages occurred in the health and the social care sector wage-correction measures – at smaller subfields – have been con- tinuous since 2011. The more general wage arrangement and the introduction of the life-career model were introduced in 2016. Half of the planned 55–80 percent wage increase (with a different rate for diverse professional groups) was already implemented in 2016. Employees in the social benefit system re- ceived wage benefit in 2014 and wage supplement in 2015 and 2016. Together with the planned similar supplement in 2017 the estimated wage growth in
total will be 30 percent. In 2016 the average annual gross wage increase was 11.1 percent in total in human health and social care sectors. Within this rate the wage index was 111.5 percent in the human health sector whilst 109.5 percent in the social care sector. Nevertheless the average gross wage in this latter field was still only 175,000 HUF in 2016 which was marginally higher than the guaranteed minimum wage from January 2017.
Compensation is a special wage element at public institutions and non- profit organizations fulfilling tasks delegated by the state. For wage compen- sation those employees are eligible whose salary decreased as a result of the personal income taxation changes in 2011. Due to the wage correction meas- ures and labour force exchange the number of eligible persons is continuously decreasing. In 2016 compensation was requested by 142 thousand persons (approximately one-third of the initial claimants) with a monthly average amount of 9,400 HUF.
The advantages of the economically more favourable territories – besides the employment rate – are also reflected in higher wages. Generally, in coun- ties where the employment rate is low (and therefore labour force potential is higher) wages are also below average and vice versa. The cumulative assess- ment of these two factors shows a picture of a strongly polarized Hungary where – with few exceptions – regions either belong to the first or the second category (Figure 9). Such exceptions are Heves and Tolna counties where the gross average wage of employees exceeds the countryside average. In the case of Heves the difference could be explained by the high wages of the Thermo- electric Power Station of Visonta which has a major weight in the employment in this area. The Nuclear Power Station in Paks has a similar impact in Tolna county. The single county with both a high employment rate and concurrent low wages is Zala where industries with higher average wages are underrepre- sented; furthermore wages in other sectors – which represent a higher share in the employment structure – are also below average.
The amount of the net earnings depends on the current legislation on taxes and contributions. In 2016 the flat rate of the personal income tax decreased by a further 1 percent (to 15 percent), while the amount of employees’ con- tributions remained unchanged. Therefore the growth rate of the average net wage exceeded the increase in gross wages. The net wage index – excluding public workers – was 108.1 percent while the net average wage was 185,000 HUF this latter equaling to 184,200 HUF in the business sector and 157,900 HUF in the public sector. (Average wage in the public sector without public workers was 186,700 HUF). The amount of the family tax allowance – in- troduced in 2011 – has increased too. In the case of one dependent child the amount deducible from the tax base increased from 62,500 HUF to 66,670 HUF; in the case of two dependent children to 83,330 HUF; and in the case of three or more dependent children from 206,250 HUF to 220,000 HUF.
57 59 61 63 65 67 69 71 73 75 100
150 200 250 300 350
Low employment rate, high average wage
Monthly gross salary, thousand HUF
High employment rate, high average wage
Low employment rate, low average wage
High employment rate, low average wage
Employment rate, percentage
Bp
GyMS
Ve KE F H P
T V
Cs Z BK JNSz Bé Ba BAZ HB
N S SzSzB
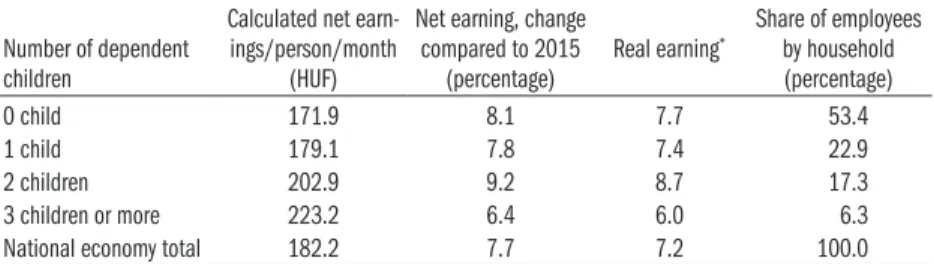
The growth – both in absolute and relative terms – was the most intensive in the case of those raising two children so that a further annual increase is fore- seen until 2020 (Table 3).
Figure 9: The situation of counties in the context of the employment rate of the age group 15–64 and the gross salary* 2016
* Gross salary according to establishment, 2015
Abbreviations: ��: ��cs-�iskun, �a: �aranya, �e: ��k�s, �A�: �orsod-Aba�j-�emp-��: ��cs-�iskun, �a: �aranya, �e: ��k�s, �A�: �orsod-Aba�j-�emp- l�n, Cs: Csongr�d, F: Fej�r, GyMS: Győr-Moson-Sopron, H�: Hajd�-�ihar, H: He- ves, JNSz: J�sz-Nagykun-Szolnok, �E: �om�rom-Esztergom, N: Nógr�d, P: Pest, S:
Somogy, Sz�s�: Szabolcs-Szatm�r-�ereg, T: Tolna, V: Vas, Ve: Veszpr�m, �: �ala.
Source: Inventory of HCSO.
Table 3: Net and real earnings calculated with the family tax relief, 2016 Number of dependent
children
Calculated net earn- ings/person/month
(HUF)
Net earning, change compared to 2015
(percentage) Real earning* Share of employees by household (percentage)
0 child 171.9 8.1 7.7 53.4
1 child 179.1 7.8 7.4 22.9
2 children 202.9 9.2 8.7 17.3
3 children or more 223.2 6.4 6.0 6.3
National economy total 182.2 7.7 7.2 100.0
* Calculated at the 100.4% consumer prices index in 2016
Source: Monthly employment report and micro simulation model with the use of the data of Household �udget and Life Circumstances Survey (HCSO, 2017b, page 7.).
According to the result of the microsimulations model based on demograph- ic and income data of households, the family tax allowance in the examined
group constitutes an additional income of an annual average amount of 7200 HUF per employee. In the case of two children this additional amount was 31,000 HUF while for employees raising three or more children 51,000 HUF compared to the net income of those without children.
The international definition of income includes other types of work incomes besides the wage. The main part of this other work income is the so called ‘caf- eteria’ (fringe benefit) which amount could be influenced by the state indirect- ly through taxation regulations. The agreement on the cafeteria is often part of wage bargaining but the income provided as fringe benefit means a weaker commitment for the employer than direct wage increase. (A good example for this is that in 2017 some companies counterweighted the additional costs of the increased minimum wage by the cut of the cafeteria.) As determined for international comparison in 2016 the average amount of the income was 277,200 HUF out of which 14,100 HUF was additional non-wage benefit.
The amount of the additional income per employee shows large differences even within the same industry/sector but in general employees are provided higher non-wage benefits in sectors where wages are higher than average thus this further increases the already high wage gaps among sectors. In 2016 the amount of the non-wage benefit was the highest in the electricity, gas, steam and air conditioning industry with the monthly average above 30,000 HUF.
In some fields of manufacturing (coke oven products and refined petroleum production and pharmaceuticals production) employees gained even higher non-wage benefit. Conversely, in the social services sector (where the major- ity of public workers are hired who in general are not provided with any non- wage benefit) the amount of the additional work income was only 2,500 HUF.
REFERENCES
Ministry of Interior (2017): Monthly report on the public works scheme, December, 2016. Ministry of Interior, �udapest.
Harasztosi Péter–Lindner Attila (2017): Who pays the minimum wage? Manu- script.
HCSO (2017a): Hungary, 2016. Hungarian Central Statistical Office, �udapest.
HCSO (2017b): Labour market processes, 2016 Q1–Q4. Statistical Mirror, 12th April.
MNB (2017): Inflation report. Hungarian Central �ank, �udapest, March.