D EPARTMENT OF
E CONOMICS AND B USINESS
W ORKING P APERS
economics.ceu.edu
Effect of employment tax incentives:
the case of disability quota in Hungary
by
Judit Krekó
12019/1
1Central European University, Department of Economics and Business and MTA KRTK KTI,
Working Paper 2012 Central Eur
Abstract
This paper evaluates the effect of the Hungarian disability quota - levy system on disabled employment and firm behavior, and also aims to shed light on factors influencing the effectiveness of employment tax incentives.
According to the quota rule, firms above a certain size threshold have to employ at least five percent disabled employees or pay a levy in case of non-compliance. The special feature of the Hungarian quota system is the uniquely high levy, which is accompanied by poor labor market integration of the disabled. The estimation exploits two significant policy changes: the drastic raise of the levy in 2010 and the increase of the firm size threshold from 20 to 25 employees in 2012. The policy effect on disabled employment is estimated on firm level data with regression discontinuity design. The baseline RDD results are adjusted to account for the potential bias arising from non-random firm selection, as many firms adjust their size to avoid the quota. The estimated disabled employment effect is high in international comparison, however, almost three-quarter of the quota is not fulfilled. I find evidence that the ratio of disabled population influences the disabled employment effect of the quota. This suggests that low effective labor supply and high (perceived) non-wage costs of hiring disabled are factors behind low quota fulfillment.
JEL: J14,J21,J22,J23,J78,H32
Acknowledgement: I am grateful to Gábor Kézdi, Álmos Telegdy, Andrea Weber for the guidance, Anna Adamecz, Róbert Lieli, Zhuan Pei, Ágota Scharle, Ágnes Szabó-Morvai, the participants of PhD research and IE HAS seminars, EEA-ESEM and EALE conferences for valuable comments, the Trenkwalder Hungary for sharing experiences and useful information on disabled employment. All remaining errors are my own.
1 Introduction
The labor market integration of disabled population is a great challenge in all countries. In labor market context, the concept of disability refers to a long term physical or mental health problem that causes serious work limitation, and employment rates of the disabled are usually well below the non-disabled population. Developed countries usually apply an arsenal of dierent, supply and demand side policies to boost the labor market integration of disabled individuals. Disability quota system is a commonly used element of the toolkit that concentrates on the demand side.
Firms, usually above a certain size threshold have an obligation to employ a certain number of disabled employees or pay a tax in case on non-compliance. Thus, the aim of quota-levy systems is to enhance the labor market demand by increasing the relative cost of employing non-disabled employees.
This paper evaluates the eects of the Hungarian disability quota-levy system on employment of disabled persons and rm behavior. In addition, exploiting the special features of the Hun- garian quota-levy system, the paper also aims to reveal factors inuencing the eectiveness of the policy. The Hungarian quota-levy system is peculiar in terms of the amount of levy compared to wages, which has become one of the highest in the world after a dramatic, 454 percent increase in the middle of the nancial crisis in 2010. A unique feature of the system is that the levy is higher than the minimum wage cost of fullling the quota. Nevertheless, the quota fulllment can be considered rather low: more than 70 percent of rms above the threshold chooses paying the levy instead of hiring a disabled employee. This paper aims to shed light on the roots of this contradiction.
In addition to the drastical levy hike in 2010, the identication of the quota employment eect exploits another policy change: the increase of the rm size threshold from 20 to 25 employees in 2012. Similarly toLalive et al.(2013),Mori and Sakamoto(2017),Malo and Pagán(2014), in the rst step the employment eect of the quota was estimated by applying regression discontinuity design (RDD), focusing on the years before and after the two reforms. I nd that rms react quickly and intensively to the policy changes. Basic sharp RDD estimations show no signicant discontinuity before the levy hike. However, in 2010, when the increase came into eect, more than quarter of the quota is fullled thanks to the regulation. A similarly large discontinuity is estimated in 2012 at the increased, 25-employee threshold, while the discontinuity at the old threshold disappears within a single year.
However, probably attributable to the exceptionally high levy, Hungarian rms are more inclined to change the size of their workforce in order to avoid the regulation than in other countries, resulting in a solid bunching in rms' distribution below the quota threshold. The bunching shifts upward with increasing the rm size threshold, conrming that the observed discontinuity in rms' distribution is related to the disabled quota. As the assumption of random rm selection around the quota threshold is violated, baseline RDD might produce an upward biased estimation of the treatment eect. Firm size manipulation was also detected in the Austrian case byLalive et al.(2013), and they apply a back-of-the envelope method to calculate lower and upper bounds for the treatment eect. For the Hungarian case, where bunching is more spectacular, I estimate the potential magnitude of the bias using a simulation method, using an estimated counterfactual distribution to calculate the mass of rms that keep their size below the threshold on account of the levy. The basic idea is based on the method Lalive et al.
(2013), and the estimation consists of the following steps. First a counterfactual distribution is constructed by tting a power law on rm distribution, omitting observations near the threshold, where the bunching takes place. The number of rms that keep their size below in order to avoid the regulation ("bunchers") are calculated by comparing the counterfactual and the actual rm distribution. In the following step, the calculated number of randomly selected rms are moved above the threshold, that is a simulated sample is constructed such that the resulting rm distribution is smooth. The lower bound of the quota's disabled employment eect is the average of treatment eects of re-estimated RD from a simulation of 100 draws.
Results show that the bias caused by the bunching accounts for at most 40% of the estim- ated disabled employment eect, the quota strongly increases disabled employment even after controlling for the potential endogeneity bias. The estimated elasticity of substitution between disabled and non-disabled employees is also much higher than found in other countries, suggest- ing that rms react very sensitively to nancial incentives. Regression discontinuity estimations on rm characteristic and the composite covariate index indicates that selection of rms between the treatment and control groups is based on non-observable rm characteristics. However, RD estimations on dierent subgroups of rms indicate that the disabled employment eect at the threshold strongly depends on rm characteristics. Specically, rms with lower average wages are more inclined to hire disabled as an eect of the quota, conrming that the level of the levy compared to the average wages inuences the reaction of rms. I also nd evidence that the em- ployment eect of the quota is stronger in regions where the ratio of disabled population is higher.
This shows that low eective labor supply and high adjustment costs of hiring disabled might be factors behind low quota fulllment. The eective labor supply of disabled is constrained by many factors, for example lack of capacity in rehabilitation services or high opportunity cost of working. High adjustment costs (cost of recruiting, workplace and job accommodation, integration) and discrimination by employers also might play a role.
The few papers in the literature that study the eects of disabled employment quota usually nd positive, but moderate or insignicant eect on disabled employment around the threshold, however, in these cases, the levy is also moderate. The quota system is found to signicantly increase disabled employment in Austria (Lalive et al. (2013), Wuellrich (2010)) and Japan (Mori and Sakamoto (2017)). Malo and Pagán(2014) nd small positive employment eect for Spain that is signicant only at 10 % level,1 and Nazarov et al.(2015) conclude that changes in the quota system in South-Korea (decrease in employment threshold and increase in ne) have increased labor market participation of disabled, but after controlling for selection into the labor market, had only a limited impact on probability of being employed.
This paper primarily contributes to the quota literature by analyzing the eects of a disabled quota, when the nancial incentive is particularly strong. In addition to the signicant increase in the levy, I can exploit another signicant policy change, the increase in the rm size threshold from 20 to 25. The second policy change serves as a robustness check and strengthen the main ndings, as the policy eect changes along with the shift in the threshold.
The paper is also related to the literature that analyzes the eects of demand side employ- ment policies, for example employer-side wage subsidies and other tax incentives, as the basic mechanism of quota-levy systems is similar. Specically, all these policies operate by decreasing the relative wage cost of disadvantaged groups, thus the quota-levy system can be regarded as a negative subsidy or tax incentive. Empirical evidence on wage subsidies is mixed: there is some evidence that wage subsidies can be eective in enhancing employment of disabled (Datta Gupta et al. (2015)) and disadvantaged unemployed (Kluve(2010)), other papers nd that wage sub- sidies have modest (Katz (1996), Hamersma (2008) or no eect(Baert (2016)). Katz (1996) highlights that elasticity of labor supply and other factors, such as administration costs, stig- matization eect and employer awareness also inuence employment and wage eects of wage subsidies. However, little is known about the relevance of the dierent factors empirically. This paper contributes by showing that other factors beyond labor demand elasticity, such as labor
1However, there is no levy accompanied to the quota in the Spain case.
supply constraints and labor market frictions might have a great inuence on employment out- comes. The example of Hungarian quota-levy suggests that applying strong nancial incentives is not sucient for achieving policy goals even if rms react sensitively to changes in relative wage costs. Without addressing the underlying frictions on disabled labor market, the quota-levy rather behaves like a size-related tax that puts a disproportional burden on low-wage rms.
The remaining of the paper is structured as follows. The second section describes the institu- tional setup and mechanism of quota-levy system in Hungary. Section 3 describes the data that are used for the empirical analysis. Section 4 shows the empirical strategy and results of regres- sion discontinuity design. Section 5 shows rm heterogeneity in employment eect and provides evidence for the role of labor supply in the disabled employment eect. Section 6 concludes.
2 Institutional background
The labor market position of disabled individuals (in Hungarian terminology: individuals with changed working capacity) in Hungary seems to be particularly poor in international compar- ison.2 The employment rate of disabled in Hungary is one of the lowest in the EU, and the employment rate is only one third of that of the total working age population (see Appendix D, Figure 12).3 The large discrepancy with other EU countries mainly comes from the very low disabled activity rate, though the disabled unemployment rate is also excessive (see Appendix D, Figure 13).
2.1 Disabled quota system in Hungary
Similarly to other countries, the Hungarian disabled employment policy applies a set of dierent tools: sheltered and subsidized employment, education, rehabilitation services (for a detailed review, see for example Scharle and Varadi (2013), Scharle and Csillag (2016)). Disabled em- ployment quota is one of the most common tools, which is applied in about one third of OECD countries. OECD(2010). The aim of quota-levy systems is to enhance the labor demand for dis- abled by increasing the relative cost of employing non-disabled employees. Firms, usually above a certain size threshold have an obligation to employ a certain number of disabled employees
2International data are not completely comparable with data of our econometric analysis. Eurostat data are based on the Labor Force Survey and the disabled status is assessed on the basis of self assessment and does not imply ocial qualication automatically. However, these data give a picture about the magnitude of the problem.
3The employment rate is very low even after controlling for age and education dierences between disabled and non-disabled (source:Central Statistical Oce).
or pay a levy in case on non-compliance. The details - size threshold, levy compared to wages, quota - dier across the countries.
Employment quota has been in force in Hungary since 1991. According to the regulation, practically all employers, rms and public institutions above a size threshold are obliged to employ 5 percent of their average statistical headcount with a certicate of changed working capacity.4 The status of changed working capacity is attained through a complex assessment process implemented by the rehabilitation authority (National Oce for Rehabilitation and So- cial Aairs, previously Institute of National Rehabilitation and Social Experts).5 If the number of employed disabled is lower than the quota requirement, the rm is obliged to pay a levy (in Hungarian terminology: rehabilitation contribution) for the missing persons from the quota.
The quota is 5 percent of the yearly average statistical headcount (for details of the yearly average statistical headcount calculation, see Appendix A). The rehabilitation contribution has to be paid for the dierence between the number of disabled employees at the rm and the obligatory employment level implied by the quota, that is 5 percent of the average headcount.
Working time of disabled employees must reach or exceed 20 hours per week to be considered in the quota. However,once this minimum is attained, the working time is not relevant: a half- time disabled employee is treated in a same way as a full-time disabled, that is regarded as a full person in the quota.6
A specialty of the Hungarian regulation is that the quota is not rounded to an integer number, but it is rounded to one decimal digit. (The same applies for data both in the denominator and the numerator in the quota: the average headcount and the average number of disabled are rounded to one decimal digit.) Thus, if the threshold is 20 employees, a rm with 25 employees that employs one disabled still has to pay the levy for a quarter missing person, has to overll the quota if wants to avoid paying the levy. This rule implies that we can expect discontinuity in the number of disabled workers only at the threshold (20 employees up to 2012 and 25 employees
4There are only a few exemptions, for example the organizations of Armed Forces. Additionally those who employed in some special forms of communal and temporary employment also do not count toward the headcount of the company, that is the base of the rehabilitation contribution. First, the rehabilitation contribution was regulated in the ACT IV. of 1991 on Job Assistance and Unemployment Benets. Since 2011, the quota rules are encoded in Act CXCI of 2011 on Allowances for Persons with Disabilities and the Amendment of Certain Legislation.
The threshold was 30 employees up to 1997, then it was reduced to 20 employees from 1997. In 2012, the threshold was increased again to 25 employees. Number of employees is considered as yearly average headcount.
5A person is qualied with changed working capacity if her overall health status does not exceed 60 percent, that is, the overall health impairment at least 40 percent, or her working capacity is reduced at least by 50 percent.
The status also implies eligibility to ocial rehabilitation and disability benets.
6Note the discrepancy in recognition of part-time between total sta and disabled workers: a disabled employee is counted in the quota only if her contractual working time is minimum 20 hours per week, that is roughly 80 hours per month, compared to the 60 hours/month lower limit in case of average headcount.
afterwards). Firms have to declare and pay their obligation to the national tax authority on a quarterly basis.
2.2 Policy changes
There were two major changes in the quota regulation in the last decade.
1. Starting from 2010, the amount of the levy was increased dramatically, by 454 percent, from HUF 174 thousand per year per missing employee from the quota to 964 thousand HUF. In 2010 the levy amounted to 86 percent of the total labor cost (gross wage plus employer's contributions) of a full-time non-disabled minimum wage earner, and 31 percent of the labor cost of an employee with average wage.
After the 2010 increase Hungary became one of the top OECD countries in terms of the amount of levy compared to average wages. In 2010, the levy amounted to about 2 percent of average payroll, in contrast with the typical 0,25-1 percent in OECD countries (OECD (2003)). What makes the Hungarian system really unique is not the high levy/average wage but that it is higher than the minimum cost of the quota fulllment. Note that this increase, which put a signicant burden on rms, came into eect in the middle of the nancial crisis, after a more than 6 percent GDP loss in 2009.
The rst announcement about the increase was made in February 2009, and the law was signed in June of 2009. As a consequence, some rms already reacted in 2009, therefore the eects of the policy change are partly reected in the 2009 data.
2. In 2012, the employment threshold was increased from 20 to 25 persons, while the amount of the levy remained unchanged.7
In this paper, I focus on these two policy changes in order to reveal the eects of the disabled employment quota in Hungary.
3 Data
The empirical analysis is based on the corporate tax data set of Hungarian double-entry book- keeping rms. The database contains administrative tax les data collected by the National Tax and Customs Administration (NAV) of all double-keeping Hungarian rms from 2006-2013.
7see Act CXCI of 2011 on allowances for persons with disabilities
Tax les comprise detailed balance sheet and income statement data of rms as well as rm characteristics, such as industry, location, number of employees, ownership structure.
The corporate tax database does not contain information on the actual levy payment, as the rehabilitation contribution is led in a dierent tax form on a quarterly basis. However, corporate tax les also contain number of disabled employees.As both tax statements are gathered and stored by the NAV, the reliability of the data can be considered high. For rms, for which data for number of disabled workers is missing, but there is data on total employment, I replace missing data to zero disabled employee. The imputation concerns large number of observations.
However, tax database after the imputation and aggregate information about the levy revenues yields very similar results for the number of missing persons from the quota (for details, see Appendix B). This implies that the reliability of the data on the number of disabled persons is very high, and the imputations do not threaten the validity of the results. The correspondence of levy revenue and disabled employment data also suggests that the enforcement of the regulation is high; rms do in fact pay the levy if they do not meet the quota requirements.8
In the corporate tax database, the number of total employees of the rm is expressed with the yearly average statistical headcount, however, average yearly headcount of employees is rounded to an integer number due to the general rules of rounding. In contrast, the quota requirement is computed using average yearly headcount that is rounded to one decimal digit, and the quota itself is expressed as a number with one decimal digit (see Section 2). Due to discrepancy in rounding rules, the calculated quota requirement based on NAV database data might dier from the actual quota requirement that is prescribed by the law. Implications of dierences in rounding rules to the estimation are discussed in Section 4).
Basic descriptive statistics from the corporate tax database are summarized in Appendix F, Table 17. The total number of disabled employees at rms does not exhibit much increase in 2010, after the signicant increase in the levy. However, it seems that majority of disabled employees is employed in sheltered employment, at special accredited rms. Firms where the share of disabled employees reaches 40 percent of total work force, have the possibility to apply for a special status that implies wage and other subsidies. This status can be achieved through a process of accreditation, in which the rms have to meet some criteria to prove that they are able to rehabilitate disabled employees. As the analysis focuses on the open labor market, I excluded
8However, consistency of disabled employment and levy revenue data does not exclude the possibility that rms try to escape paying the levy by falsely reporting disabled employment. However, high cost of being found in fault in case of labor inspections is a serious disincentive, and internationally high levy revenues also suggest compliance,therefore I disregard this possibility in the estimation.
rms from the estimations where the share of disabled employees exceeded 40 percent.
In 2010, the levy amounted to 86% of total labor cost of a full-time minimum wage earner, 170% of a half time minimum wage earner, and 31% of a full-time average wage earner. As the quota can be fullled also with a part-time (minimum half-time) worker, hiring a disabled minimum wage earner even with zero productivity would incur lower cost by 70 % than paying the levy, if we disregard adjustment costs of employment and assume that and rms are able to hire disabled employees on this wage level. Despite the strong nancial incentive, majority of rms chose not to employ disabled workers but pay the non-compliance levy instead. The quota fulllment, that is the ratio of the quota that is lled with disabled employees is less than 30 % even after the levy hike (see Table 17).9 The quota fulllment can be assessed as low in international comparison, as usually 50-90% of the quota is lled with disabled employees.10
The low quota fulllment is also reected in the high aggregate levy revenue which increased from 0,06 percent of GDP in 2009 to 0,24 percent of GDP in 2011, around 65 billion HUF. As a comparison: total revenue from corporate tax was approximately 2 percent of GDP in 2011, thus the revenue from non-compliance levy can be considered as substantial. One of the main questions of the following analysis is whether the low performance is due to the fact that rms are not sensitive to the strong nancial incentive,or other factors impede disabled employment.
4 Empirical strategy
4.1 Firms' options
Firms that are subject the regulation and do not employ enough disabled workers to ll the quota face the following choices:
• Hire additional disabled worker(s)
• Substitute non-disabled employees with a disabled worker
9The quota fulllent can be measured in dierent ways, depending on the assessment of overlling the quota.
The lowest estimation for quota fulllment is given by comparing empty positions to the quota: (1-missing employees from the/quota)as this method disregards number of disabled employees who are employed above the quota requirement (11. and 15. row in table17. Relating the number of employees in non-special rms to the quota yields a somewhat higher quota fulllment, as disabled employees in rms that employ more disabled that required by the quota also are taken into consideration in this case (12-16. rows in the table).
10In OECD (2003), the quota fulllment was estimated to 64% in Austria, at least 50%in Italy, 46-72% in Korea, 57% in Germany, 64% in France. Close to 90% of the quota is fullled in Japan Mori and Sakamoto (2017). The most similar case to Hungary is Poland, where quota fulllment was similarly low at around 30%
and the levy was relatively high above 2% of average payroll. citeoecd2006)
• Pay the levy
• Avoid regulation by reducing or keeping employment below the threshold.
A rm might indeed reduce its labor demand and run with less employees to avoid the regulation, but this category also includes rms that manipulate their ocial size while the true employment remains the same. This can happen for example by contracting out employees, employing unreported workers or increasing the working time, that is decrease employment on the extensive margin while increase it in the intensive margin.
Firms above the threshold
already meets quota no change
quota not fullled
pay levy hire disabled
new worker substitute with non-disabled
avoid regulation by getting below threshold
Firms' choice rst of all depends on the amount of the levy compared to labor costs of disabled and nondisabled employees, the substitutability between disabled and non-disabled employees and the marginal revenue product of disabled and nondisabled. A rm of which optimal size without the quota is above the threshold, will choose its size below the threshold if the loss from employing less than optimal employees is lower than both the cost of hiring a disabled (either as a new hire or subsitution) and the levy. Clearly, this choice is relevant only for rms for which the non-quota optimum is not far above the threshold. A rm will choose paying the levy instead of employing a disabled, if the prot loss of employing a disabled worker (either with or without substitution) is higher than the levy. The lower is the levy compared to nondisabled wages, the labor costs of hiring disabled compared to labor costs of nondisabled, and the lower is the relative (percieved) productivity of disabled compared to nondisabled employees, the more probable is that a rm will choose paying the levy. Regarding the labor costs of disabled employees, both wages and non-wage costs might dier from those of nondisabled employees.
Following from the potential responses of rms, I analyze the eect of the quota - levy system on the employment of disabled persons, and as the quota-levy poses non-negligible burden on rms, I also analyze the eect on rm behavior. I also aim to reveal the factors inuencing the eectiveness of the eectiveness of the policy by analyzing the contradiction between low quota fulllment and high levy.
4.2 Disabled employment eect with sharp discontinuity design
As a starting point, I estimate the eect of the quota-levy system on disabled employment using sharp regression discontinuity design framework (RDD). The RDD is estimated separately for every single year from 2007 to 2012. These regressions show how the eect of the policy changes year to year around the threshold.
Firms with at least 40 % of share of disabled employee ratio are presumably special accredited rms (for the details see Section 3), hence these rms are excluded from econometric analysis.
In the sharp regression discontinuity design, the observed outcome is:
Yit=
Yit(1), ifempit>=ct Yit(0), ifempit< ct
Yit(1) =outcome for a randomly chosen population unit if treatment is imposed exogenously Yit(0) =outcome for a randomly chosen population unit if excluded from treatment exogenously.
Whereempis the variable that divides the population into treated and control groups (run- ning variable), in our case the number of employees at the rm), andcis a cuto value ofempit, so rms with number of employees above the cuto belong to the treated group. For assessing the eect of the regulation on disabled employment, the outcome variable Y is the number of disabled employees (disemp), but I also look for discontinuities in variables of rm performance, such a wages, productivity, protability at the quota threshold.
We are looking for the treatment eect at the threshold, that is:
τ =E(Yi(1)−Yi(0)|Xi =c)
τ =µ+−µ−
where
µ+= limx↓c,µ−= limx↑c,µ(x) =E(Yi|Xi =c)
A crucial identifying assumption of the RDD is the exogeneity of selection into the treatment group. However, rms with employees close to the threshold employment level have an incentive to stay or get below the threshold, that is to keep their employment under 20 and under 25 employees after 2012 and avoid the regulation completely. Thus the rm size is endogenous, as rms close to the cuto might self-select themselves between the treatment and control groups.
Non-random rm selection might distort the estimated treatment eect. In the following, I am going to present the results from the baseline (naive) specication, then I am going to adjust the results to account for the potential bias arising from the rm size manipulation.
Figure1and 2show average number of disabled employees in rms by number of employees in dierent years and the tted 4th order polynomial on both sides of the cuto using the optimal plotting method of Calonico et al. (2015). Figure 1 suggest that the most striking increase in disabled employment is not between rms with 19 and 20 employees, but between rms with 20 and 21 employees in 2010. Similarly, in 2012, when the threshold was increased to 25 employees, sharp increase can be detected also between rms with 25 and 26 employees in addition to discontinuity between 24 and 25 employees.
Dierences in rounding rules between employment data in the database and in computation of mandatory quota might explain this "double" discontinuity. Namely, the average headcount is rounded to an integer number in the NAV database, while the quota regulation is based on the average headcount that is rounded to one decimal digit (for details, see Section 2). Consequently, the category of rms with exactly 20 employees in the database is a mixture of treated and non- treated rms.11 Therefore I omitted rms with exactly 20 employees from the RDD regressions as those rms might be both above and below the legal threshold.
The treatment eect is identied nonparametrically by using the method ofCalonico et al.
11This group contains rms with average size between 19.5 and 20.4 employees. These rms show up with 20 employees in the database as their size is rounded to an integer number. However, rms with average number of employees between 19.5 and 19.9 are not subject of the quota regulation, as rounded to one decimal digit, their headcount is below 20 employees, that is these rms are below the legal threshold. However, rms between 20.0 and 20.4 employees are already required to meet the quota or pay the levy.
Figure 1: Average number of disabled employees by rm size, 2008-2010
Figure 2: Average number of disabled employees by rm size, 2011-2012
(2014) that applies kernel-based local polynomials on both sides of the threshold. Specically,
ˆ
τp= ˆµp,+(hn)−µp,−ˆ (hn)
Table 1: Rdrobust results, c=20
2006 2007 2008 2009 2010 2011 2012 τ robust 0.086 0.079 0.017 0.099 0.285 0.244 0.063 robust SE 0.034 0.042 0.041 0.04 0.046 0.043 0.035 adj SE robust 0.044 0.052 0.061 0.05 0.056 0.053 0.055 τ conventional 0.084 0.068 0.028 0.106 0.288 0.245 0.068 conventional SE 0.03 0.036 0.036 0.035 0.039 0.037 0.031 adj conv SE 0.039 0.047 0.055 0.045 0.05 0.042 0.044 bandwidth 6.55 3.365 5.135 6.144 7.086 6.788 5.668 e. # of obs(l) 7563 3004 5294 6672 8819 8188 5663 e. # of obs(r) 3137 1711 2545 2766 2815 2733 2572
order of p 1 1 1 1 1 1 1
Whereµˆp,+(hn) =e00βˆp,+(hn) and µˆp,−(hn) =e00βˆp,−(hn). with:
βˆp,+(hn) =argmin
n
X
i=1
1(empi>=c)(Yi−rp(empi−c)0β)2Khn((empi−c)
and
βˆp,−(hn) =argmin
n
X
i=1
1(empi < c)(Yi−rp(empi−c)0β)2Khn((empi−c)
Whererp = (1, x, ...xp),e0 = (1,0, ..0)∈R,K()is a kernel function,hn is the bandwidth.
The advantage of this method compared to the OLS is its exibility: it allows for non- linear relationship between the running and the dependent variables and the bandwidth is also estimated by minimizing mean squared error instead of an arbitrary choice.(The specication and the results of the OLS model can be found in the Appendix C.)
As the method of computing optimal bandwidth (seeCalonico et al.(2014) does not work be- cause of discrete running variable, I make the running variable continuous by adding a uniformly distributed random number u ∼[−0.5,0.5]to the number of employees emp and estimated the RDD with this created running variable. I simulate the running variable 100 times and present theτ as an average of the 100 estimations. In the table I present the average of standard errors and adjusted standard errors, which were computed by adding the standard deviation of the simulation to the average standard error of the simulations.
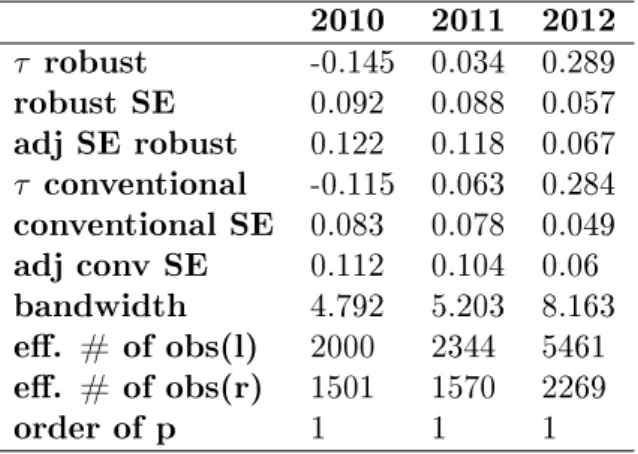
Table 2: Rdrobust results, c=25 2010 2011 2012 τ robust -0.145 0.034 0.289 robust SE 0.092 0.088 0.057 adj SE robust 0.122 0.118 0.067 τ conventional -0.115 0.063 0.284 conventional SE 0.083 0.078 0.049 adj conv SE 0.112 0.104 0.06 bandwidth 4.792 5.203 8.163 e. # of obs(l) 2000 2344 5461 e. # of obs(r) 1501 1570 2269
order of p 1 1 1
The results (Table 1 and 2) show very strong rm reaction to changes in the levy and the quota threshold. There is no signicant discontinuity in disabled employment in 2008, when the levy was very low. The treatment eect is already signicant in 2009, denoting that the expected number of employed disabled is higher above the quota threshold as rms have already started adjustment in 2009. The estimated treatment parameter is much higher in 2010, after the dramatic hike in the non-compliance levy that came into eect in 2010. Strikingly, in 2012, when the threshold was increased to 25 from 20 employees, the discontinuity at the old threshold disappears, but a new discontinuity of similar magnitude emerges above the new threshold, 25 employees, that was missing in 2011.
The parameter can be interpreted as rms just above the threshold employ 0.244-0.285 ad- ditional disabled worker on account of the quota-levy regulation in 2010 -2011, that is roughly 24.4-28.9 percent of the quota is fullled because of the levy. Important to note that this number can be regarded large compared to the few estimations in the literature, for example Lalive et al. (2013) estimate that 4 percent of the quota is fullled thanks to the regulation.
4.3 Endogeneity of rm size
Given the rms' incentive to avoid the quota-levy by keeping their size below the threshold, assumption of random rm selection between treatment and control groups might be violated.
Malo and Pagán (2014) and Mori and Sakamoto (2017) do not nd evidence for signicant rm size manipulation around the disability quota threshold in Spain and Japan. However, as Garicano et al.(2016) shows, size-related regulations might have strong distorting eect around the threshold, if the regulation poses substantial costs to rms. In France, labor costs increase considerably above 50 employees due to various administrative requirements. This huge jump in
marginal labor costs prevent many rms from growing, resulting in a bunching in the distribution of rms below the threshold.
In Hungarian data, distribution of rms around the threshold shows the eort of rms to keep their size below 20 employees in 2010, that is reected in a noteworthy, though not a huge bunching (see Figure3).
Figure 3: Distribution of rms by number of employees, 2008-2010
0 500 1 000 1 500 2 000 2 500
11 12 13 14 15 16 17 18 19 20 21 22 23 24 25 26 27 28 29 30 31 32 33 34 35 36 37 38 39 40
Number of firms
Firm size (number of employees) 2008 2010
However, as the new threshold increases from 20 to 25 persons in 2012, a new bunching emerges at the old threshold, while the old bunching below 20 employees disappears (Figure 4).
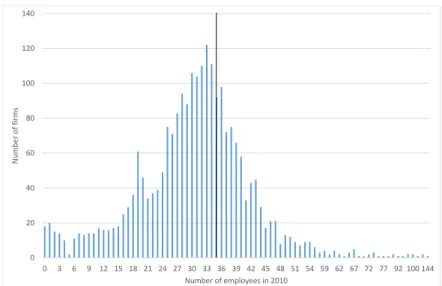
To study more closely the eect of the policy change on rm behavior, I also look at the distribution of rms around the threshold, with 15-25 employees before the levy hike. First, I compare the distribution of these rms with the rm distribution around a placebo threshold, 35 employees.
Figure5and6 show that the distribution around the real threshold is more skewed, and the probability that the number of employees of a given rm is below the threshold is much higher than in case of the placebo threshold.
A similar conclusion arises from comparison of rms near the threshold with no disabled em- ployees before the policy change with rms that already had employed disabled ex-ante, thus
Figure 4: Distribution of rms by number of employees, 2011-2013
-100 100 300 500 700 900 1 100 1 300
11 12 13 14 15 16 17 18 19 20 21 22 23 24 25 26 27 28 29 30 31 32 33 34 35 36 37 38 39 40
Number of firms
firm size (number of employees) 2011 2013
threshold from 2012, 25 employees
already fullled the quota. The rms in the latter group do not have to pay the levy, thus prac- tically not aected by levy increase. The probability that the number of employees is below the threshold after the levy increase is much higher in case of aected than in case of non-aected rms. However, no signicant dierence can be observed between distribution of rms with and without disabled employees at the placebo threshold (35 employees). Table 3 summarizes the relevant probabilities.
Table 3: Distribution of rms in 2010
P rob(emp2010< c|emp2008∈[c−h, c+h]) (1)
Nonrandom rm selection was investigated formally using a nonparametric manipulation
Figure 5: Distribution of rms in 2010 around the real threshold (20 employees), with 15-24 employees in 2008
0 1 2 3 4 5 6 7 8 9 10
0 3 6 9 12 15 18 21 24 27 30 33 36 39 42 45 48 51 54 59 62 67 72 77 92 100 144
Number of firms
Number of employees in 2010
Figure 6: Distribution of rms in 2010 around a placebo threshold (35 employees), with 30-39 employees in 2008
0 20 40 60 80 100 120 140
0 3 6 9 12 15 18 21 24 27 30 33 36 39 42 45 48 51 54 59 62 67 72 77 92 100 144
Number of firms
Number of employees in 2010
test of Cattaneo et al. (2018). The test is based on the consideraton that manipulation of the the running variable might be captured by a discontinuity in the distribution of the running variable around the cuto. The test uses local polynomial distribution estimators and based on a Wald-type statistic where the null hypothesis is the continuity of the running variable at the cuto:
Ho:limemp↓cf(emp) =limemp↑cf(emp), vs H1: limemp↓cf(emp)6=limemp↑cf(emp) The test statistic is the following:
Tp(h) = fˆ+,p(h)−fˆ−,p(h) Vˆp(h)
Where:
Vp2(h) =V[ ˆf+,p(h)−fˆ−,p(h)];
The test rejectsH0 at α level i Tp2 > χ2α−1
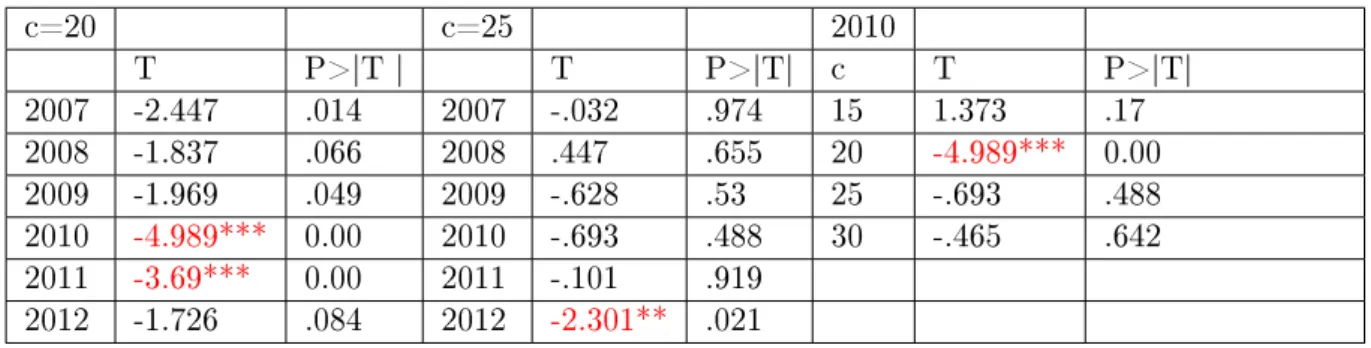
The authors emphasize that the test can be also used for discrete running variables. The results of the density test are summarized in Table4. 12 The density test suggests manipulation of the running variable at c = 20in 2010 and 2011 after increasing the threshold. However, in 2012, the test statistics looses signicance at c= 20and becomes signicant at 5 % signicance level at c = 25 in line with the increase of the threshold. As a robustness check, the test is implemented for placebo thresholds for 2010 and the test shows size manipulation only at the quota threshold, c= 20.
Table 4: Results of manipulation test rddensity for dierent years and placebo cutos
c=20 c=25 2010
T P>|T | T P>|T| c T P>|T|
2007 -2.447 .014 2007 -.032 .974 15 1.373 .17
2008 -1.837 .066 2008 .447 .655 20 -4.989*** 0.00
2009 -1.969 .049 2009 -.628 .53 25 -.693 .488
2010 -4.989*** 0.00 2010 -.693 .488 30 -.465 .642 2011 -3.69*** 0.00 2011 -.101 .919
2012 -1.726 .084 2012 -2.301** .021
Restriction: equal c.d.f. and higher order derivatives assumed on the two sides of the cuto.
Bandwidth selection is based on MSE of dierence and sum of densities,assuming
one common bandwidth.Optimal bandwidth is selected as the lower of the two above criteria
12I also run the test with predened bandwidthh= 5, with no restrictions imposed on the shape of the c.d.f and it yielded similar results.
Figure 7 shows the estimated density function on the two sides of the cuto. In 2010, discontinuity is observed atc= 20, while in 2013, atc= 25
Figure 7: Estimated rm density by rddensity and discontinuity at the threshold,2010
4.4 Discontinuity in rm characteristics
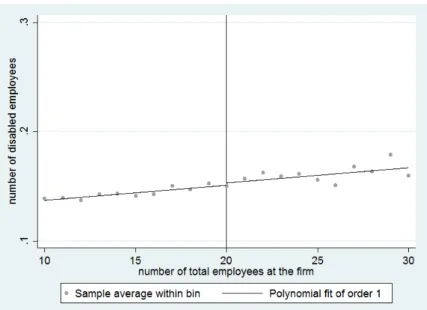
The sectoral and regional composition of the the rms below and above the cuto is very similar on the two sides of the threshold (see Appendix E). I check the total eect of all potential covariates on rm size manipulation with the composite covariate index (seeCard et al.(2007)).
The number of disabled employees in 2010 are regressed on a set of covariates and the predicted value from this regression is plotted against the rm size (Figure8). The following covariates are added as right hand side variables: rm age, dummy for state and foreign ownership, sectoral and regional dummies, lagged values of productivity, average wages, prot ratio, change in the total employment in the two years before the levy increase (2007-2009). The lack of discontinuity in the predicted value around the threshold shows the lack of relationship between rm characteristics and rm size manipulation. For the variables of rm's performance (productivity, average wages, prot ratio, change in the total employment) lagged values show up in the composite covariate index, as the contemporaneous values already include eects of the regulation, and the aim of
the exercise is to nd factors determining rm's choice to keep their size below the threshold.The results suggest that bunching is not systematic, rms' selection into the treatment group is based on unobserved rm characteristics.
Figure 8: Composite covariate index, 2010
I also investigate discontinuity in the contemporenous values of rm performance. As Gar- icano et al.(2016) shows, if many rms choose to avoid the size related regulation by keeping its size below the threshold, we can expect a spike in the productivity distribution of rms at the threshold, and he nds empirical support for these predictions in the case of French rms. I test congestion in productivity and other rm specic variables by running an RD on these variables.
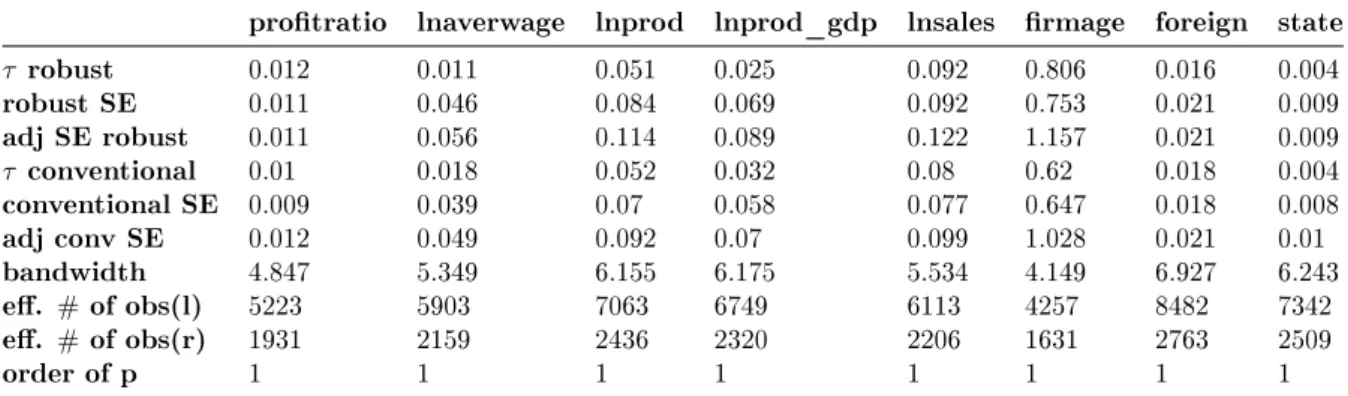
I test the following outcome variables. prof itratio: prot ratio (pretax prot/number of em- ployees), lnaverwage: logarithm of total wage bill/number of employees, lnprod: logarithm of sales/number of employeeslnprod_gdp: logarithm of labor productivity (value added/number of employees)lnsales: logarithm of saleslnprod: logarithm of sales/number of employeesf irmage: rm age (in years), f oreign: dummy variable for foreign owned rms (if share of foreign own- ership is greater than 50%.), state: dummy variable for foreign owned rms (if share of state ownership is greater than 50%).
I look for discontinuity in the deviations of the above variables from the industry average.
The results for 2010 are summarized in Table5. While disabled employment eect is signic- ant in magnitude after the levy hike, the RD regressions show no discontinuity in the variables
that capture rm characteristics.13.
Results conrm that while a non-negligible fraction of rms chooses to avoid the regulation, this decision is not reected in dierence in rm characteristics and performance just below and above the threshold neither before nor after the policy change.
Table 5: Rdrobust results on rm characteristics (2010, c=20)
protratio lnaverwage lnprod lnprod_gdp lnsales rmage foreign state
τ robust 0.012 0.011 0.051 0.025 0.092 0.806 0.016 0.004
robust SE 0.011 0.046 0.084 0.069 0.092 0.753 0.021 0.009
adj SE robust 0.011 0.056 0.114 0.089 0.122 1.157 0.021 0.009
τ conventional 0.01 0.018 0.052 0.032 0.08 0.62 0.018 0.004
conventional SE 0.009 0.039 0.07 0.058 0.077 0.647 0.018 0.008
adj conv SE 0.012 0.049 0.092 0.07 0.099 1.028 0.021 0.01
bandwidth 4.847 5.349 6.155 6.175 5.534 4.149 6.927 6.243
e. # of obs(l) 5223 5903 7063 6749 6113 4257 8482 7342
e. # of obs(r) 1931 2159 2436 2320 2206 1631 2763 2509
order of p 1 1 1 1 1 1 1 1
4.5 Bunching and estimation of the treatment eect
The number of employees is not exogenous as it might be a choice of an optimizing rm that can react to the regulation, and the bunching below the threshold suggests that the assumption of random rm selection between treatment and control groups is indeed violated. Therefore, even if rm choice is based on unobserved characteristics, using the rm size as a running variable might produce a biased estimation of the treatment eect. The direction of the bias is not straightforward a priori. In our case we can assume that "bunchers" have on average lower propensity to employ disabled than rms that do not manipulate their size, so the baseline RD estimations might produce an upward biased treatment eect.
The bias from manipulation is sometimes treated with the so-called doughnut-hole method, that is by dropping observations in the close neighborhood to the cuto. However, by ignoring data close to the cuto we lose important information. Another approach is implemented by Lalive et al. (2013) who calculate the bias arising from bunching with a back-of-the-envelope calculation. The basic idea is a thought experiment: what would be the dierence in mean of disabled employees just above and just below the threshold if there were no bunching, that is rms simply would not have the possibility to avoid the regulation with size manipulation. Lalive et al. (2013) move calculated number of bunchers from just below to just above the threshold,
13No discontinuity can be detected for 2011, for pooled estimation for 2010-2011 with a time dummy for 2011 and 2012 with c=25
and recalculate the raw unconditional mean of disabled employees assuming that they continue to employ disabled .14 Gerard et al.(2016) estimate lower and upper bounds by truncating the distribution of the outcome variable above the cuto, where some units assumed to manipulate the running variable. In both applications, the share of manipulators is calculated using a non- parametric density test. I provide a lower bound to the treatment by reestimating the RD on a simulated sample with a novel method, that is related to the main idea of theLalive et al.(2013) method.
The estimation consists of the following steps:
1. Construction a counterfactual distribution by tting a power law on rm distribution by size, omitting observations with number of employees c+/−5.
2. Calculating number of rms that are below the threshold to avoid the regulation ("bunch- ers") and missing rms from above the threshold by comparing actual and the counterfac- tual distribution in thec+/−5range. (A similar method is used for example inHarasztosi and Lindner (2015)).
3. Constructing a simulated sample such that the resulting rm distribution is smooth by moving calculated number of randomly selected rms above the threshold into the c+ 5 range, while leaving the number of disabled employees unchanged.
4. Re-estimating RD on the simulated sample and repeat this exercise many times.
The lower bound is the average of treatment eects of re-estimated RD from a simulation of 100 draws.
This method is similar in its approach to the method of Lalive et al.(2013). However, I use observations not only just above and just below the cuto, but in a wider range, and give an RD estimation of the treatment eect on the simulated sample.
Graph 9 shows the estimated counterfactual distribution and the rm distribution of the simulated sample after moving randomly selected rms from below to above the cuto in 2010.
Results of RD estimation with the simulated sample are summarized in Table 6. The results show that the lower bound treatment eect is lower than the simple RD estimation by more than
14Lalive et al.(2013) calculate also an upper bound in addition to the lower bound. However, in contrast to the Hungarian case, the quota threshold concerns the number of nondisabled employees in Austria. Consequently, there are rms which choose nondisabled employment below the threshold, but employ a disabled worker if this worker increases the prot. As the running variable inLalive et al.(2013) is the number of nondisabled employees, this group of rms create a downward bias in the treatment eect estimated with baseline RD. In Hungary, the threshold refers the size of the total workforce, hence this downward bias is not relevant.
Figure 9: Counterfactual distribution (t-
ted power law) Figure 10: Firm size distribution in the sim- ulated sample distribution
Table 6: Rdrobust results for lower bound
2008(c=20) 2010 (c=20) 2012 (c=25)
τ robust naive 0.017 0.285*** 0.289***
τ robust simulated 0.008 0.163*** 0.259***
SE robust simulated (0.063) (0.051) (0.077)
40%, but it remains signicantly high. However, in 2012, where the size of the bunching is much smaller, the lower bound is much closer to the simple RD disabled employment eect.
The reaction of rms is strong even if the magnitude of the levy compared to the wages is taken into account. The elasticity of substitution between disabled workers and non-disable workers, that is the percentage change in relative employment of disabled to non-disabled divided by percentage change of relative disabled/nondisabled relative labor cost, is the highest in Hungary among comparable estimations, even if the bias arising from the bunching is taken into account (see Table7)15However,the baseline (below threshold) ratio of disabled is the lowest in Hungary.
Table 7: Comparison of disabled employment eect estimations across countries
coe. threshold quota change in dis dis.emp. quota fulf. %change in levy/average % change in elast. of /nondis. emp. below thr. below threshold dis/non emp labor cost dis/nondis rel. wage substitution
Japan* 1.42 300 2% 0.5% 1.6% 87% 30% 11% -10.2% -2.97
Austria** 0.04 25 5% 0.2% 1.3% 25% 12% 6% -5.9% -2.01
Hun,baseline,2010***, 0.29 20 5% 1.5% 0.6% 11% 264% 31% -23.8% -11.06
Hun, lower bound,2010 0.18 20 5% 0.9% 0.6% 11% 164% 31% -23.8% -6.86
Hun(by 2008 to 2010) 0.27 20 5% 1.3% 0.7% 13% 206% 31% -19.4% -10.64
*based onMori and Sakamoto(2017) and own calculation.The source of average non-disabled wage is DIDA.
**based onLalive et al.(2013) and own calculation.
The elasticity of substitution diers from that ofLalive et al.(2013), as I added obligatory employer social contributions to the nominal wage.
The Source of the employer contributions data is the OECD Taxing Wages database.
***Average labor cost is calculated as average gross earnings plus employer contributions.
15Note that the elasticity of substitution can also be calculated by comparing the above-threshold employment before and after the levy increase. This is shown in the last row in Table 7. This calculation yields similar elasticity of substitution than the baseline RD estimations for 2010.
5 Firm heterogeneity in disabled employment eect
The above section concluded that rms' decision to stay below the threshold is not systematic:
while the bunching clearly shows that a fraction of rms chooses keeping its size below the threshold, selection of rms between the treatment and control groups is based on unobservable rm characteristics. However, the disabled employment eect of the quota-levy regulation in the neighborhood to the threshold is inuenced by observable rm characteristics. As rm selection between control and treatment groups does not depend on rm characteristics, the comparison of the treatment eect in RD regressions estimated on dierent subgroups captures well the heterogeneity in rms' reaction to the quota.
5.1 Eect of rm size
Note that the total quota fulllment that considers all non-special rms above the threshold exhibit a much less favorable picture than the estimated treatment eect around the threshold plus the quota fulllment below the threshold. However, this discrepancy arises from the fact that the ratio of disabled employees at the rm decreases with rm size (see Table8).
Table 8: Ratio of disabled employees and average wages by rm size disabled ratio% wage cost (million HUF)
rm size N mean sd mean sd
0-19 249981 0.09% 1.38% 1186 1620
20-25 2983 1.82% 3.59% 1833 1657
26-49 5383 2.05% 3.54% 1979 1765
50-99 2857 1.93% 3.23% 2256 1903
100-499 2090 1.66% 2.92% 2591 1828
500-999 222 0.92% 1.77% 2963 1616
1000- 160 0.83% 1.42% 3076 1709
It is in part attributable to the much higher average wage level of larger rms, however, rm size remains signicant in explaining the ratio of disabled employees at the rm even after controlling for the wage level (see Table 9). However, one might expect opposite eect of rm size. One-o costs of hiring disabled (for example accommodation of the workplace) per disabled worker are lower for larger rms with more disabled employees and the probability that a disabled employee can fulll a given job might be higher a larger rm with larger variety of jobs. The fact that quota fulllment is worse for larger rms indicates that there are other signicant barriers to employing disabled.
Table 9: Regression for ratio of disabled employment above the threshold, 2010-2013
(1) (2) (3)
VARIABLES disemp_percent disemp_percent disemp_percent
lnemp -0.248*** -0.134*** -0.137***
(0.0204) (0.0203) (0.0208)
lnaverwage -0.815*** -0.650***
(0.0322) (0.0392)
lnprod -0.157***
(0.0233)
d2011 0.097*** 0.127*** 0.132***
(0.0278) (0.0282) (0.0289)
d2012 0.000504 0.122*** 0.110***
(0.0311) (0.0318) (0.0326)
d2013 -0.102*** 0.0398 0.0261
(0.0334) (0.0340) (0.0348)
Constant 2.919*** 8.541*** 8.826***
(0.0916) (0.245) (0.259)
Observations 46,372 46,276 44,952
R-squared 0.006 0.033 0.034
Robust standard errors in parentheses
*** p<0.01, ** p<0.05, * p<0.1
5.2 Role of disabled labor supply and adjustment costs
The fact that majority of rms choose paying the levy instead of hiring disabled workers might be explained by the following reasons:
• High (perceived) adjustment (hiring and ring) costs
• Labor supply shortage of disabled
One can argue that both hiring and ring costs might be higher in case of non-disabled workers. Accommodation of the workplace to be able to receive disabled workers might be costly. Searching costs are probably also much higher in case of disabled workers (see e.g. Silva and Vall-Castelló (2017)).16
However, labor supply shortage is probably a major obstacle to substantial rise in disabled employment. According to the labor force survey, the share of disabled population is roughly in line with European average, but the activity rate of disabled is quite low, only around 25%.
16There are basically two organizations that mediate demand and supply of disabled. The local agencies of National Oce of Rehabilitation and Social Aairs, and the alternative suppliers. Additionally, public employment services (PES) also had matching role. However, operation of these agencies can be characterized by uneven territorial distribution and scarcity.
There were 48 thousand disabled unemployed in 2011, and additional 30-40 thousand can be assessed as discouraged workers.17 Meanwhile, in 2010 the levy was paid after 57 thousand, in 2011 63.5 thousand employees from the quota.18 Assuming that the probability of matching is much lower in case of disabled, the magnitude of these numbers suggest that perhaps there are simply not enough disabled jobseekers who would accept a job at the oered wage in the given regions, industries, jobs.
The low eective labor supply might be related to the institutional environment of other disability policies. Around 2010, most disabled workers were employed in sheltered workplaces - at accredited special institutions and rms - and the empirical evidence suggests that sheltered employment does not facilitate integration into the open labor market. However, availability of personalized rehabilitation services and supported work, that is, comprehensive support for working in the open labor market that proved to be much more eective, is quite limited (Scharle and Váradi (2015),Scharle and Csillag(2016) Adamecz-Völgyi and Scharle(2017)).
Lack of support in getting to the workplace also might impede jobseeking of disabled. Oppor- tunity costs of working might also constrain labor supply. Up to 2014, earning activity terminated eligibility to disability and rehabilitation benets above a certain, relatively low earning level.19 I use regional variation in disabled employment and population to test the role of disabled labor supply and high adjustment costs in rms' reaction. Due to anecdotal evidence, rms in Central Hungary and Western Transdanubia face with disabled labor shortage, while less developed regions - such as South Transdanubia and regions of Great Plain - have excess disabled supply.20
Table10 shows that the share of disabled in total working age population is indeed lower in
17source:Central Statistical Oce
18The data from the database are not comparable in one to one with the unemployed data from the labor force survey.
19The amount of rehabilitation and disability benets has changed many times since 2010, it was linked to the previous income and depended on degree of health impairment. In case of the disability pension (for disabled with high capacity loss and no expected gain from rehabilitation) the eligibility terminated after 6 month of work, if the wage exceeded 70% of previous net wage or the minimum wage. The temporary rehabilitation allowance (for disabled whose working capacity can be restored or improved by rehabilitation, with capacity loss 50-79%) was linked to the previous wage and was relatively generous (50-61% of previous wage, but in average close to the minimum wage), and the eligibility has terminated after 3 month if the wage exceeded 90% of previous wage.
Disabled with low, 40-50% capacity loss are entitled to the regular social allowance, what was at and amounted about one third of the minimum wage. In case of the regular social allowance, the eligibility terminated after 6 month if the wage exceeded 80 % of the minimum wage. Between 2014 and 2016, eligibility to rehabilitation benet is terminated above 20 working hours per week, regardless the earned amount. Since 2016, eligibility is linked to the earnings again in case of both rehabilitation and disabled benets. Specically, eligibility terminates if earnings exceed 150% of the minimum wage for 3 consecutive month.
20for example see the analysis of a HR company, Trenkwalder. https://www.hrportal.hu/hr/megvaltozott- munkakepesseguek-foglalkoztatasa-ketteszakadt-az-orszag-20160203.html
the central and western regions21.
Table 10: Share of disabled population in regions
region code Hungarian name English name % of disabled
in the working age pop.
1 Közép-Magyarország Central Hungary 7.3
2 Közép-Dunántúl Central Transdanubia 9.2 3 Nyugat-Dunántúl Western Transdanubia 9.2
4 Dél-Dunántúl South Transdanubia 16.8
5 Észak-Magyarország North Hungary 14.1
6 Észak-Alföld North Great Plain 14.7
7 Dél-Alföld South Great Plain 14.8
Source:Labor force survey 2011, Central Statistical Oce
However, Hungarian regions dier in many other important aspects, for example average productivity and general wage level. Underdeveloped Eastern regions can be characterized with generally lower wage and less productive rms, and presumably ratio of wages to the levy might also inuence the reaction of rms.
Against this background, I estimate the treatment eect within four subgroups. I divided the regions into two groups, the low supply regions (Central Hungary, Central Transdanubia and western Transdanubia) and high supply regions (South Transdanubia, North Great Plain, South Great Plain and North Hungary). Within each of the two groups, rms are divided into a low wage (below average wage of rms between 15-25 employees in 2010-2011) and a high wage group (above average wage). Figure11indicates that both rm wage level and ratio of the disabled inuences reaction of rms. Firms in low supply regions employ less disabled in average even under the threshold and react less to the quota regulation. Wage level of rms also aects the reaction of rm. Results suggest that rms with lower average wage are more inclined to react to the quota in both low supply and high supply regions. Stronger reaction of low-wage rms was also found at Lalive et al.(2013) for Austrian rms. Given that the levy is at, the levy compared to the average wage level is lower for rms with higher average wages, hence the levy poses lower burden relative to other costs. Note that the wage does not inuence disabled employment below the threshold, where the levy is negligible, indicating that wage level matters as it determines the relative burden the levy poses on the rm. Heterogeneity in the treatment eect is also reected in RD estimates implemented on the four dierent subgroups by wage level and regional supply of disabled (Table11).
212011 LFS data are based on a survey, so number of disabled does not coincide with the number of people with ocial status of changed working capacity, but can be used as an indicator.
Table 11: RD robust estimation for dierent subgroups, 2010-2011
supply low low high high
wage low high low high
mean_tau_robust .151 .101 .628 .314
mean_se_robust .136 .029 .284 .073
adjusted_se_robust* .156 .029 .304 .073 mean_tau_conventional .248 .135 .469 .388 mean_se_conventional .086 .021 .143 .047 adjusted_se_conventional* .093 .023 .15 .052 mean_bandwidth 4.268 21.071 6.779 27.965 e_number_of_obs_l 1566 29213 1420 16150
e_number_of_obs_r 499 3240 497 2367
order_of_polinomial 1 1 1 1
Figure 11: Average number of disabled employees by rm size and rst order polynomial in subgroups, 2010-2011
Results suggest that rms face - or perceive - diculties in hiring disabled employees, however, the eect of disabled ratio on rms' reaction may capture multiple problems both on the employee and on the employer side. The supply is constrained by low capacity of rehabilitation services, disincentive scheme of disabled allowances, lack of support in transportation.
On the demand side, high one-o costs of hiring (for example high searching, accommodating, training costs) and discrimination on the employers' side might be the most important barriers to employing disabled employees. Where the ratio of disabled is lower, the above problems gain momentum and might hinder disabled employment excessively. My results suggest that eciency of quota-levy regulation could be improved signicantly by addressing the above frictions on
disabled labor market. The relative importance of the above factors is a subject of further research.
Table 12: Number of rm in dierent regions in the NAV database (2010) Region NUTS2 Freq (thousand) Percent Cum
1. 204 51.3 51.3
2. 34 8.7 60.0
3. 31 8.0 67.9
4. 27 6.9 74.9
5. 28 7.1 81.9
6. 36 9.1 91.0
7. 36 9.1 100
Total 398 100
6 Conclusion
This paper demonstrates intense reaction of Hungarian rms to the increased levy accompanied to the disability quota. In 2010, the Hungarian levy was increased drastically, by 454 percent, reaching an exceptionally high level compared to average wages. This measure posed a signicant burden on rms in the middle of the nancial crisis. There are a few papers in the literature that analyze the eect of the disability quota with a moderate levy and usually nd small or insignicant eect. The Hungarian case demonstrates how rms can cope with the quota if the accompanied levy is really substantial and creates a strong nancial incentive. Many rms near the threshold clearly make an eort to avoid the regulation by keeping the size of their workforce below the quota threshold. This attempt results in a remarkable bunching in rms' distribu- tion below the threshold employment level. Firm size endogeneity might compromise baseline regression discontinuity estimations as the random assignment of rms between treated and con- trol groups is violated. However, I could not detect any discontinuity in rm specic variables and these variables do not seem to inuence rms' choice to stay below above the threshold, suggesting that selection between treatment and control groups is based on unobservable rm characteristics. I add a lower band to the disabled employment eect by re-estimating the RD on a simulated sample. The results suggest that disabled employment eect of the quota-levy sys- tem is very high in international comparison even after controlling for the potential bias caused by the bunching.
However, the eectiveness of the policy is questionable. Though the disabled employment