10.32565/aarms.2019.3.2
Examining Some Key Issues of the Maintenance Organisation from the Point of View
of the Operator and the Manufacturer
József GYARMATI
1An important fundamental question of maintenance organisation after the selection of maintenance systems is the determination of maintenance cycle times. With the help of the cycle time, it is possible to determine how often the most exposed parts and lubricants have to be replaced. The replacement of components or lubricants can be expensive, but performing these activities at the appropriate time will increase the reliability of the machines. With more frequent maintenance, the number of unexpected failures can be reduced, along with the resulting costs, while maintenance costs will also increase. The paper analyses how to determine the maintenance cycle time to the minimum of both of these cost components.
The rest of the analysis deals with the analysis of the strategy of the manufacturer if it is in the interest of performing maintenance and repairs done. A further objective of the study is to determine the impact of the cost increase of unexpected failure resulting from maintenance failure on the minimum of the total cost.
Keywords: maintenance, failure, cost minimum, military equipment
Introduction
Machinery and equipment during their lifetime are undergoing physical, chemical and biological changes. As a result of these changes, the parameters of each component may also change. The result of the change can be, for example, the wear of a metal part due to friction, or the softening of a spring and thus the reduction of the spring force.
Problems also occur with parts subject to high friction, such as increasing gap of bearings due to wear of the rolling surfaces or a change in the viscosity of the lubricants, or an increase in the concentration of particles insoluble in the lubricant.
As a result of these processes, the machines can fail during their service life. The failure can be caused directly or indirectly by a change in the condition of a component. A direct consequence can be the break of a clutch spring, which may cause a critical interruption in the power transmission by the failure of the clutch. Indirect failure occurs when the flow
1 Ph.D., Associate Professor, National University of Public Service, Faculty of Military Science and Officer Training, Department of Military Technology; e-mail: gyarmati.jozsef@uni-nke.hu; ORCID: 0000-0001-
properties of an oil change, that results in insufficient lubrication, which for example can result in a bearing failure.
The decisive parameters of each component in terms of failure may change due to the following reasons: [1] [2]
• wear;
• fatigue;
• aging;
• corrosion.
The listed processes occur in time, but the failure can be from different causes:
• suddenly;
• gradually.
Breakdown can occur suddenly by a fracture if there is an overload in some parts, but the same fracture can occur due to material fatigue, which is a process that is gradually happening at the same time where the result is the sudden failure itself.
Unexpected, unforeseeable failure can occur:
• some unknown material defect;
• overload;
• due to irregular machine operation.
The processes that occur in time can be predicted either by knowing the relations between the cause and effect or by using statistical methods. Whenever the operator has this information at his disposal, systematic measures can be introduced to prevent progressive failures and to eliminate sudden failures, such as:
• countermeasure type activities;
• preventive type activities.
The aim of countermeasure type activities are the various levels of repairs that are used to restore a machine that has already failed. Different levels of repairs can be listed for countermeasure technologies. Until the 1950s, practically no maintenance system can be mentioned, where the operation practically continued until the failure. The system is known as run to failure in the source. [7]
The aim of preventive type activities are to prolong the expected lifetime of the machines, or to restore the machine. These include cleaning, maintenance and technical condition survey. After the 1950s, maintenance systems developed drastically and these systems define preventive technologies according to different principles.
This allows the operator to select the most appropriate system for the applied strategy.
Major maintenance organisation models are: [8] [9]
• Preventive Maintenance (PM);
• Risk Based Maintenance (RBM);
• Reliability Centred Maintenance (RCM);
• Total Productive Maintenance (TPM).
Based on the previously described processes, it can be stated that the failure can be considered an event that will most certainly occur due to wear processes. Changing the frequency of maintenance changes not only the reliability but also the operating costs, which include the costs of preventive and the countermeasure type technologies. [3]
This paper examines how maintenance cycles determine the overall costs, affects the operator and how this has an impact on the manufacturer. In other words, what is the relation between the quality and the costs, and how the operator and the manufacturer are interested in the development of these costs.
Description of Failure Statistics
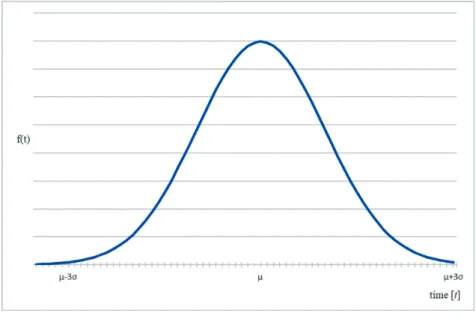
According to [4], those failures that are gradually generated by a mechanical process can be described by using a normal distribution with a density function:
( ) = √ ( ) (1)
where: µ is the expected value of the distribution and σ is the standard deviation.
The probability theory interpretation of the density function is:
( < ≤ ) =∫ ( ) (2)
meaning that the probability of τ is between the values of a and b equals the definite integral of the density function between the values of a and b.
Figure 1. The density function of normal distribution.
[Edited by the author.]
In the formulation of reliability theory, the probability that the failure occurs in the time interval of {a, b} is the same as the definite integral of the density function between a and b (Figure 1). The primitive function of the density function is the cumulative distribution function:
( ) = ( < ) (3)
meaning that, the probability of failure up to time t corresponds to the value of the cumulative distribution function at t. If the maintenance cycle is scheduled for time t0 then the probability of the failure up to t0 using (3) is:
( ) = ( < ) (4)
According to [4], the cumulative distribution function of normal distribution is strictly monotonous, so the probability of failure increases with the increase of t0. Thus, by extending the time of maintenance, the probability of failure increases, but with reducing the cycle time the number of maintenance increases. These are two opposing processes where the time of the minimal cost of maintenance can be selected according to the joint inquiry of the two costs. Naturally, the operator may choose a different strategy without considering the total costs and can establish the time of maintenance compared to the level of reliability expected by Equation (1) and Figure 1.
( ) = (5)
by solving the equation where pmax is the upper limit (supreme) of the probability of failure and the value determined by the operator. In military terms, (1 – pmax) is the bottom-up (infimum) value of the probability of availability, or the military usability.
Possible Strategies of the Operator and the Manufacturer
The time of maintenance can be selected by the operator according to two different strategies as described in the previous section:
• minimising the total cost of maintenance and repair;
• according to expected reliability (the military usability).
If the operator requires the minimum cost, the two costs must be calculated as a function of the maintenance cycle time.
According to [4], the process of deterioration of a defective part can be considered to have a normal distribution. The time during which the failure will definitely occur will be infinite because:
(∞) = ( <∞) = 1 (6) where: F(∞) is the value of the distribution function at infinity
τ: is the probability variable describing the failure and τ N(μ, σ) that is τ has a normal distribution with μ expected value and σ dispersion.
It is known from the formula of normal distribution, where:
∫ ( ) = 0.998 (7)
The expected cost of repairs resulting from unexpected failures can be determined as follows:
M(Kj(t)) = F(t) Kj (8)
where: Kj: is the cost of repair due to unexpected failure
M(Kj(t)): is the expected cost of repair due to unexpected failure without maintenance at time t.
The total cost of maintenance:
M ( ) = (9)
where: M(Kc(t)) is the total cost of maintenance in the interval of {0, tc} if the maintenance cycle time is t;
Kc: is the maintenance cost;
tc: is the time during which without any maintenance the failure can be guaranteed and tc=μ+3σ according to Equation (7).
The total cost is:
( ) = ( ) + ( ) = ( ) + (10)
The aim of the operator is to minimise Equation (10), for this, the following equation has to be solved:
̇ ( ) = 0 (11)
The first derivative of Equation (10) is:
̇ ( ) = ( ) − (12)
where:
( ) = √ ( ) (13)
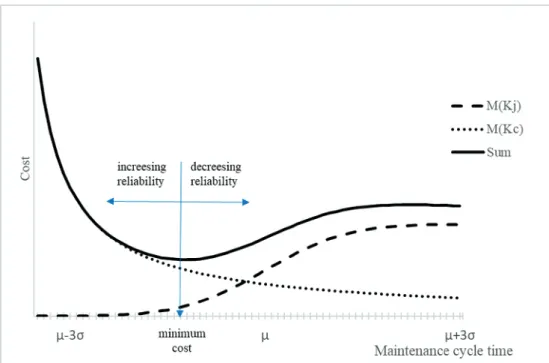
Equation (11) cannot be solved analytically because Ks(t) cannot be derived, that is why only a numerical solution can be expected. The minimum of the sum of the two costs is defined graphically in Figure 2.
Figure 2. Changes in maintenance and repair costs depending on the maintenance cycle time. [Edited by the author.]
Figure 2 shows the evolution of maintenance and repair costs as a function of cycle time.
The cost of maintenance increases with the reduction of the cycle time, because more maintenance is required in the given period. Part or lubricant replacement should be done more frequently, which will result in the loss of increasing uptime reserve in favour of reliability. Accordingly, the cost of maintenance increases with the reduction of the cycle time and decreases with its growth, so in this case it is a strictly monotonous decreasing function.
The cost of repairs due to unexpected failures increases with the increase maintenance cycle time, as the probability of failure increases with the operation time, as shown in Figure 1 and Equation (3).
The sum of the two functions is shown by a continuous line in Figure 2. The curve has a clearly visible minimum, indicated by an arrow.
The operator who wishes to minimise the costs, should solve Equation (11) using the graphical method shown in Figure 3. Accordingly, the maintenance cycle time will be determined in such a way that the operator can minimise the costs of repair and maintenance resulting from unexpected failure.
The strategy of the manufacturer may differ from the operator if the manufacturer is interested in repairs or in maintenance, too. But it is not the aim to minimise these costs, but to maximise the income within a certain limit, which means that it may be necessary to deviate from the minimum maintenance cycle time in a positive or negative way to increase the costs, in order to increasing the income. This can be solved in two ways, as shown in Figure 2, by increasing the maintenance cycle time (which reduces reliability) or reducing the maintenance cycle time, which improves the reliability.
It is in the interest of the manufacturer that the customer, who is also the operator, is satisfied with the product, so it is not advisable to resort to any operation that would seriously compromise reliability. However, by reducing the maintenance cycle time, the income and reliability can be increased at the same time.
Overall, it can be stated that, the manufacturer compared to the operator may prescribe less maintenance cycle times as shown in Figure 2, which means higher overall reliability for the operator.
The Effect of Maintenance and Repair Costs on the Cost Minimum
The cost of repairs resulting from unexpected failures consists of three main components:
• replacing the defective component;
• replacing or repairing the main parts that became defective in the consequence of the defective parts;
• other indirect costs of the asset.
The cost components listed above are best analysed by an example. For example, due to a change in the viscosity of the applied lubricant in a given gearbox, the bearings may be damaged (bearing seize up), but in extreme cases, it can cause a complete failure of the whole gearbox by a break of a tooth.
From the three cost components, the first one can be estimated with the best accuracy.
The prices of the components or lubricants and the work-hours needed to replace it and their costs are considered to be known in advance. The situation is more difficult with the other two components. Various fault tree analyses are performed on faults caused by a given component failure. [5] [6] In our case, the question is generally formulated, so these procedures are not applicable here.
Defining the third cost component is a problem in military practice. The absence of a training equipment affects the quality and duration of the training, which clearly has adverse effects, but can only be estimated, with a high standard of deviation, and this can degrade the accuracy of the calculations, so these costs are not taken into consideration in further calculations.
For a general approach, and not for a particular failure, the following ratio should be assumed
(14)
and the change in the cost minimum given in Figure 2 should be examined through this.
The ratio of formula (14) can be varied so that the value of Kc can be considered constant and the Kj, is the variable, so a function from equation (10) can be defined as a two-variable function:
ö( , ) = ( ) + (15)
and the solution is:
ö( , )
= ö( , ) = 0 (16)
The analytical solution is still not possible, the system of Equations (16) can only be solved numerically or graphically, so the solution will be determined graphically.
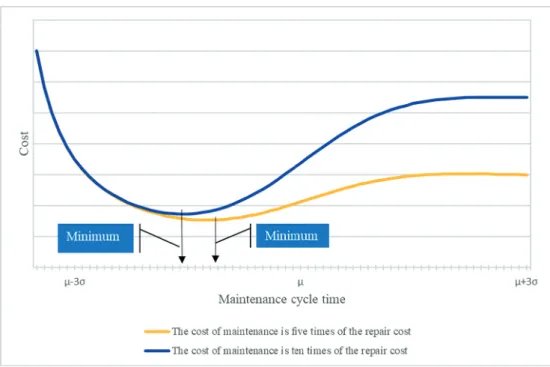
Figure 3. The variation in the ratio of repair and maintenance costs to the minimum of the total costs. [Edited by the author.]
Figure 3 shows two possible situations in which the effect of the change in the quotient of formula (14) on the maximum cost can be seen. In the figure, the dotted line represents the case where the cost of maintenance is five times of the repair cost, and the dashed line is the case where the repair cost is ten times.
Figure 3 shows clearly that with the increase of repair costs, the maintenance cycle time is reduced. The greater the damage caused by the failure of a component, the sooner the maintenance have to be performed, that is the replacement of the defective part.
Summary
As a result of the procedures presented in the paper, it can be stated that there is an optimum time for the operator to carry out the maintenance that has a minimum of the total cost of maintenance and repairs. The operator can also choose a different strategy besides the minimum cost, where the operator determines the maintenance according to the expected reliability.
The manufacturer, if performing maintenance and repairs, is not interested in reaching the minimum cost of the whole operation, but is interested in increasing its own profit, which in turn leads to a reduction in maintenance cycle times. In this case, reliability will increase, but the cost of the remaining operating reserve will be higher, which will result in additional costs for the operator.
If the cost of repairs increases, this will result in a reduction in the maintenance cycle time.
References
[1] TIBOLD V.: Gépek üzemeltetése a mezőgazdaságban. Budapest, Mezőgazdasági Kiadó, 1977.
[2] GAÁL Z. – KOVÁCS Z.: Megbízhatóság, karbantartás. Veszprém, Veszprémi Egyetemi Kiadó, 1998.
[3] SCHAEFER E.: Megbízhatóság az elektronikában. Budapest, Műszaki Könyvkiadó, 1983.
[4] TURCSÁNYI K.: A haditechnikai eszközök megbízhatóságának elméleti alapkérdései.
Budapest, Zrínyi Miklós Nemzetvédelmi Egyetem, 1999.
[5] HIXENBAUGH, A. F.: Fault Tree for Safety. Seattle: The Boeing Company, D6-53604, 1968.
[6] STAMATELATOS, M. – VESELY, W. – DUGAN, J. – FRAGOLA, J. – MINARIC, J. – RAILSBACK, J.: Fault Tree Handbook with Aerospace Application. Washington, D.C., National Aeronautics and Space Administration, 2002.
[7] FREDRIKSSON, G. – LARSSON, H.: An analysis of maintenance strategies and development of a model for strategy formulation. Göteborg, Department of Product and Production Development, Division of Production Systems, Chalmers University of Technology, 2012.
[8] GERTSBAKH, I.: Reliability Theory with application to Preventive Maintenance. Berlin, Springer Verlag, 2005. DOI: https://doi.org/10.1007/978-3-662-04236-6_7
[9] LEVITT J.: The Handbook of Maintenance Management. New York, Industrial Press, 2005.